© nOps 2025. All Rights Reserved.
Featured Ebook The CFO’s Guide to AWS Commitments - Download Now
 Skip to content
You must periodically review amazon RDS database instances to assess their utilization. Any discovered underutilized RDS Instance should be downsized (resized) to avoid undesirable costs.
We consider an RDS database instance as “underutilized” when it meets the following criteria:
average CPU utilization has been less than 30% for the last 7 days.total number of ReadIOPS and WriteIOPS recorded per day for the previous7 days has been less than 100 on average.The following AWS CloudWatch metrics can be used to detect underutilized RDS instances:
nOps uses this rule in the AWS Well-Architected Framework Lens. It can also help you when checking workloads’ compliance in preparing the SOC 2 Readiness Report.
Downsizing underused RDS database instances can have a tremendous positive impact on your monthly AWS cost. For example, downgrading a db.m5.2xlarge RDS PostgreSQL database instance to a db.m5.large instance due to CPU and IOPS underuse allows you to save roughly 25% (as of September 2021).
To identify any underutilized RDS database instances currently available within your AWS account, perform the following:
1. Log in to the AWS Management Console.
2. Navigate to the RDS dashboard at https://console.aws.amazon.com/rds/.
3. In the navigation panel, under RDS Dashboard, click DB Instances.
4. Select the RDS Instance that you want to examine.
5. Click the Monitoring tab from all tabs.
6. On the monitoring panel displayed for the selected instance, perform the following actions:
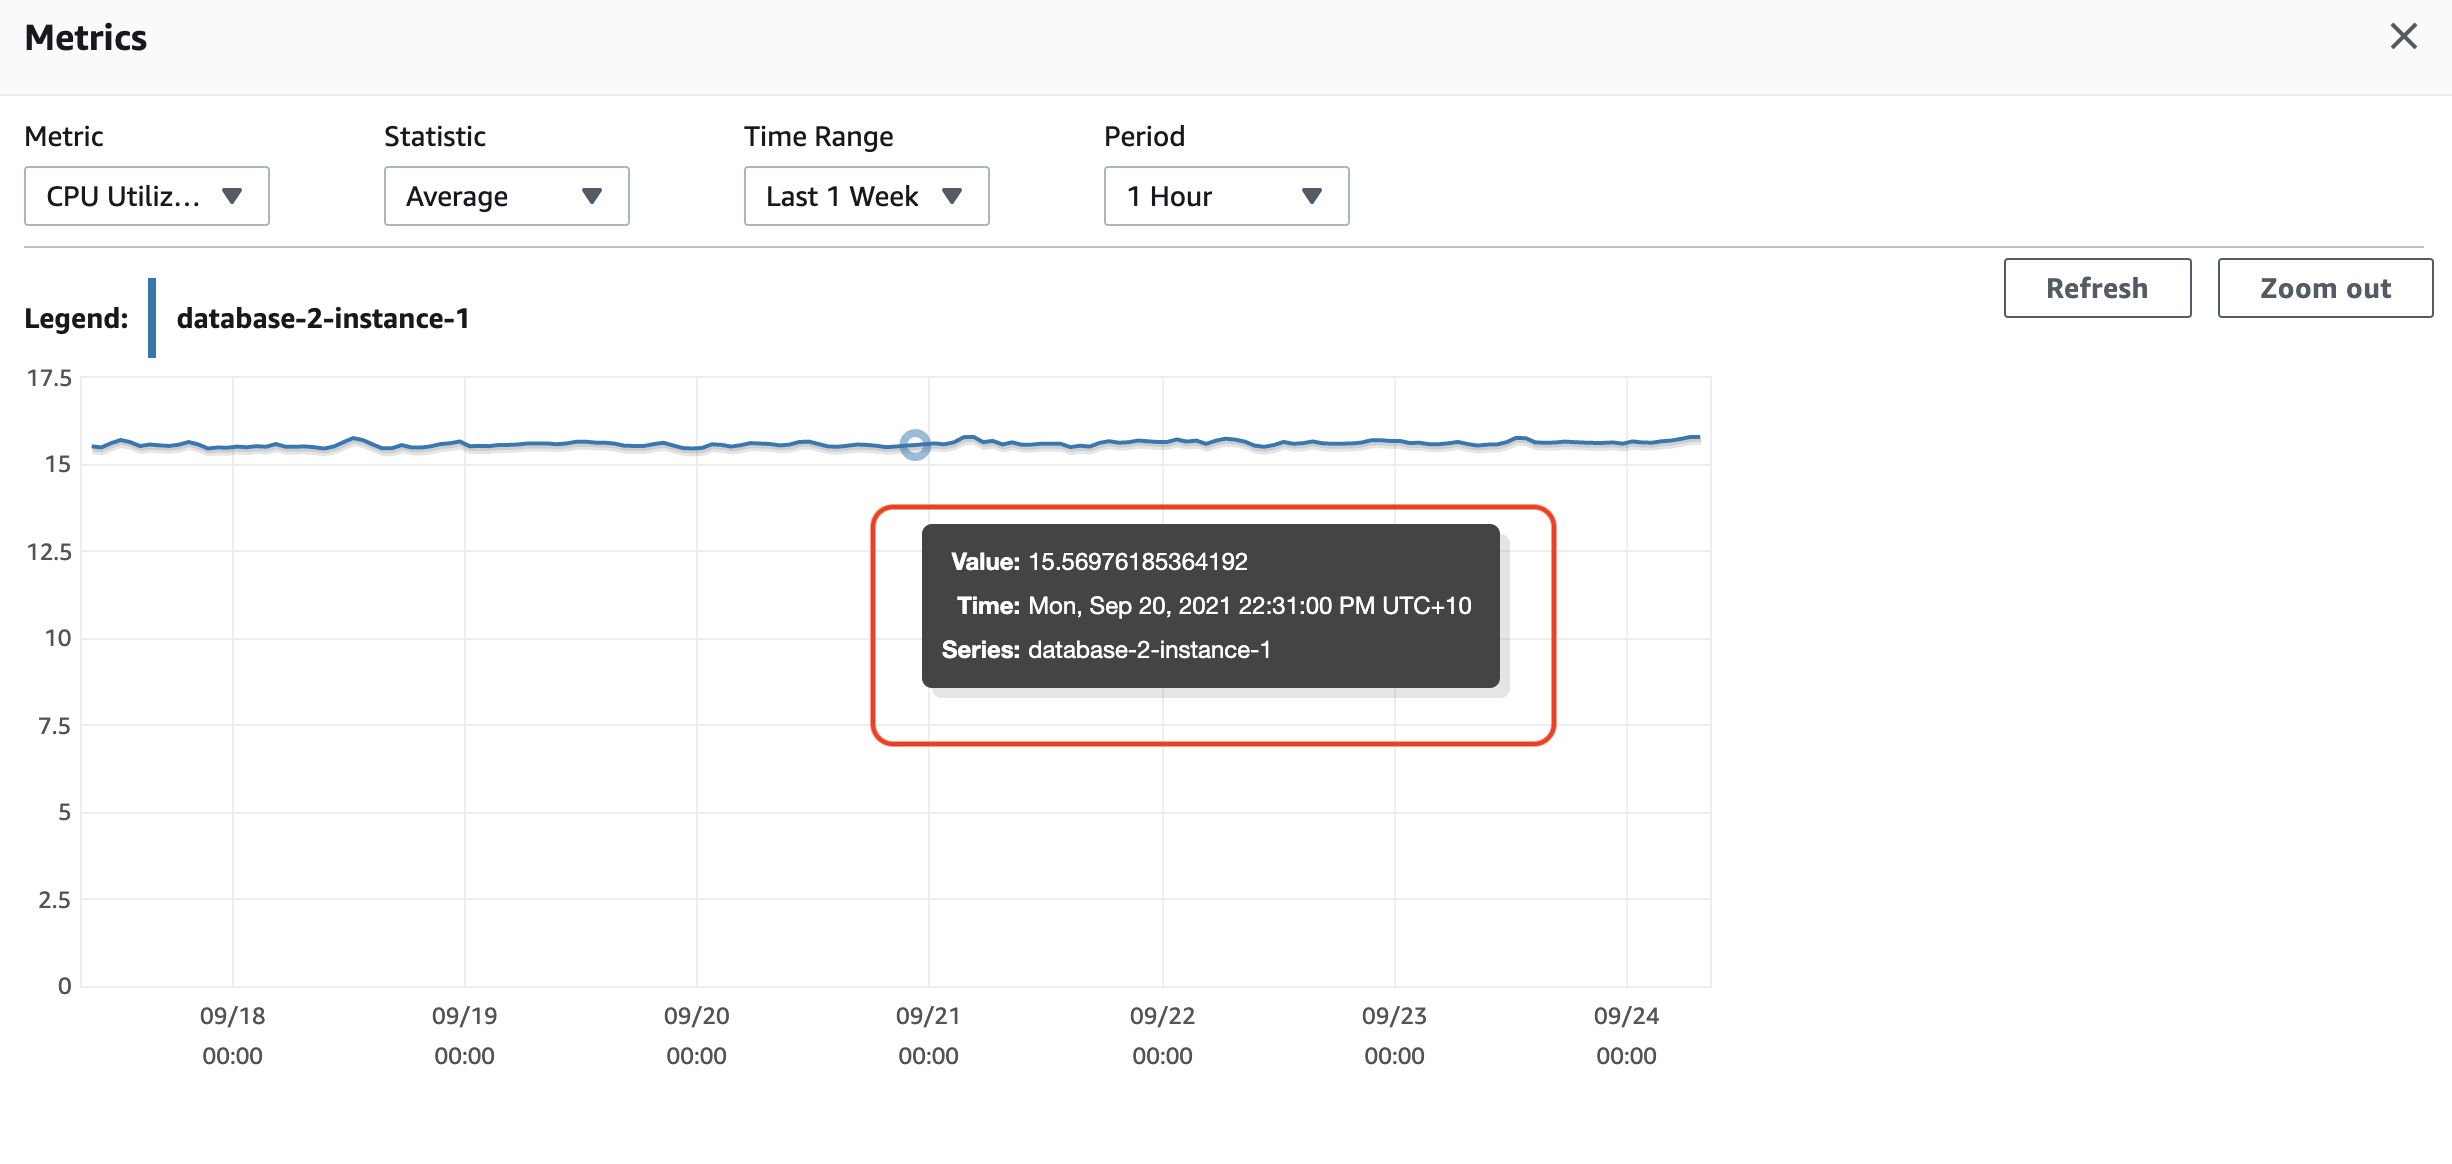
a. Click on CPU Utilization (Percent) usage graph thumbnail. This will open the database connection usage details. Set the following parameters:
Once the monitoring data successfully loads, confirm the instance CPU usage for the past seven days. If the average usage has been less than 30%, the RDS instance in question fits the conditions for an under-utilized instance.
You can now navigate back to the dashboard.
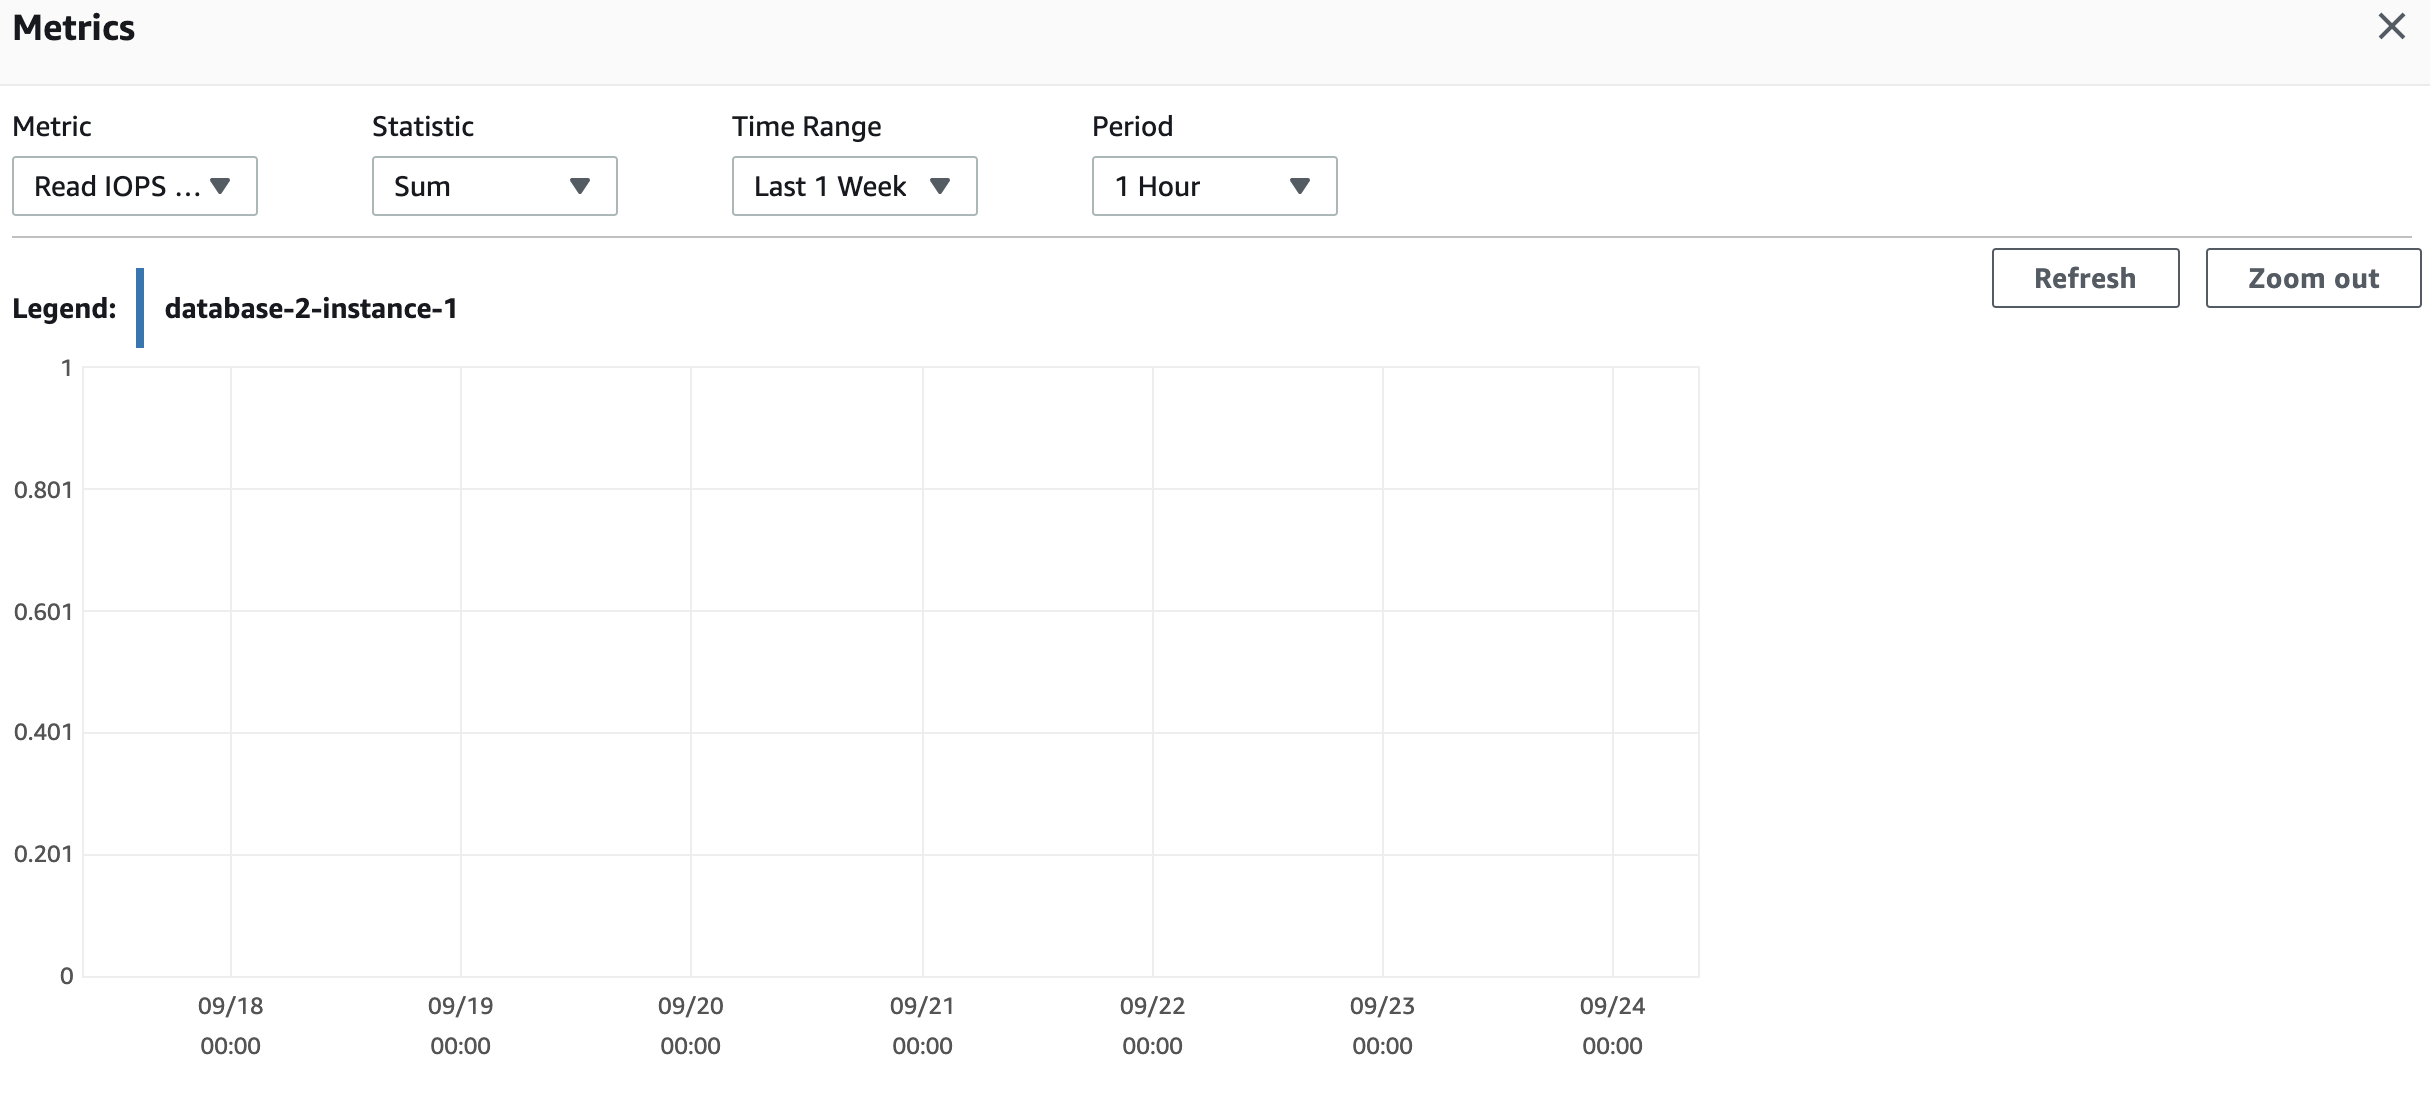
b. Click on Read IOPS(Counts/Second) usage graph thumbnail. This will open the database connection usage details. Set the following parameters:
Once the monitoring data successfully loads, check the total number of Read operations per second for the past seven days. If the recorded total number of ReadIOPS has been less than 100, the RDS instance in question fits the conditions for an under-utilized instance.
You can now navigate back to the dashboard.
c. Click on Write IOPS(Counts/Second) usage graph thumbnail. This will open the database connection usage details. Set the following parameters:
Once the monitoring data successfully loads, check the total number of Write operations per second for the last seven days. If the recorded total number of WriteIOPS has been less than 100, the RDS instance in question fits the conditions for an under-utilized instance.
You can now navigate back to the dashboard.

Suppose all the stipulated conditions specified in Step 6a, 6b, and 6c are met. In that case, the RDS instance in question can be conclusively considered “underutilized” and should be downsized or terminated to prevent it from accruing high costs.
7. Other provisioned RDS instances within the current region should be inspected using steps 4-6.
8. Change the AWS region from the navigation bar and repeat the audit process for other regions.
1. Run describe-instances command (OSX/Linux/UNIX) to fetch the IDs of all the RDS database instances available in the selected AWS region:
aws rds describe-db-instances \\
	--region us-east-1 \\
	--query 'DBInstances[*].DBInstanceIdentifier'
2. The command will output the Instance identifiers as shown below:
[
    "database-2-instance-1",
    "exampledb"
]
3. Now we need to get CloudWatch Metrics data for CPUUtilization, ReadIOPS, and WriteIOPS for the RDS Instance that you want to examine. Let’s say we select database-2-instance-1 from the above list.
a. Run get-metric-statistics command (OSX/Linux/UNIX) to get the statistics recorded by AWS CloudWatch to determine the usage:
CPUUtilization as the metric name--start-time (start recording date) and --end-time (stop recording date) parameters to select a time range.--period parameter value to your desired time (seconds) requirements.--statistic equal to AverageThe following example returns the average CPUUtilization of an AWS RDS instance identified by the the name database-2-instance-1, during a 7 days period using 1 hour granularity:
aws cloudwatch get-metric-statistics \\
	--region us-east-1 \\
	--metric-name CPUUtilization \\
	--start-time 2021-09-13T00:00:00 \\
	--end-time 2021-09-20T00:00:00 \\
	--period 3600 \\
	--namespace AWS/RDS \\
	--statistics Average \\
	--dimensions Name=DBInstanceIdentifier,Value=database-2-instance-1
The above CLI command should return the DatabaseConnections usage details similar to the one shown below:
{
    "Label": "CPUUtilization",
    "Datapoints": [
        {
            "Timestamp": "2021-09-14T22:00:00+00:00",
            "Average": 15.575619276696171,
            "Unit": "Percent"
        },
        {
            "Timestamp": "2021-09-18T05:00:00+00:00",
            "Average": 15.52762673363722,
            "Unit": "Percent"
        },
        {
            "Timestamp": "2021-09-13T13:00:00+00:00",
            "Average": 15.499040057646235,
            "Unit": "Percent"
        }
        ...
        {
            "Timestamp": "2021-09-18T01:00:00+00:00",
            "Average": 15.566203184435981,
            "Unit": "Percent"
        },
        {
            "Timestamp": "2021-09-14T05:00:00+00:00",
            "Average": 15.531749153977962,
            "Unit": "Percent"
        },
        {
            "Timestamp": "2021-09-17T12:00:00+00:00",
            "Average": 15.499815792251654,
            "Unit": "Percent"
        }
    ]
}
If the average CPUUtilization has been less than 30% for the last 7 days, the RDS instance in question meets the conditions of an underutilized instance.
b. Run get-metric-statistics command (OSX/Linux/UNIX) to get the statistics recorded by AWS CloudWatch to determine the usage:
ReadIOPS as the metric name--start-time (start recording date) and --end-time (stop recording date) parameters to select a time range.--period parameter value to your desired time (seconds) requirements.--statistic equal to SumThe following command sample returns the total number of read operations per second of an AWS RDS instance identified by the the name database-2-instance-1, during a 7 days period using 1 hour granularity:
aws cloudwatch get-metric-statistics \\
	--region us-east-1 \\
	--metric-name ReadIOPS \\
	--start-time 2021-09-13T00:00:00 \\
	--end-time 2021-09-20T00:00:00 \\
	--period 3600 \\
	--namespace AWS/RDS \\
	--statistics Sum \\
	--dimensions Name=DBInstanceIdentifier,Value=database-2-instance-1
The above CLI command should return the DatabaseConnections usage details similar to the one displayed below:
{
    "Label": "ReadIOPS",
    "Datapoints": [
        {
            "Timestamp": "2021-09-14T09:00:00+00:00",
            "Sum": 14.532050177566735,
            "Unit": "Count/Second"
        },
        {
            "Timestamp": "2021-09-17T16:00:00+00:00",
            "Sum": 14.532469033559092,
            "Unit": "Count/Second"
        },
        {
            "Timestamp": "2021-09-15T18:00:00+00:00",
            "Sum": 14.533236263116349,
            "Unit": "Count/Second"
        },
        {
            "Timestamp": "2021-09-14T22:00:00+00:00",
            "Sum": 14.533535085924886,
            "Unit": "Count/Second"
        },
        ...
				{
            "Timestamp": "2021-09-17T22:00:00+00:00",
            "Sum": 14.532712919973251,
            "Unit": "Count/Second"
        },
        {
            "Timestamp": "2021-09-13T06:00:00+00:00",
            "Sum": 14.532226864261435,
            "Unit": "Count/Second"
        },
        {
            "Timestamp": "2021-09-16T13:00:00+00:00",
            "Sum": 14.533181296894648,
            "Unit": "Count/Second"
        },
        {
            "Timestamp": "2021-09-16T00:00:00+00:00",
            "Sum": 14.532808417260272,
            "Unit": "Count/Second"
        }
    ]
}
If the total number of Read Operations per second has been less than 100 for the last 7 days, the RDS instance in question meets the conditions of an underutilized instance.
c. Run get-metric-statistics command (OSX/Linux/UNIX) to get the statistics recorded by AWS CloudWatch to determine the usage:
WriteIOPS as the metric name--start-time (start recording date) and --end-time (stop recording date) parameters to select a time range.--period parameter value to your desired time (seconds) requirements.--statistic equal to SumThe following example returns the total number of read operations per second of an AWS RDS instance identified by the the name database-2-instance-1, during a 7 days period using 1 hour granularity:
aws cloudwatch get-metric-statistics \\
	--region us-east-1 \\
	--metric-name ReadIOPS \\
	--start-time 2021-09-13T00:00:00 \\
	--end-time 2021-09-20T00:00:00 \\
	--period 3600 \\
	--namespace AWS/RDS \\
	--statistics Sum \\
	--dimensions Name=DBInstanceIdentifier,Value=database-2-instance-1
The command output should return the DatabaseConnections usage details as shown below:
{
    "Label": "WriteIOPS",
    "Datapoints": [
        {
            "Timestamp": "2021-09-14T09:00:00+00:00",
            "Sum": 8.183157548601072,
            "Unit": "Count/Second"
        },
        {
            "Timestamp": "2021-09-17T16:00:00+00:00",
            "Sum": 8.649874233695844,
            "Unit": "Count/Second"
        },
        {
            "Timestamp": "2021-09-15T18:00:00+00:00",
            "Sum": 8.066744805806906,
            "Unit": "Count/Second"
        },
        {
            "Timestamp": "2021-09-14T22:00:00+00:00",
            "Sum": 7.866573403931301,
            "Unit": "Count/Second"
        ...
				{
            "Timestamp": "2021-09-13T06:00:00+00:00",
            "Sum": 7.53351345372748,
            "Unit": "Count/Second"
        },
        {
            "Timestamp": "2021-09-16T13:00:00+00:00",
            "Sum": 8.61645705545578,
            "Unit": "Count/Second"
        },
        {
            "Timestamp": "2021-09-16T00:00:00+00:00",
            "Sum": 8.916765333812112,
            "Unit": "Count/Second"
        }
    ]
}
If the total number of reported Write Operations per second has been below 100 for the past seven days, the RDS instance in question meets the conditions of an underutilized instance.
If the usage data returned above satisfies all conditions, the selected RDS database instance is considered “underutilized” and can be safely downsized.
4. You should repeat step 3 for the rest of the provisioned RDS instances in the current region. This is to help confirm the CPU, ReadIOPS, and WriteIOPS metrics usage data recorded within the specified time frame.
5. Repeat the entire audit process (Steps 1-4 )for other regions. To select a new region, update the –region command parameter value.
To resize (downsize) any RDS database instance that is currently running in “underutilized” mode, perform the following actions:
Ensure the selected RDS is neither used for critical workloads in Production nor a part of critical suite of components in an application.
In order to resize a database without any downtime, you will be required to create a full snapshot of the current RDS instance and then use this snapshot to launch a new database instance with desired DB class and storage type.
1. Log in to the AWS Management Console.
2. Navigate to the RDS dashboard at https://console.aws.amazon.com/rds/.
3. In the navigation panel, under RDS Dashboard, click DB Instances.
4. Select the idle RDS Instance that you want to examine.
5. Click Modify on the top-right corner.
6. Select the following Downsize options:
a. Change the DB instance class e.g from db.m5.2xlarge to db.m5.large
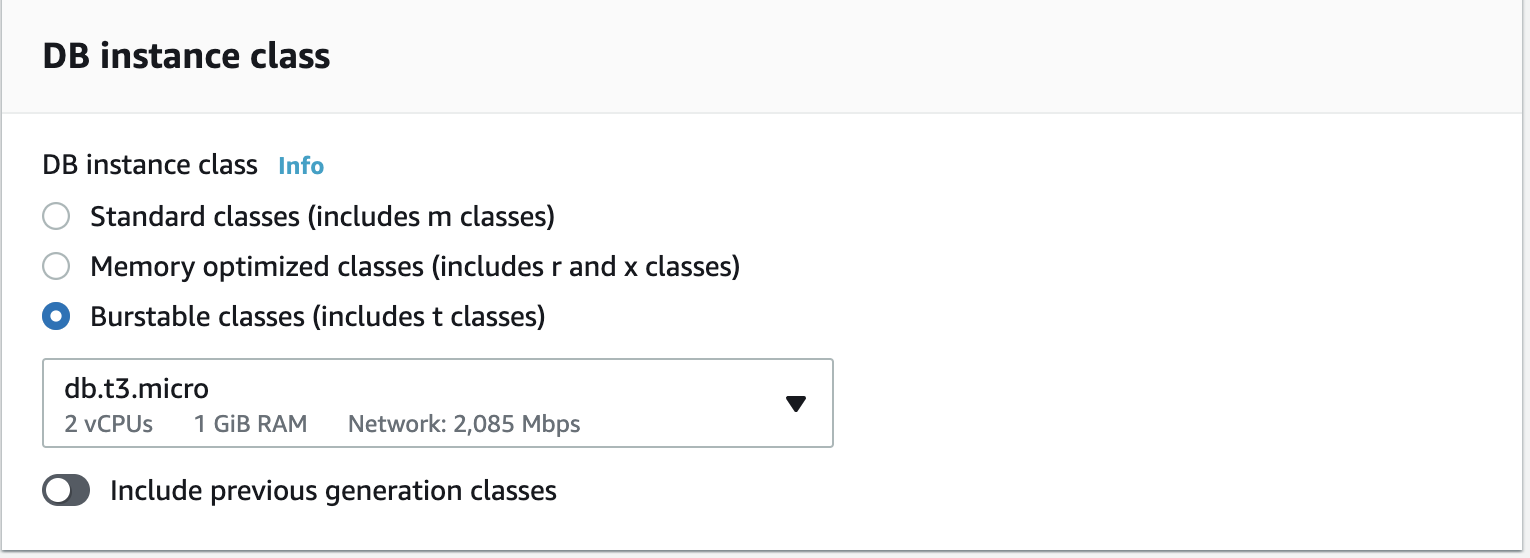
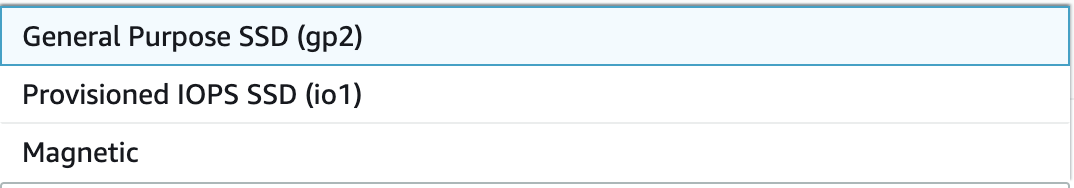
b. Change the Storage Type, e.g, from Provisioned IOPS to General Purpose SSD
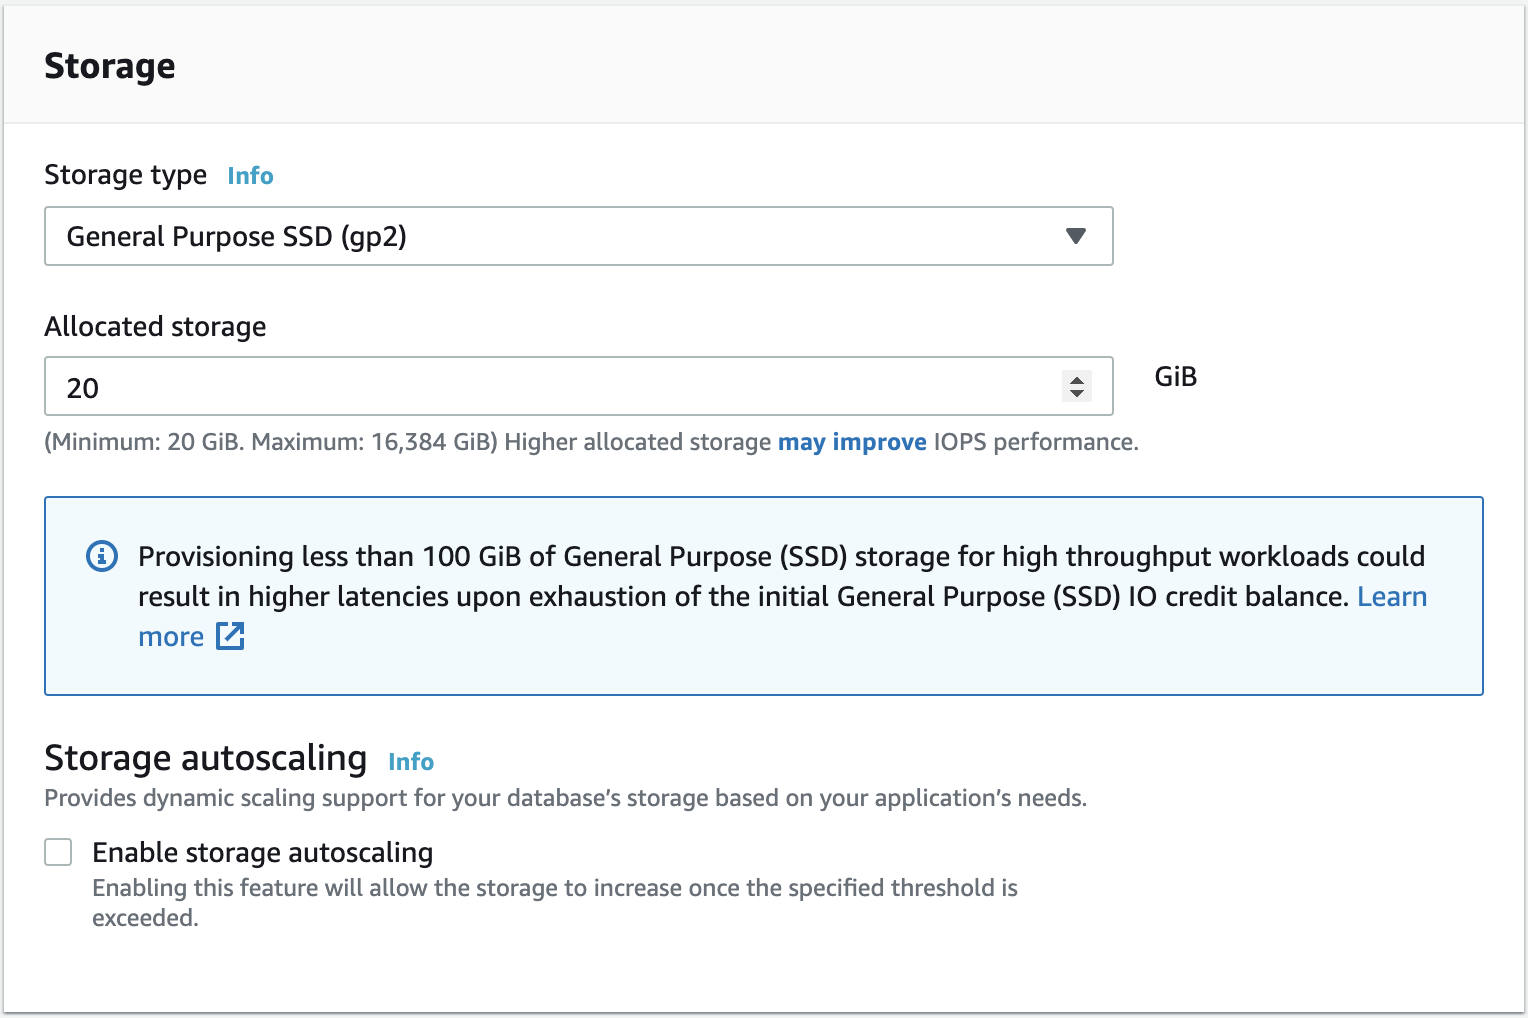
c. Scroll down to the end and click on Continue
7. On the next page, review the Summary of modifications and click on Modify DB Instance
8. During the resize process, the instance status should change from available to modifying and back to available (it may take few minutes depending on the database instance configuration). Once the downsize is complete, the RDS instance type should be updated on the details panel.
9. Repeat steps 4 – 8 to downsize (resize) any other underutilized RDS database instances provisioned within the current region.
10. Change the AWS region from the navigation bar and repeat the remediation/resolution process for other regions.
1. Run modify-db-instance command (OSX/Linux/UNIX) to resize the selected RDS database instance to the desired type/class. Use the following options:
a. --db-instance-class to specify the desired DB Instance Class.
b. --storage-type to specify the storage type to be associated with the DB instance. Valid values are standard | gp2 | io1
c. --apply-immediately parameter to apply the type change asynchronously and trigger an immediate outage. If you do not specify this parameter, changes will take place during next maintenance window.
aws rds modify-db-instance \\
	--region us-east-1 \\
	--db-instance-identifier exampledb \\
	--db-instance-class db.m5.large \\
	--storage-type gp2 \\
	--apply-immediately
2. The above command should return the specified RDS database’s new configuration metadata as shown below:
{
    "DBInstance": {
        "DBInstanceIdentifier": "exampledb",
        "DBInstanceClass": "db.m5.large",
        "Engine": "postgres",
        "DBInstanceStatus": "available",
        "MasterUsername": "postgres",
        "Endpoint": {
            "Address": "exampledb.clm9f5vkzm5i.us-east-1.rds.amazonaws.com",
            "Port": 5432,
            "HostedZoneId": "Z2R2ITUGPM61AM"
        },
        "AllocatedStorage": 20,
				...
        "StorageType": "gp2",
        "DbInstancePort": 0,
        ...
    }
}
3. Repeat steps 1 and 2 to downsize (resize) any other underused RDS instances available in the selected region.
4. Change the AWS region by updating the –region command parameter value and repeat the entire process for other regions.
Come see why we are the #1 cloud management platform and why companies like Uber, Dickey’s BBQ Pit and Norwegian Cruise Line trust nOps to manage their cloud.


© nOps 2025. All Rights Reserved.