Skip to content


Without accurate tracking and reporting, AWS costs can quickly spiral out of control. Complicated pricing and billing combined with the complexities of rapidly scaling cloud infrastructure can make visibility and optimization a challenge.
If you don’t already have an AWS reporting tool for cost management, it’s time to get one. This blog discusses the importance of AWS cost reporting tools and gives an overview of the top AWS-native and third-party tools for AWS cost management and reporting.
What Are The Benefits Of AWS Cost Reporting Tools?
Here are a few of the most important benefits of AWS cost reporting tools:
- Transparency in costs: With cost reporting tools, it becomes possible to understand your cloud spending patterns and identify areas where you can optimize usage and costs.
- Cost control: Reporting tools can help you identify unexpected spikes in usage, underutilized resources, and other areas to optimize your cloud costs.
- Better cost allocation: Cost allocation is necessary for establishing a culture of cost optimization across the organization, but setting up cost allocation tags can be extremely time-consuming. Cost reporting tools can automate the process of tagging and breaking down costs by resources, applications, business units, and other meaningful categories.
- Cost forecasting: You can more easily budget and forecast AWS costs leveraging detailed data about your cloud spend collected and analyzed by cost management tools.
Top 13 AWS Reporting Tools To Track Your Cloud Spend
Drowning in terabytes of AWS CUR billing data? Without the right reporting tool, critical cost insights stay buried. We’ve analyzed the top tools on the market to help you get control of your cloud costs:
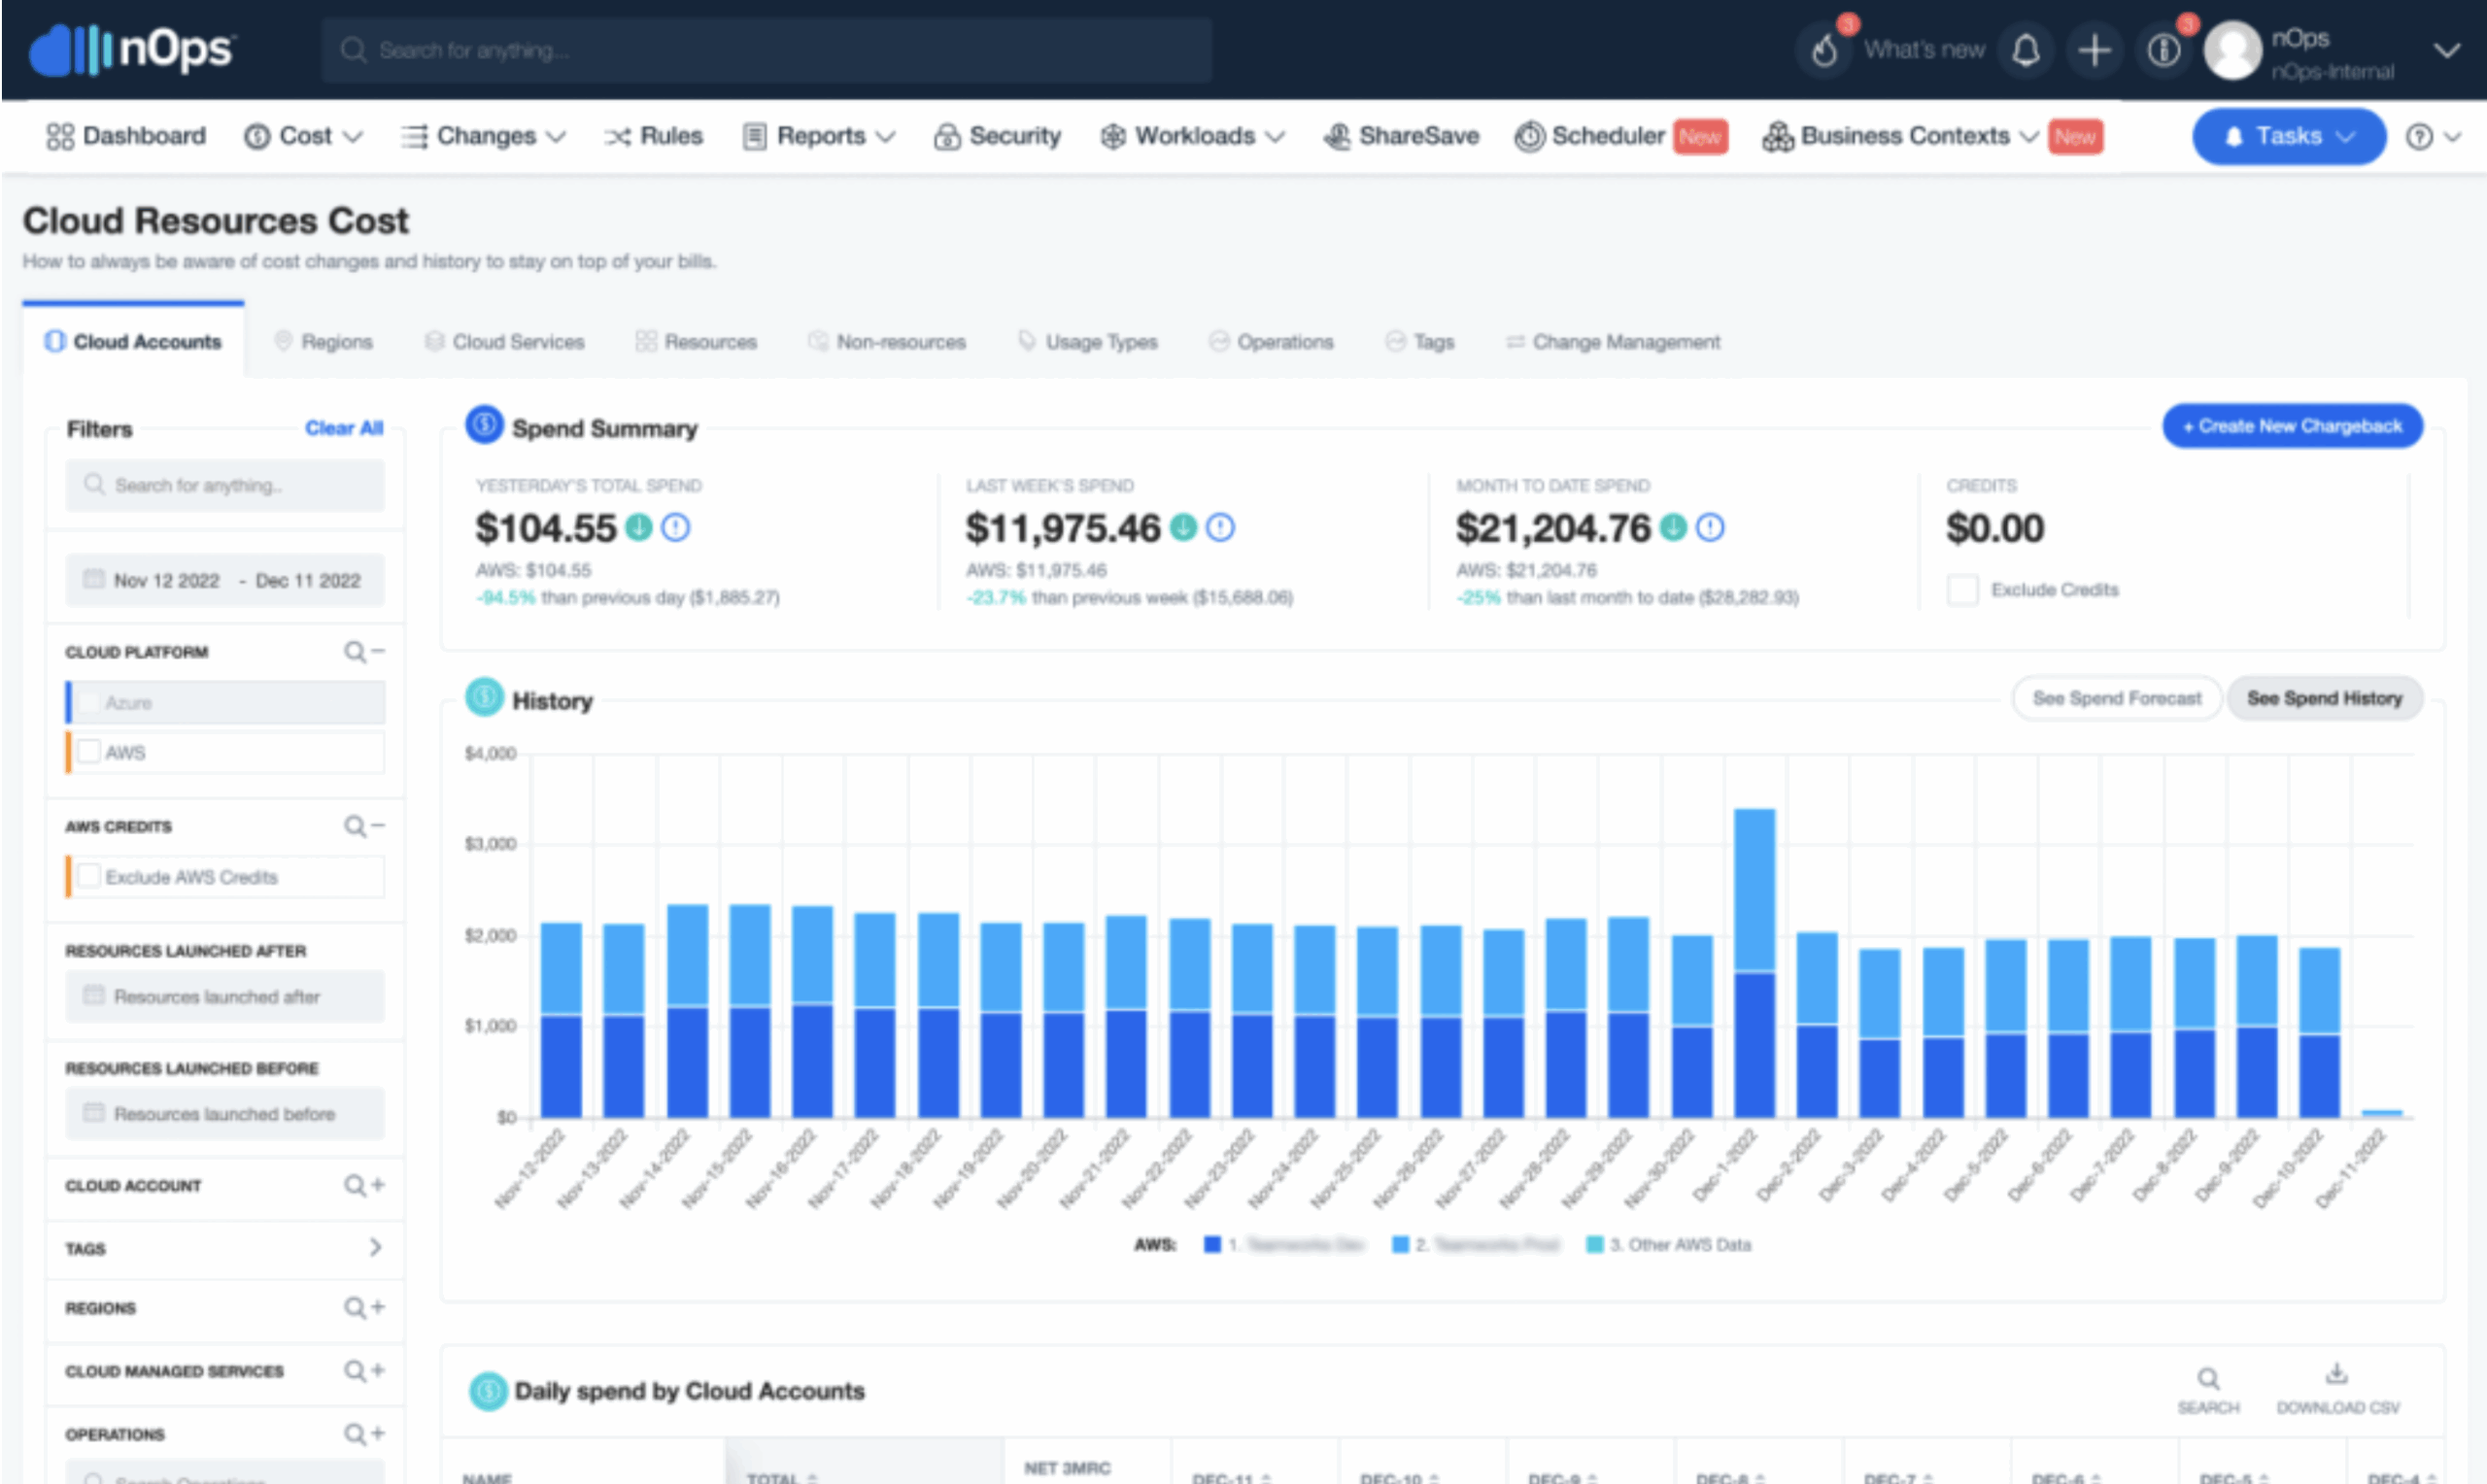
1. nOps
nOps is an end-to-end AWS cost reporting and optimization platform that helps users reduce their costs by up to 60% on autopilot.
nOps was built to make it simple and easy for engineers to report and optimize their AWS costs. It manages $2 billion in AWS spend for its customers and was recently named #1 in G2’s cloud cost management category. Features include:
- Business Contexts: understand 100% of your AWS, multicloud & SaaS costs with dashboards, reports, integrations, container cost allocation, budgets, cost tracking, cost anomaly detection, forecasting and more
- Compute Copilot: automatically optimizes your compute resources end-to-end, reducing waste at the container, node and pricing level with visibility down to the pod or container level
- Commitment Management: automatic life-cycle management of your AWS Reserved Instances and Savings Plans with the industry’s only 100% utilization guarantee
- nOps Essentials: automate time-consuming cloud optimization tasks like pausing idle resources, scheduling resources, optimizing storage, etc.
- AWS MAP Tracker: maximizes MAP funding, automatically tags resources, and tracks credits for efficient cloud migration
- Well-Architected Framework Review: automates AWS WAFR assessment & report for optimal cloud architecture
You can book a demo to find out how nOps can help you start saving today.
- Pricing: Starts at $0, charges only a portion of savings or for advanced features
- Use Case: Comprehensive & end-to-end solution
2. Amazon Cost Explorer
AWS Cost Explorer is a cost management tool that provides detailed insights about your AWS cost patterns and usage. It offers customizable reports that can, in turn, help you analyze costs for different services and even identify areas of improvement. There is also an API that allows you to access Cost Explorer data through other AWS reporting or analytics tools.
- Pricing: Free for basic use; charges apply for advanced features like hourly granularity or forecast APIs
- Use Case: Built-in AWS dashboard giving you the basic tools to analyze past spend and forecasting future costs

3. AWS Cost and Usage Report
AWS Cost and Usage Report (CUR) provides a detailed breakdown of AWS costs, including the services used, the amount of usage, and the total costs associated with them. You will also find data categorized according to the different cost allocation tags.
But it’s important to note that CURs are essentially in spreadsheet format with thousands of rows and columns. Even if there is all the data you need present in a Cost and Usage report, it can be challenging to drive insights from it as there is no way to visualize and manage all datasets.
- Pricing: Free to enable; charges apply for storing data in S3 and querying via Athena or Redshift
- Use Case: Raw, detailed billing data used for custom reporting, chargeback, and deep cost analysis

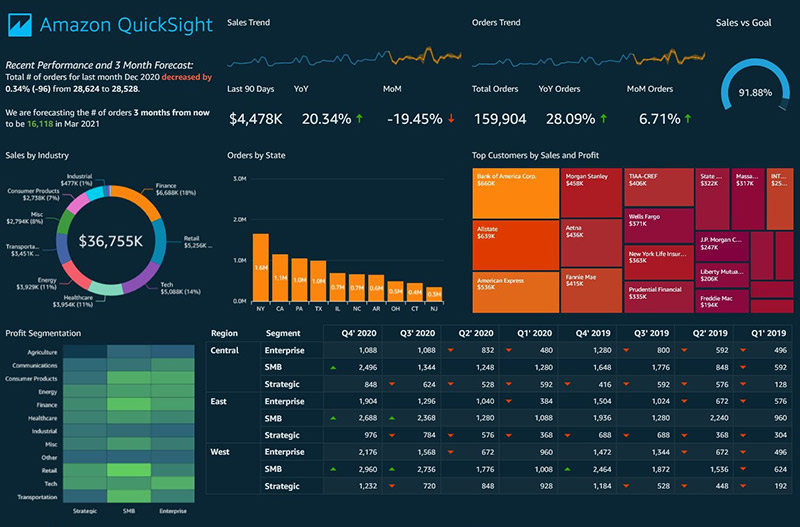
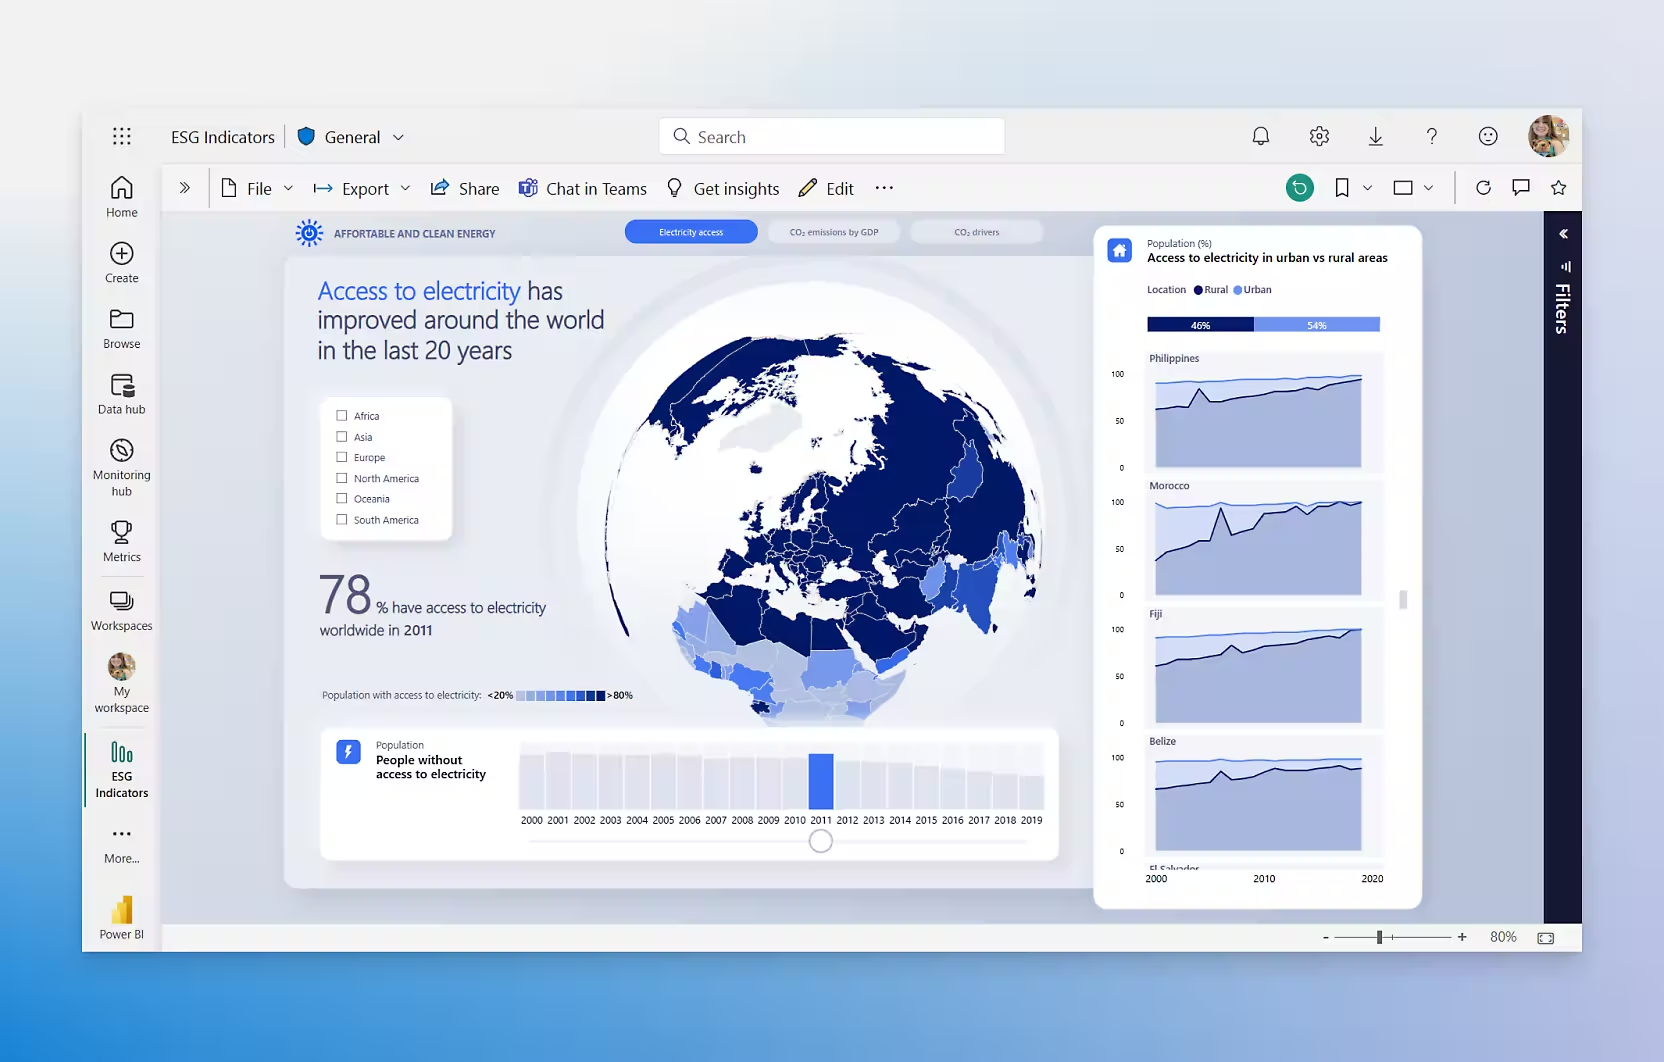
4. Amazon QuickSight
Amazon QuickSight is AWS’s fully managed business intelligence (BI) service that helps organizations visualize their AWS cost and usage data with interactive dashboards. It integrates with AWS Cost and Usage Reports (CUR) and Cost Explorer, enabling users to track spending patterns, analyze trends, and detect anomalies in cloud costs.
With built-in machine learning-powered insights, QuickSight can automatically identify cost fluctuations and provide recommendations. Organizations can also create customized reports for different teams and business units, making it easier to allocate costs and optimize cloud budgets effectively.
- Pricing: Starts at $5/user/month for Readers; $18/user/month for Authors
- Use Case: BI tool to visualize AWS CUR or other data sources for dashboards and executive reporting
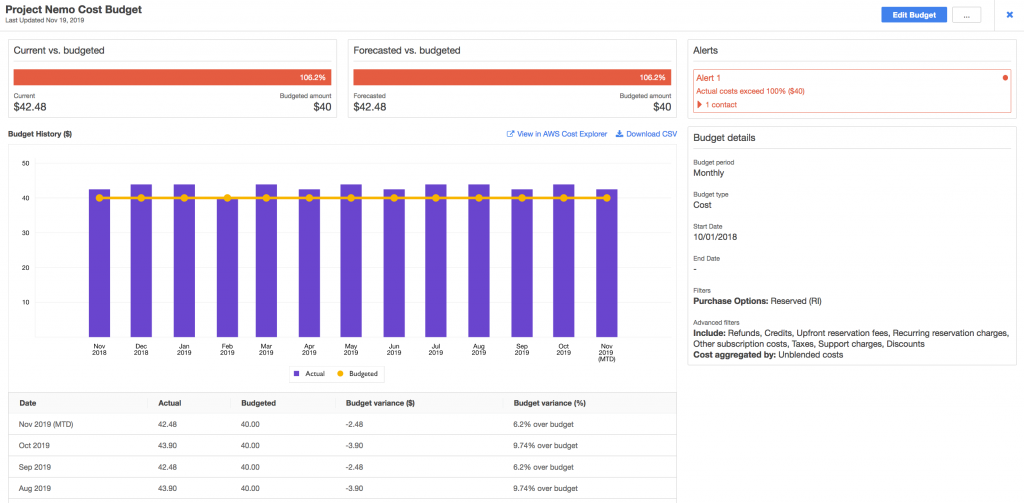
5. AWS Budgets
AWS Budgets is an AWS reporting tool that enables organizations to set custom cost and usage budgets for their AWS accounts. It provides alerts when spending exceeds predefined thresholds, helping teams stay within budget and avoid unexpected overages.
With features like budget forecasts, commitment tracking for Reserved Instances and Savings Plans, and detailed cost allocation tagging, AWS Budgets helps businesses track costs and maintain financial visibility over their cloud infrastructure.
- Pricing: Free for up to 62 budget alerts per month; $0.10 per additional alert
- Use Case: Set custom cost or usage thresholds and receive alerts when you exceed them
6. AWS CloudTrail
AWS CloudTrail is primarily an auditing and security tool, but it also plays a key role in cost reporting by providing detailed logs of API activity across AWS accounts. By tracking changes to resources, CloudTrail helps organizations understand who made cost-impacting modifications, such as provisioning new instances, adjusting auto-scaling policies, or modifying storage configurations. When integrated with other AWS data from CUR or QuickSight, CloudTrail enables organizations to correlate cost spikes with specific operational changes, improving cost accountability and governance.
- Pricing: Free for management events; charges for data events and long-term storage
- Use Case: Audit-level logging to track usage patterns, detect anomalies, and support cost investigations
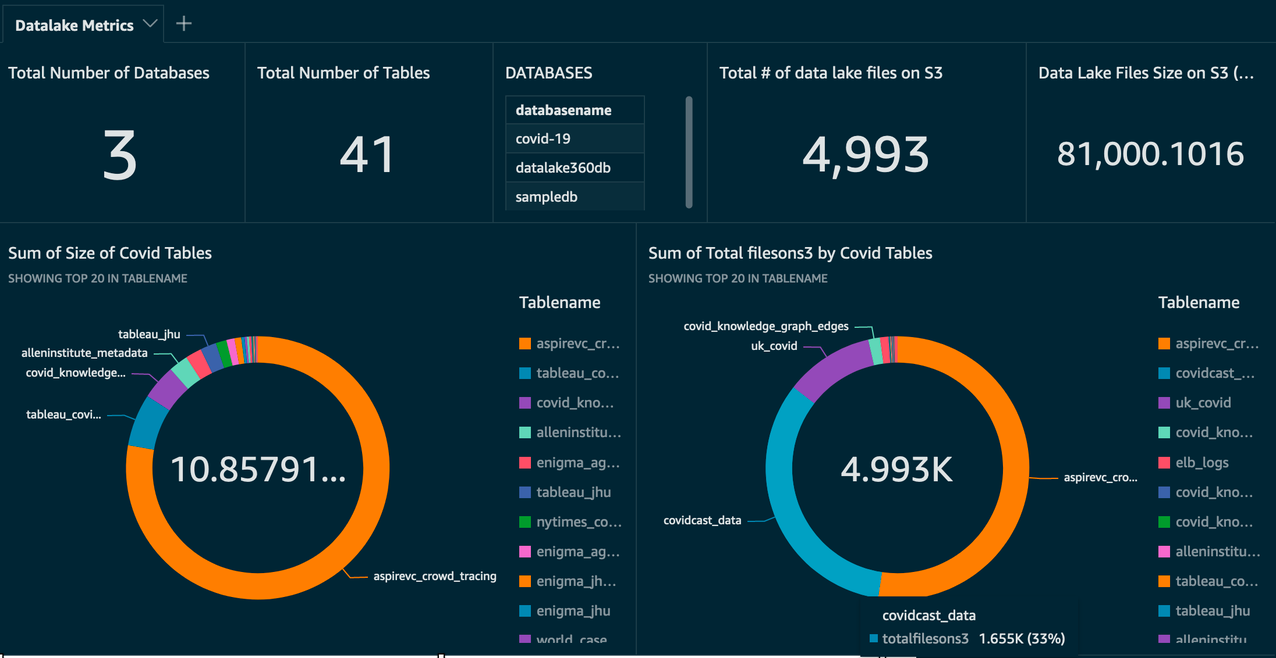
7. AWS Glue
AWS Glue is a serverless data integration service that helps process and transform large datasets, including AWS Cost and Usage Reports (CUR). While not a reporting tool itself, AWS Glue can extract, clean, and structure CUR data for use in analytics tools like Amazon QuickSight, Power BI, or Tableau. By automating data preparation, AWS Glue makes it easier to analyze complex cost data, uncover spending patterns, and generate customized financial reports. This is particularly useful for organizations dealing with multi-account or multi-region AWS environments that require advanced cost allocation and reporting.
- Pricing: Pay-as-you-go based on data processing and crawler usage
- Use Case: Prepares and transforms CUR or usage data for reporting and cost analysis in Athena or QuickSight
8. PowerBI
Power BI is a business intelligence tool from Microsoft that enables organizations to visualize and analyze AWS cost data with interactive dashboards and reports. It integrates with AWS Cost and Usage Reports (CUR) and other AWS data sources to provide deep insights into cloud spending patterns, cost trends, and resource utilization.
Cons? Well, it’s Microsoft rather than AWS-native. That means dealing with its licensing model, which can be confusing and expensive. Integration with AWS isn’t as seamless as AWS-native tools, requiring additional setup and data transformation via services like AWS Glue. And since Power BI is primarily built for Azure, some AWS users may find it less intuitive compared to Amazon QuickSight.
- Pricing: Starts at $10/user/month for Pro; higher tiers for enterprise features
- Use Case: Connects to AWS CUR or data lakes for customizable, organization-wide cloud cost dashboards
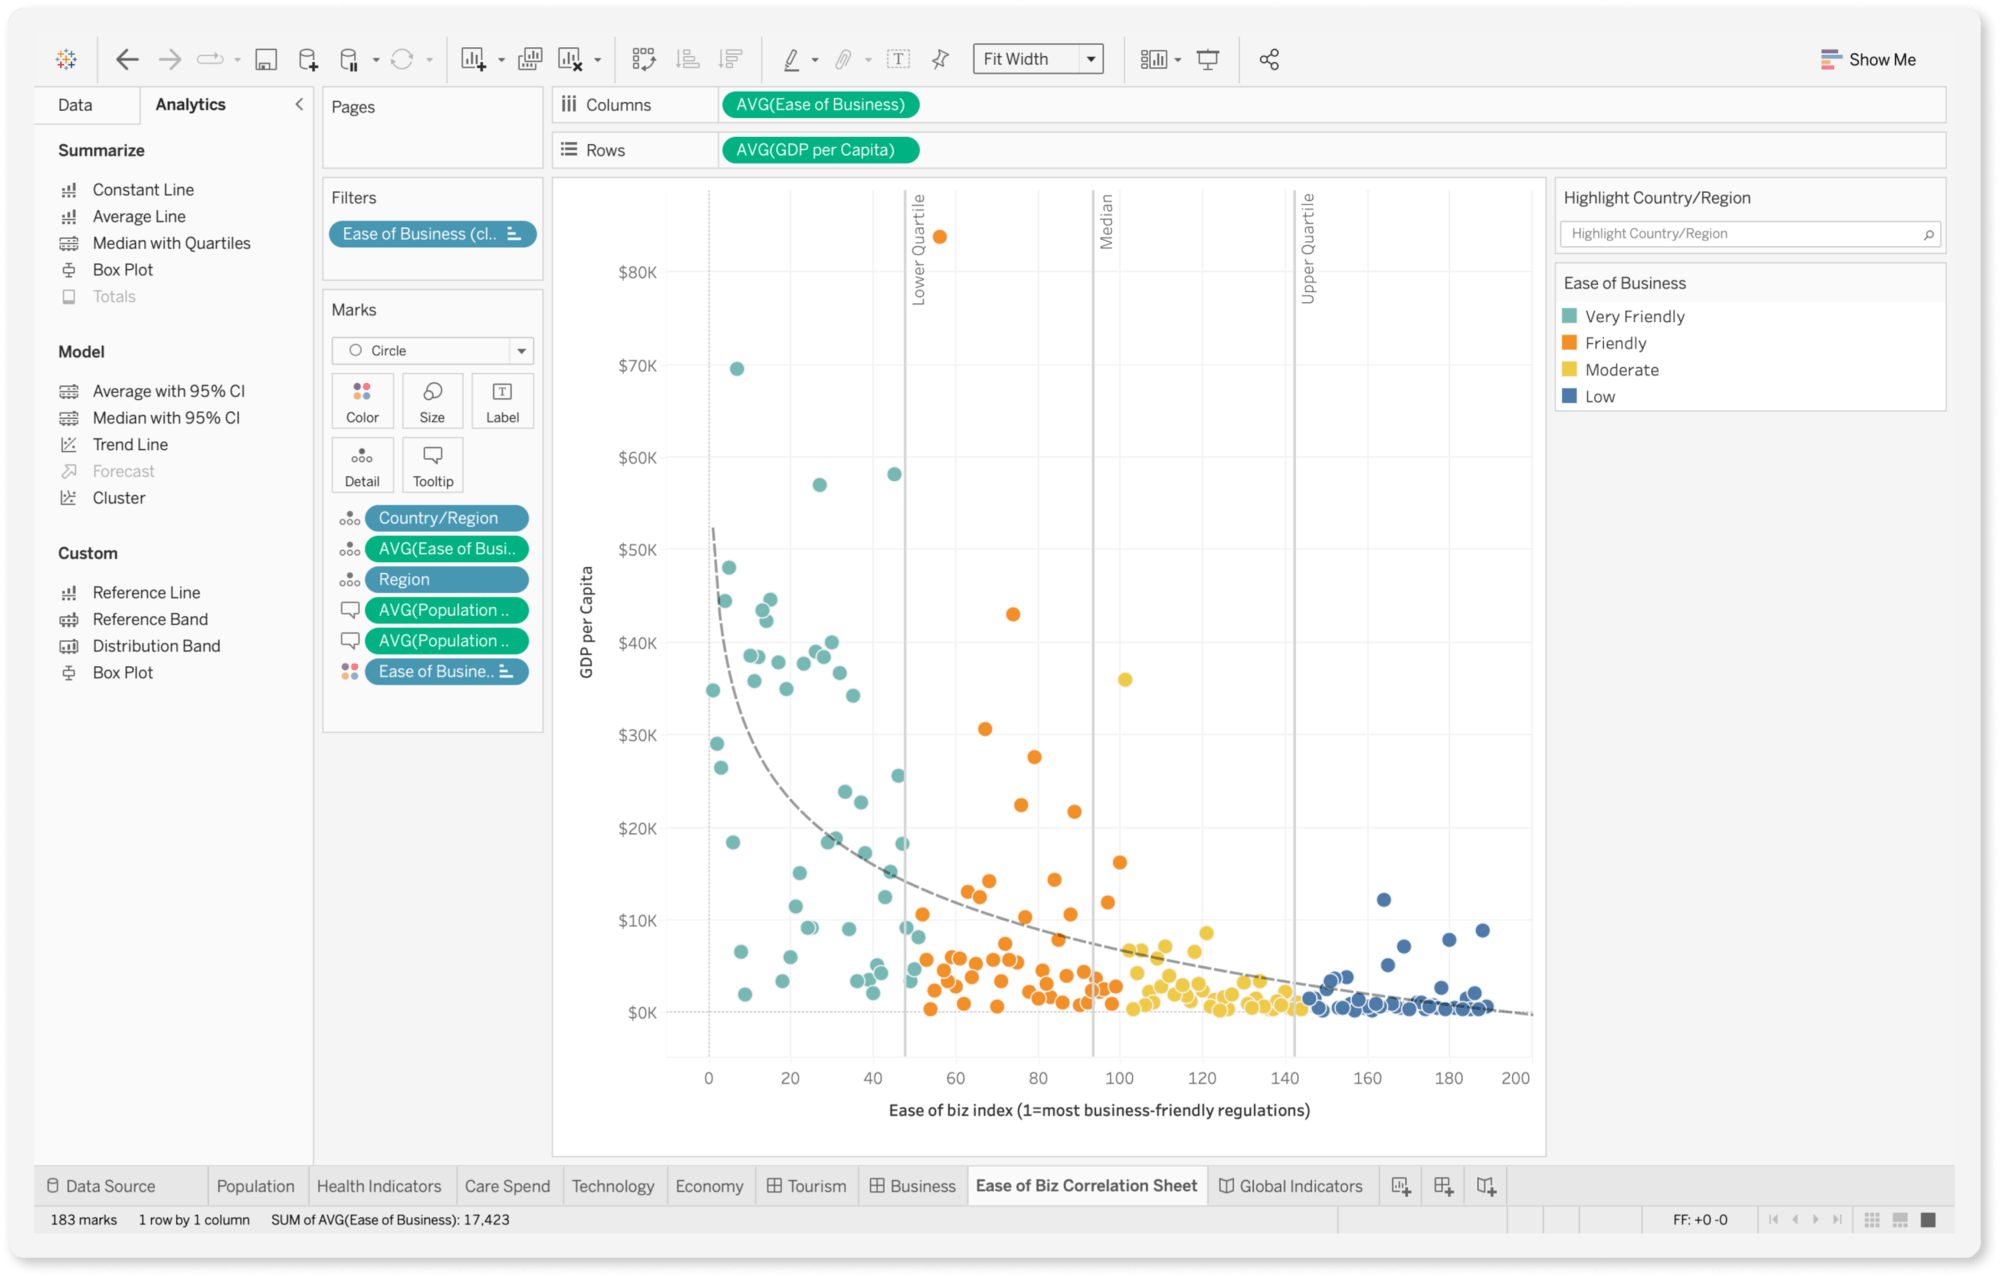
9. Tableau
Tableau is a powerful data visualization and analytics tool that enables organizations to create interactive dashboards for AWS cost reporting. It integrates with AWS Cost and Usage Reports (CUR) and other cloud data sources, allowing businesses to analyze spending trends, forecast costs, and identify optimization opportunities. With drag-and-drop functionality and advanced analytics capabilities, Tableau makes it easy to build custom financial reports tailored to different business units and stakeholders.
Compared to AWS-native tools, there may be a few drawbacks. Tableau isn’t always budget-friendly, with licensing costs adding up quickly. Additionally, while Tableau is highly flexible, getting AWS cost data into it requires extra steps, like using AWS Glue or exporting CUR data manually. And, of course, there’s the learning curve—Tableau’s powerful features come with complexity, which might not be ideal for teams looking for a quick plug-and-play cost reporting solution.
- Pricing: Starts at $15/user/month for Viewer; $75/user/month for Creator
- Use Case: Enterprise BI tool used to visualize AWS cost data with rich, interactive dashboards and drilldowns
10. CloudCheckr
CloudCheckr markets itself as a total visibility checker cloud platform that aims to provide insights into AWS cloud costs and resources. Though CloudCheckr is not strictly a cost management tool, it can monitor cloud spending on AWS and, in turn, provide recommendations to improve overall cloud budgets. Apart from that, it also offers security and compliance management solutions.
- Pricing: Custom pricing based on cloud spend and features
- Use Case: Legacy FinOps tool offering detailed AWS cost visibility, compliance, and RI/SP tracking

Source: CloudCheckr
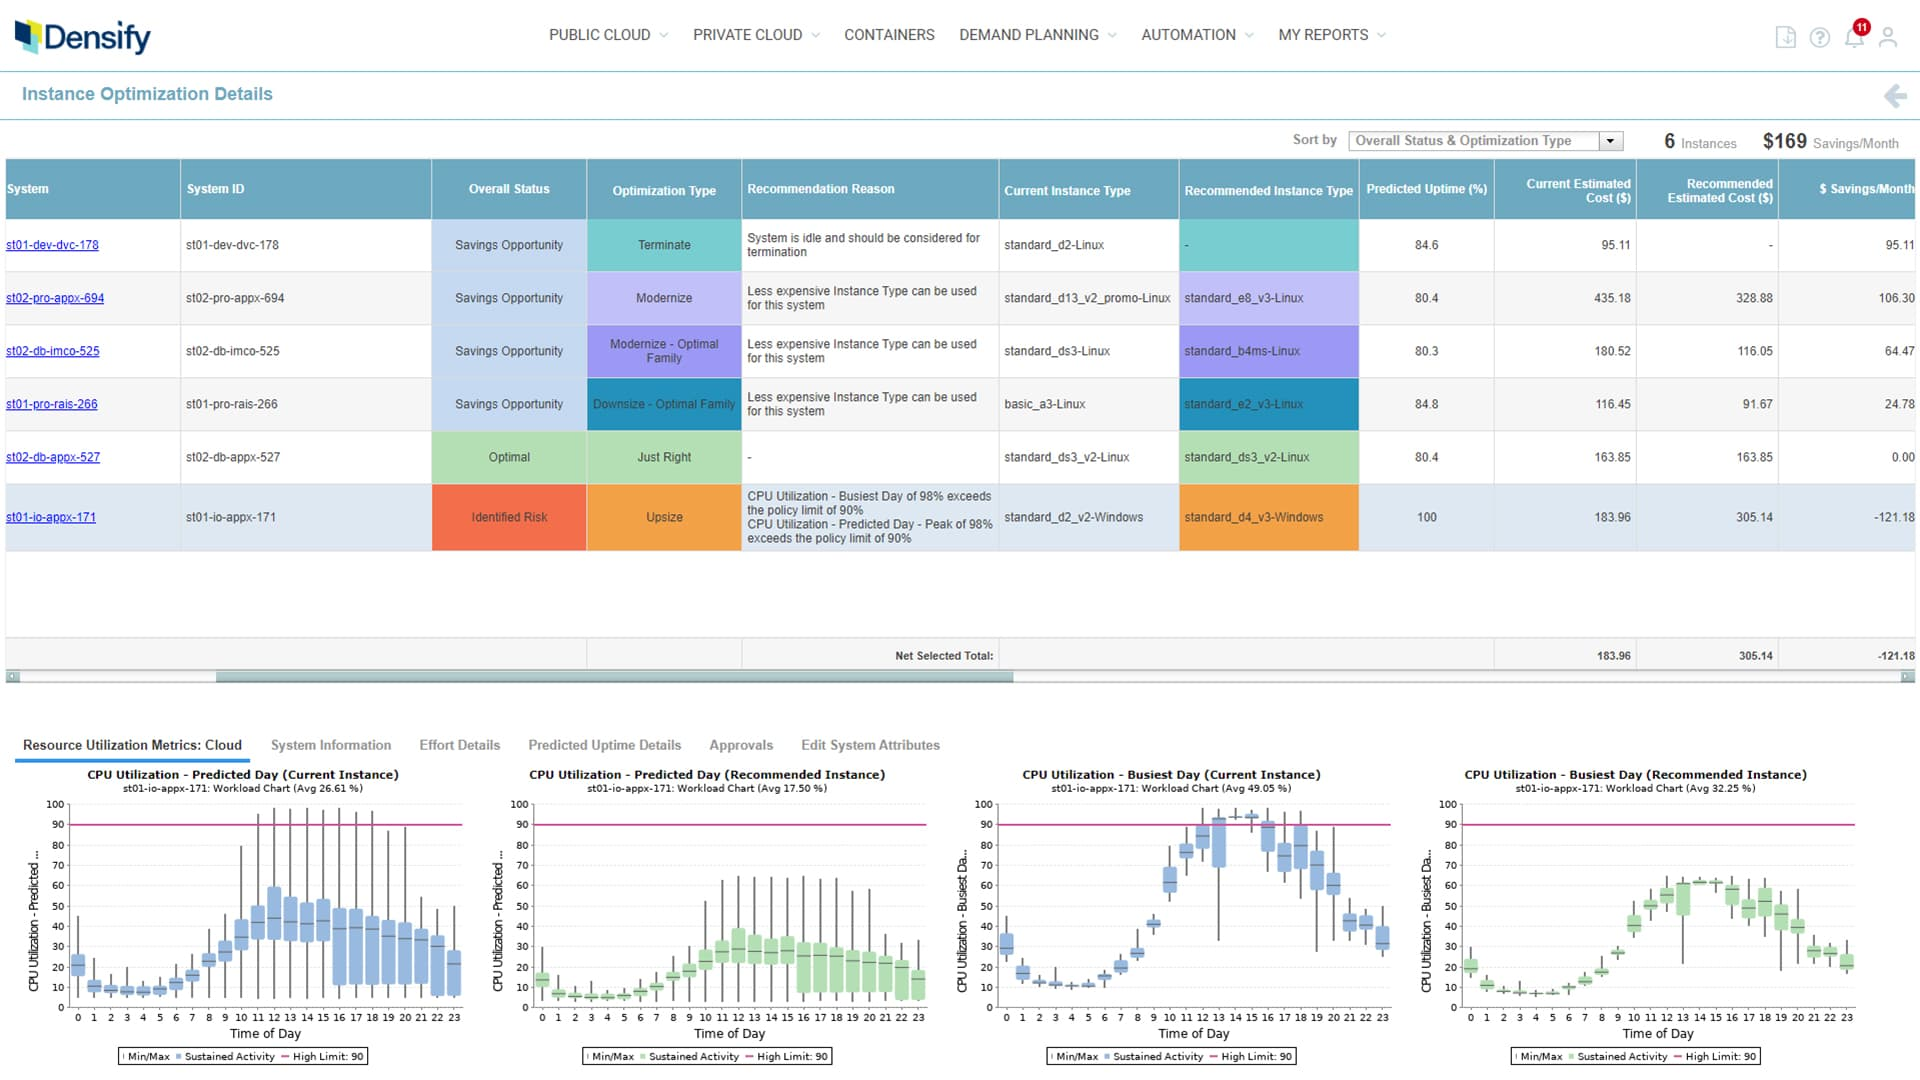
11. Densify
Densify is an AWS reporting tool that offers resource utilization monitoring and cost optimization solutions. It provides a complete view of the organization’s cloud infrastructure and in turn, provides suggestions for optimizing different cloud environments. While Densify’s features are a bit limited, especially when compared to the other tools on the list, it integrates with many other third-party tools to help report AWS data, which makes up for the missing features. But it can end up complicating things a bit.
- Pricing: Custom pricing based on usage and features
- Use Case: Focused on rightsizing recommendations and resource optimization using machine learning
12. Apptio Cloudability
Apptio Cloudability is a cloud cost management and optimization tool which claims to optimize cloud-based resources for their costs, quality, and speed. The tool can translate cloud bills and tags into in-depth insights, providing real-time clarity into overall cloud consumption. Cloudability tool by Apptio also provides solutions for resource management, compliance, and performance monitoring.
- Pricing: Enterprise-tier pricing based on cloud spend
- Use Case: Detailed cost allocation and budgeting for finance teams managing large, multi-cloud environments

13. VMware Cloud Health
VMware Cloud Health provides cloud solutions for automation, performance, security, and cost management. The tool primarily focuses on optimizing multi-cloud environments while providing a centralized management dashboard for different resources, services, costs and applications. Since the tool is not entirely focused on AWS, it has limited advanced reporting capabilities when it comes to AWS reporting.
- Pricing: Pricing tied to percentage of cloud spend
- Use Case: Policy-driven governance and reporting across AWS and multi-cloud with strong compliance controls

How Can nOps Help You With AWS Cost Reporting?
nOps was recently ranked #1 with five stars in G2’s cloud cost management category, and we optimize $2+ billion in cloud spend for our customers. A few benefits include:
- Single pane of glass for cloud spend across IaaS & PaaS — integrations with AWS, Azure, GCP, Kubernetes Datadog, Databricks, etc.
- Dashboards, reports, budgets, and all of the tools you need to track and monitor your spend
- Automatically allocate 100% of AWS and other shared costs (including Kubernetes) without complete tagging to product, feature, team, app, etc.
- Calculate key FinOps metrics like Cost of Goods Sold, Total Cost of Ownership, etc.
- Detect Cost Anomalies & Forecast Costs with AI analysis of your spending trends
- Provide engineers with real-time cost visibility into the resources they manage