NEW Enhanced Showback Offers Unparalleled Visibility into your Cloud Spend
The AWS Cost and Usage Report (CUR) records every billable resource in your cloud environment. This includes every single EC2, S3, Reserved Instance, Savings Plan, data transfer fee, and more.
If you’ve ever had to export a multi-gigabyte spreadsheet file to understand your AWS usage and costs, you know how hard it can be to understand your cloud costs. That’s why we built Business Contexts and its suite of features that make it easy to understand and analyze the CUR, transforming millions of rows of contextless data into the who, what, when and why of cloud spend.
Enhanced Showback makes it easy to see where the money is.
Allocate 100% of your AWS costs to different workloads, environments, resource type, or other relevant categories. Easy-to-use and carefully curated filters help you to see clear outliers in your cloud spending and how cost-optimized you are.
In this blog, we’ll take you through five example use cases of Enhanced Showback and how they help anyone from FinOps to Engineering make better data-driven decisions about their cloud spend.
5 New Enhanced Showback Features
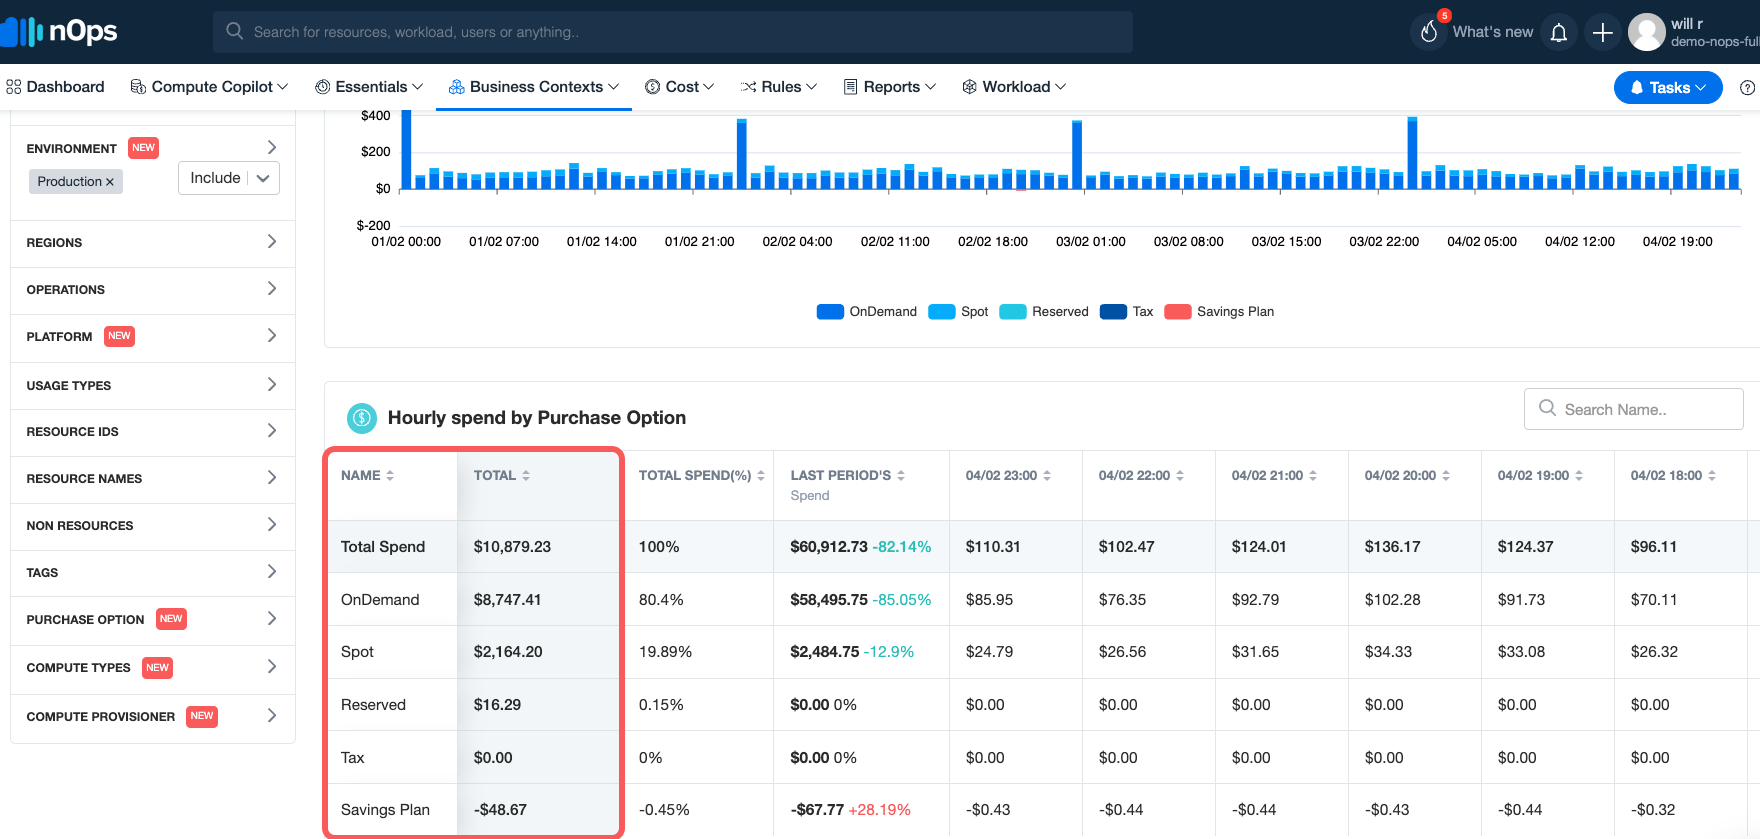
1. View hourly spend by purchase option for any of your environments
Choose the appropriate Environment field (Production, Development, QA, Infrastructure, Staging …) to get started.
Pro tip: The nOps dashboard allows you to view at a glance how much you’re currently spending on Savings Plans (SP), Reserved Instances (RI), Spot and On-Demand for any given environment. Hone in on your On-Demand percentage to gauge how well your cost optimization efforts are going.
Sign up, navigate to the nOps Dashboard and click on “Cost Allocation” → “Environment” → “Purchase Option”.
In the example below we see Production in January 2024 is ~80% On-Demand and ~20% Spot. You’re not getting any discounts on that On-Demand spending — that means there is a huge opportunity to reduce your costs.
2. Discover the amount of your AWS Commitments going to waste each hour
Often, teams trying to optimize for cost don’t have visibility into existing organization-wide commitments such as Savings Plans. It is very complicated to instantaneously calculate how much commitment is being consumed at any given time and the ideal amount of Spot to use.
nOps pulls and processes data buried in your existing CUR columns (line_item_line_item_type, pricing_term…) to make it trivially easy for you to see the percentage of cost by Spot, OnDemand, Discounts(Reserved and Savings Plans), Tax, Reserved Volume Discount each hour.
Pro tip: Navigate to the nOps Dashboard → “Cost Allocation” → “Purchase Option” and select the desired fields to view. Let’s look at a use case to illustrate why this is so helpful.
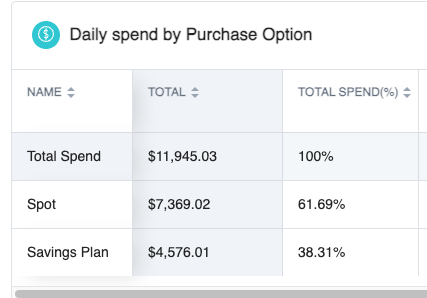
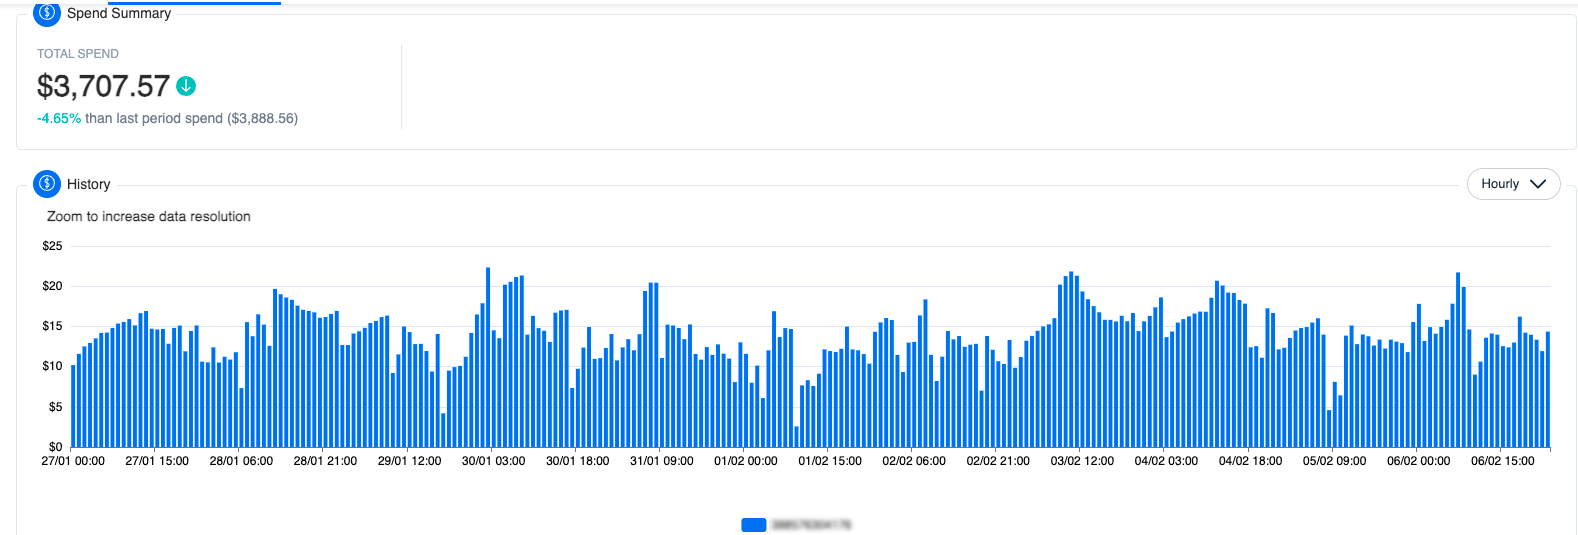
In this case, the user is receiving discounts on all of their compute — but you can see in the spend summary that they are actually spending more money. The user is moving too much workload onto Spot and underutilizing Savings Plans. That’s why they have nothing On-Demand — because Savings Plans don’t have enough left to apply to.
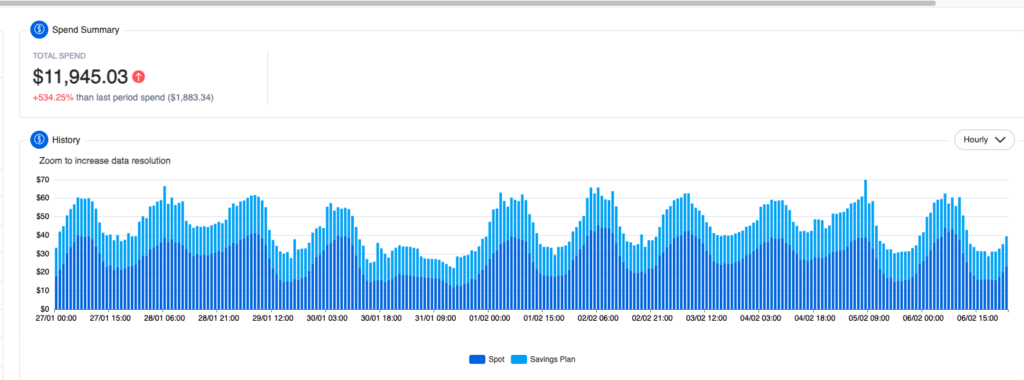
With nOps amortized view, you can separate out the amount of your Savings Plans going underutilized each hour — and take action to fix the problem.
3. Break down spend by the tools that are provisioning compute in your environment
nOps aggregates all of your cloud data into one single source of truth. The Compute Provisioner feature uses tag data to pull together all of the CUR costs associated with any of your third-party cloud services, such as Databricks, cast.io, Citrix, Data_Scientists_Tools, or Cloudformation_Static.
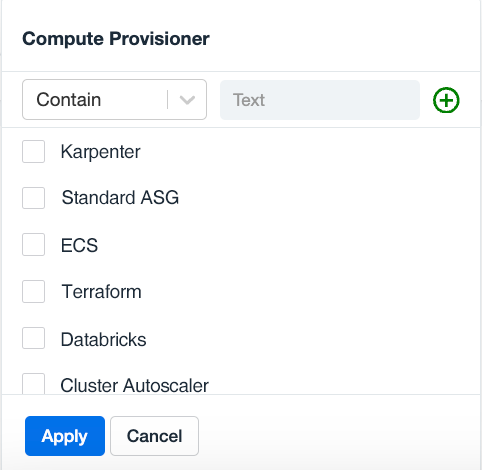
Pro tip: The ability to instantly break down your hourly cloud spend by provisioner allows you to pinpoint the products and activities driving your cloud spend. Navigate to the nOps Dashboard → “Cost Allocation” → “Compute Provisioner”. Then, select the tools that you’re interested in.
4. See the platforms your compute resources are running on
nOps makes it easy to dissect costs with an extensive and carefully selected array of the most important filters and dimensions.
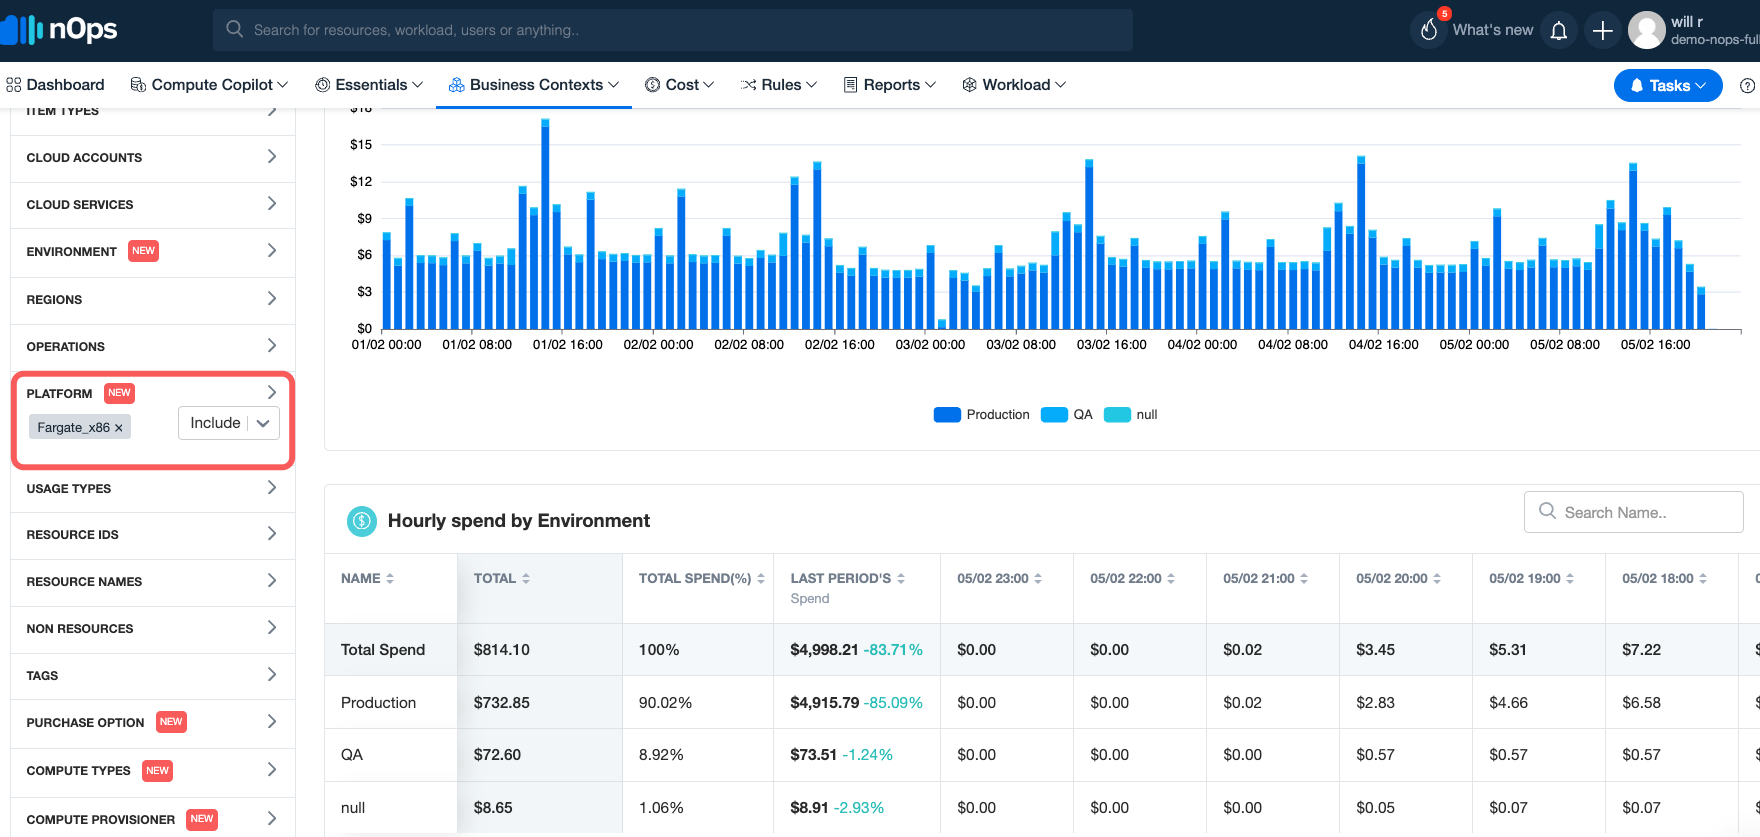
Pro tip: This feature can be used with platforms such as Linux, Windows, MySQL, Aurora PostgreSQL, Fargate_ARM, Fargate_Windows, Lambda_x86. Note that this property distinguishes between Lambda, RDS, and EC2, even if they are all technically running Linux.
Navigate to the nOps Dashboard → “Cost Allocation” → “Platform” → resource (e.g. Fargate_x86). At the top, select “Environment” to see how much Fargate_x86 is being run in Dev versus Production.
5. Break down cost by compute type
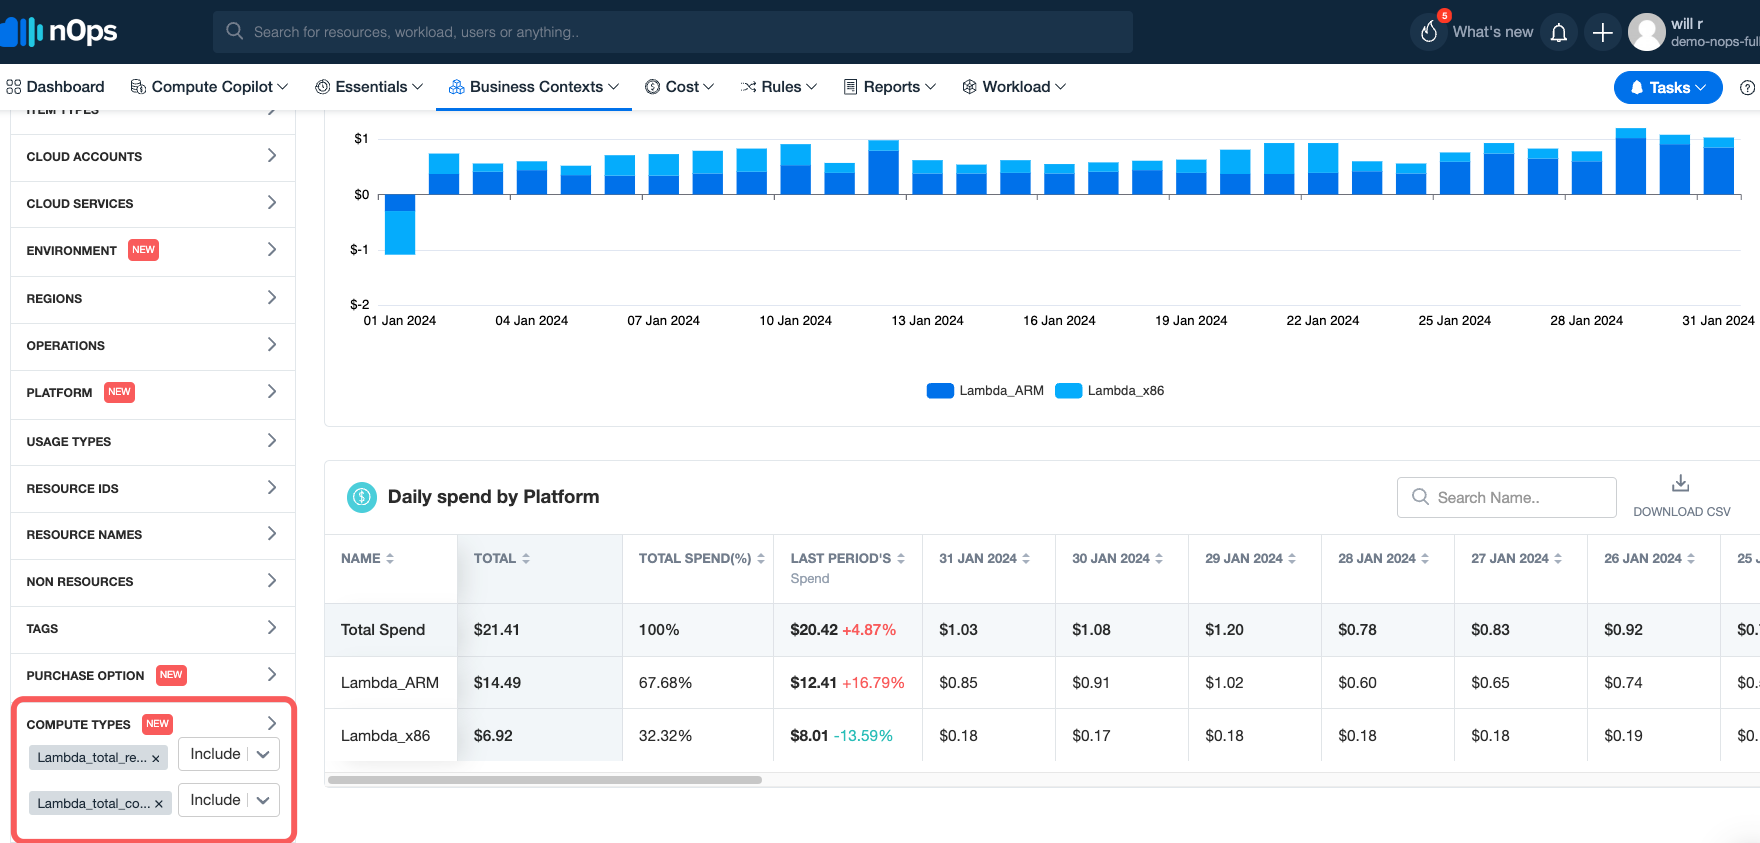
This field is informed by line_item_usage_type and product_servicecode with additional business logic applied. Some examples include Lambda_total_compute, Lambda_total_request, Fargate_serverless_GB, etc.
Navigate to the nOps dashboard → “Cost Allocation” → “Compute Type”. Then, select the compute type you’re interested in, such as “Lambda_total_compute” and “Lambda_total_request”. At the top, select “Platform” to see how much is being spent on Lambda compute versus Lambda request.
About nOps
nOps is an AI-powered FinOps automation platform that helps AWS users optimize their cloud infrastructure for minimal engineering effort. The platform offers an all-in-one suite of cloud optimization solutions, including nOps Business Contexts for understanding 100% of your AWS bill with cost allocation, chargebacks, showbacks, and tagging.
nOps was recently ranked #1 in G2’s cloud cost management category, and we optimize $1.5 billion in cloud spend for our customers.
Join our customers using nOps to understand your cloud costs and leverage automation with complete confidence by booking a demo today!