How Can You Measure Your SaaS Cost of Goods Sold (COGS)?
Businesses are not just about sales revenue or marketing expenses; they are about understanding the Cost per Customer as it pertains to “Cost of Goods Sold.” Or perhaps, in the SaaS world, “Cost of Services Sold” would be more accurate. The cost of doing business is multi-faceted; it takes into account all the expenses incurred during the entire process of providing service to your customers, from marketing and sales efforts to operational costs. Especially in the SaaS industry, knowing the true cost of acquiring and retaining customers is highly crucial.
However, Cost-per-customer metrics can be very challenging to obtain, as many businesses struggle to obtain accurate and granular data on their own. In this blog post, we will explore Cost of Goods Sold (COGS)/Cost of Service (COS) per Customer, its significance, and how it can be calculated. Here you go!
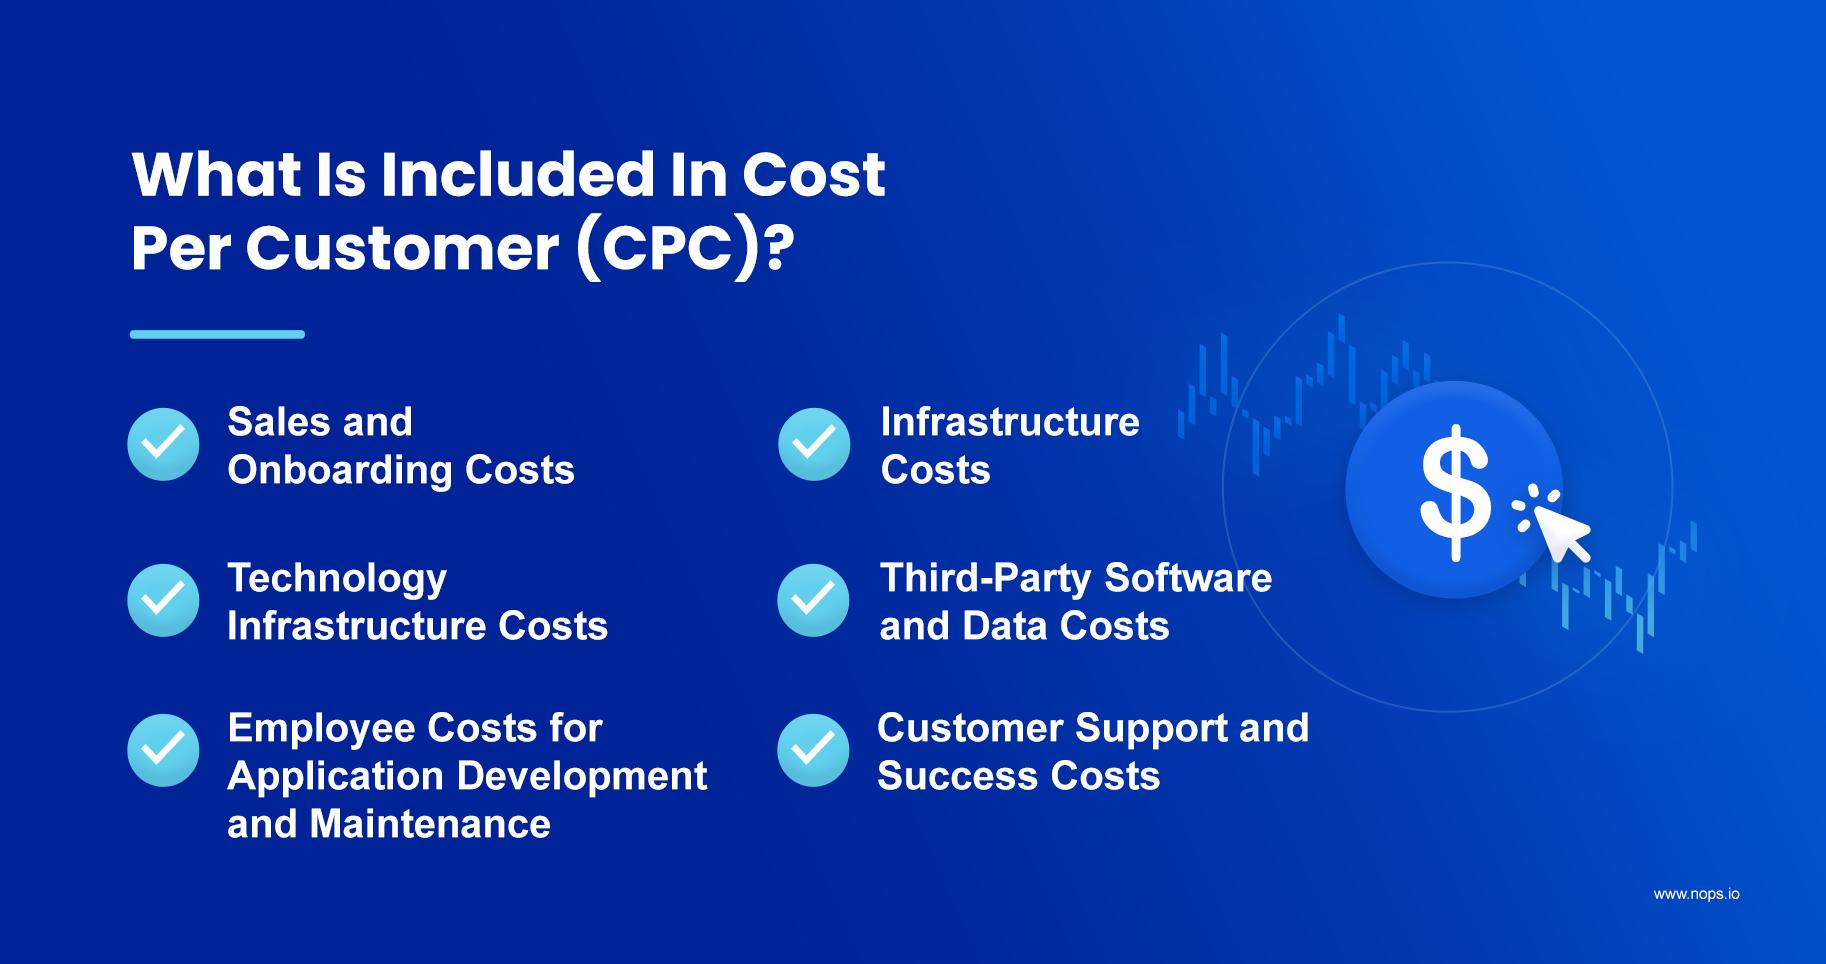
What Is Included In COGS Per Customer?
While there are many elements of the overall costs to do business, when it comes to COGS, it’s critical to separate the elements that generate revenue from those that don’t.
When trying to determine the Cost of Goods Sold (COGS)/Cost of Service (COS), the following items are generally taken into consideration. We’ve added classifications to help you differentiate true COGS (cost of revenue-generating elements) from operating expenses (OpEx). In other words, the bucket of things that bring in money versus the bucket of things that are just part of operating your business. Where applicable, we’ve also included key metrics often used for SaaS solutions.
- Sales, Marketing, and Onboarding Costs: Employee costs related to the sales process, including salaries, commissions, and expenses incurred during customer onboarding.
Example: Sales and marketing staff salaries, commissions, and expenses for conducting product demonstrations, marketing outreach, market research, or customer onboarding activities.
Company Category: OpEx
SaaS Category: Customer Acquisition Cost (CAC)
- Infrastructure Costs: This includes expenses associated with the infrastructure necessary to deliver services to customers, such as cloud hosting fees, software licenses for operating systems, backup expenses, and data transfer costs.
Example: Monthly fees paid to a cloud provider for hosting the SaaS application and supporting infrastructure. This may include things like an EC2 instance for a web front-end or a serverless infrastructure application built to process data and serve reports to customers.
Business Category: COGS
SaaS Category: Cost Per Customer
- Internal Infrastructure Costs: This includes software and technology used for purposes, including tools and systems used by the company’s internal teams for development, testing, and operations.
Example: Subscription fees for project management software the development team uses to manage and track progress. Common items may include JIRA for task management, PagerDuty for alerts, and Datadog for monitoring utilization.
Business Category: OpEx
SaaS Category: Internal Systems
- Employee Costs for Application Development and Maintenance: Salaries, benefits, and other employee-related expenses for the team responsible for creating, maintaining, and updating the SaaS application.
Example: Salaries of software engineers, UX designers, and QA testers involved in building and enhancing the SaaS product.
Business Category: OpEx if used for internal reasons, COGS if servicing customers
- Third-Party Software and Data Processing Costs: Expenses incurred for utilizing third-party software, data providers, or licensing agreements integral to the SaaS offering. This could also be charges relating to a Help Center, chatbot functionality, or an LMS system.
Example: Subscription fees for using a payment gateway service or licensing fees for incorporating a data analytics tool into the SaaS platform.
Business Category: OpEx if used for internal reasons, COGS if servicing customers
- Customer Support and Success Costs: Employee costs associated with providing customer support, training, and ensuring customer success and satisfaction.
Example: Salaries and training costs for customer/tech support or customer success managers dedicated to assisting SaaS customers.
Business Category: OpEx
Why Does COGS matter in regard to Cost Per Customer?
Cost per customer data aren’t just about saving money, they’re about making strategic decisions that maximize our margins and strengthen our business. And they go hand in hand with COGS in empowering your company to make the right choices. Accurate cost-per-customer data are crucial for SaaS businesses, as they enable informed decision-making, minimize surprises in expenses, and maximize profitability.
Cost per customer data isn’t just about saving money, It is about making strategic decisions that maximize our margins and strengthen our business. And it goes hand in hand with COGS in empowering your company to make the right choices. Accurate cost-per-customer data are crucial for SaaS businesses, as they enable informed decision-making, minimize surprises in expenses, and maximize profitability.
Determining the COGS, contrasted against customer revenue, allows you to see what your revenue is and calculate the actual revenue margins for each customer. Coupled with the Customer Acquisition Cost (CAC), these metrics can help you hone your business strategy.
For example, if Segment A and Segment B have similar costs, but Segment B offers higher margins, allocating more resources to target Segment B becomes a viable option. Conversely, analyzing a higher CAC for segment A could prompt organizations to explore process improvements and technological investments to reduce costs. The integration of these metrics enables informed decision-making and optimization of business operations. COGS is the underpinning metric as to whether your business will make money or lose money in the long run. If the COGS is too high, it can impact your ability to price in line with the market.
Companies can strategically allocate resources, optimize sales processes, and target high-margin customer segments by understanding the actual costs associated with each customer and their usage patterns, specifically COGS. This data-driven approach empowers businesses to strengthen their operations, make intelligent investments, and drive long-term success in the competitive market. It’s not just about the bottom line; it’s about making smart, informed choices that set us up for long-term success.
What Challenges Do SaaS Companies Face When Measuring COGS?
Across the many components of calculating a customer cost, AWS services offer the most complexity and challenge.
There are many challenges that organizations usually face when trying to calculate their AWS spend into relative dollar amounts to attribute to each of their customers for COGS. We’ll call it COGS per customer.
Two of the biggest challenges SaaS companies face are accurately attributing shared technology service costs (e.g. a workload all customers use) to individual customers, and allocating costs to individual customers from aggregated service charges charged at the account or organization level (e.g. support charges or taxes)
As multiple customers share the same resources, allocating their fair share of the expenses becomes more difficult. Resource naming won’t resolve the issue, as more than one customer uses the same resource. Furthermore, tagging a group of resources with customer names is not an appropriate approach either when it comes to cost allocation reporting, as you still have to split out individual customer costs. The problem doubles up when there are mistagged and incorrectly tagged resources.
Related Content
AWS Cloud Cost Allocation: The Complete Guide
How to tag and allocate every dollar of your AWS spend
Download Now
The second most common challenge to COGS calculation is the existence of aggregated costs, sometimes referred to as indirect costs. These aggregate charges, such as taxes and support, are used by the whole organization and, thus, should be charged from respective customers based on their proportion of usage. But proportionate tagging is complicated, making COGS per customer measurement a lot more challenging!
This highlights the need for a more comprehensive approach to allocate costs and accurately ensure fair customer distribution among customers. You also have nuanced situations for individual services for which their costs need to be distributed in a different manner than the others. For example, Support might need to be distributed evenly. However, Databricks, after reviewing the service charges, predominantly services internal needs. There may be a need to split its costs so that 60% goes into an Internal Infrastructure bucket, where the 40% is distributed across the customer base.
Paving the Road
Getting accurate resource groups for customer costs is highly dependent on the strategies used when deploying infrastructure in the cloud.
Some examples of things that can help pave the way:
- Organizational structure within AWS
- AWS Account naming conventions
- Resource tagging, which can be done with Infrastructure as Code or manually
- Resource naming conventions
- Determining in advance if certain services need to be split
Consideration Corner: Which, if any of these, are you implementing today?
How Can nOps Help You Measure COGS Per Customer Effectively?
With nOps Business Contexts, coupled with our Cost Analysis, we streamline the ability to allocate customer costs and thus, measure COGS per customer effectively.
Let’s take a real-life example from one of our customers. We’ll call them GloboCorp for now.
GloboCorp is a software application service company within the healthcare industry. Their applications help hospitals and care providers manage capacity, book appointments, run reminder outreach, and run real-time analytics on a multitude of operational processes.
The account structure was that one or more accounts were created for a customer, whose resources were exclusive to that company. Within the GloboCorp accounts, there were shared services used across all their customer base, such as their data parsing and log archiving.
These shared services costs, along with indirect charges like Tax and AWS Support were collected into a Shared Services group. This group spend was then distributed evenly across each customer as that was how GloboCorp needed to bill.
Prior to nOps, this was a manual and laborious process. Billing files were downloaded as CSV format and everything was a series of formulae across several columns and using lookups to calculate the customer bill without distribution amount, the distribution amounts, then the total amounts per customer.
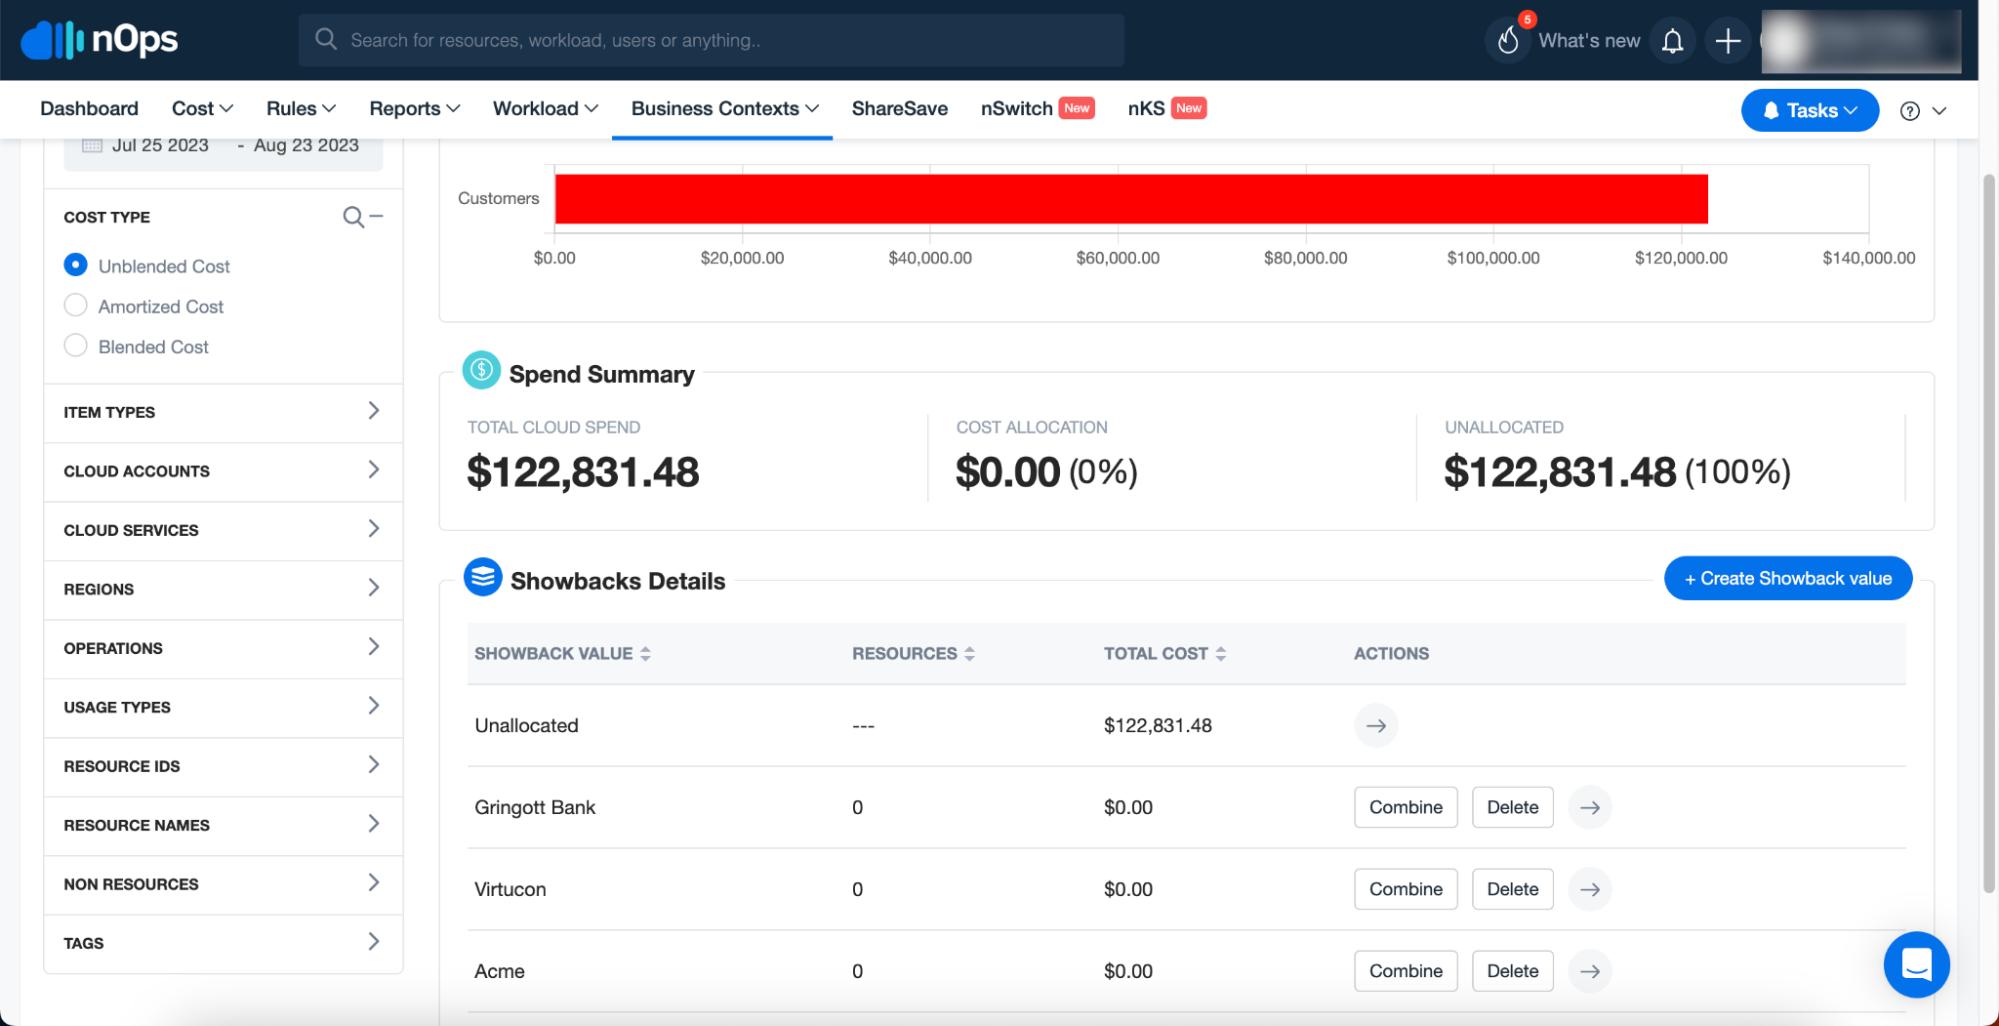
With nOps, they were able to set up the rule structure, and now they have a dynamically updated solution to review at any time they like.
Here’s what was done to achieve it:
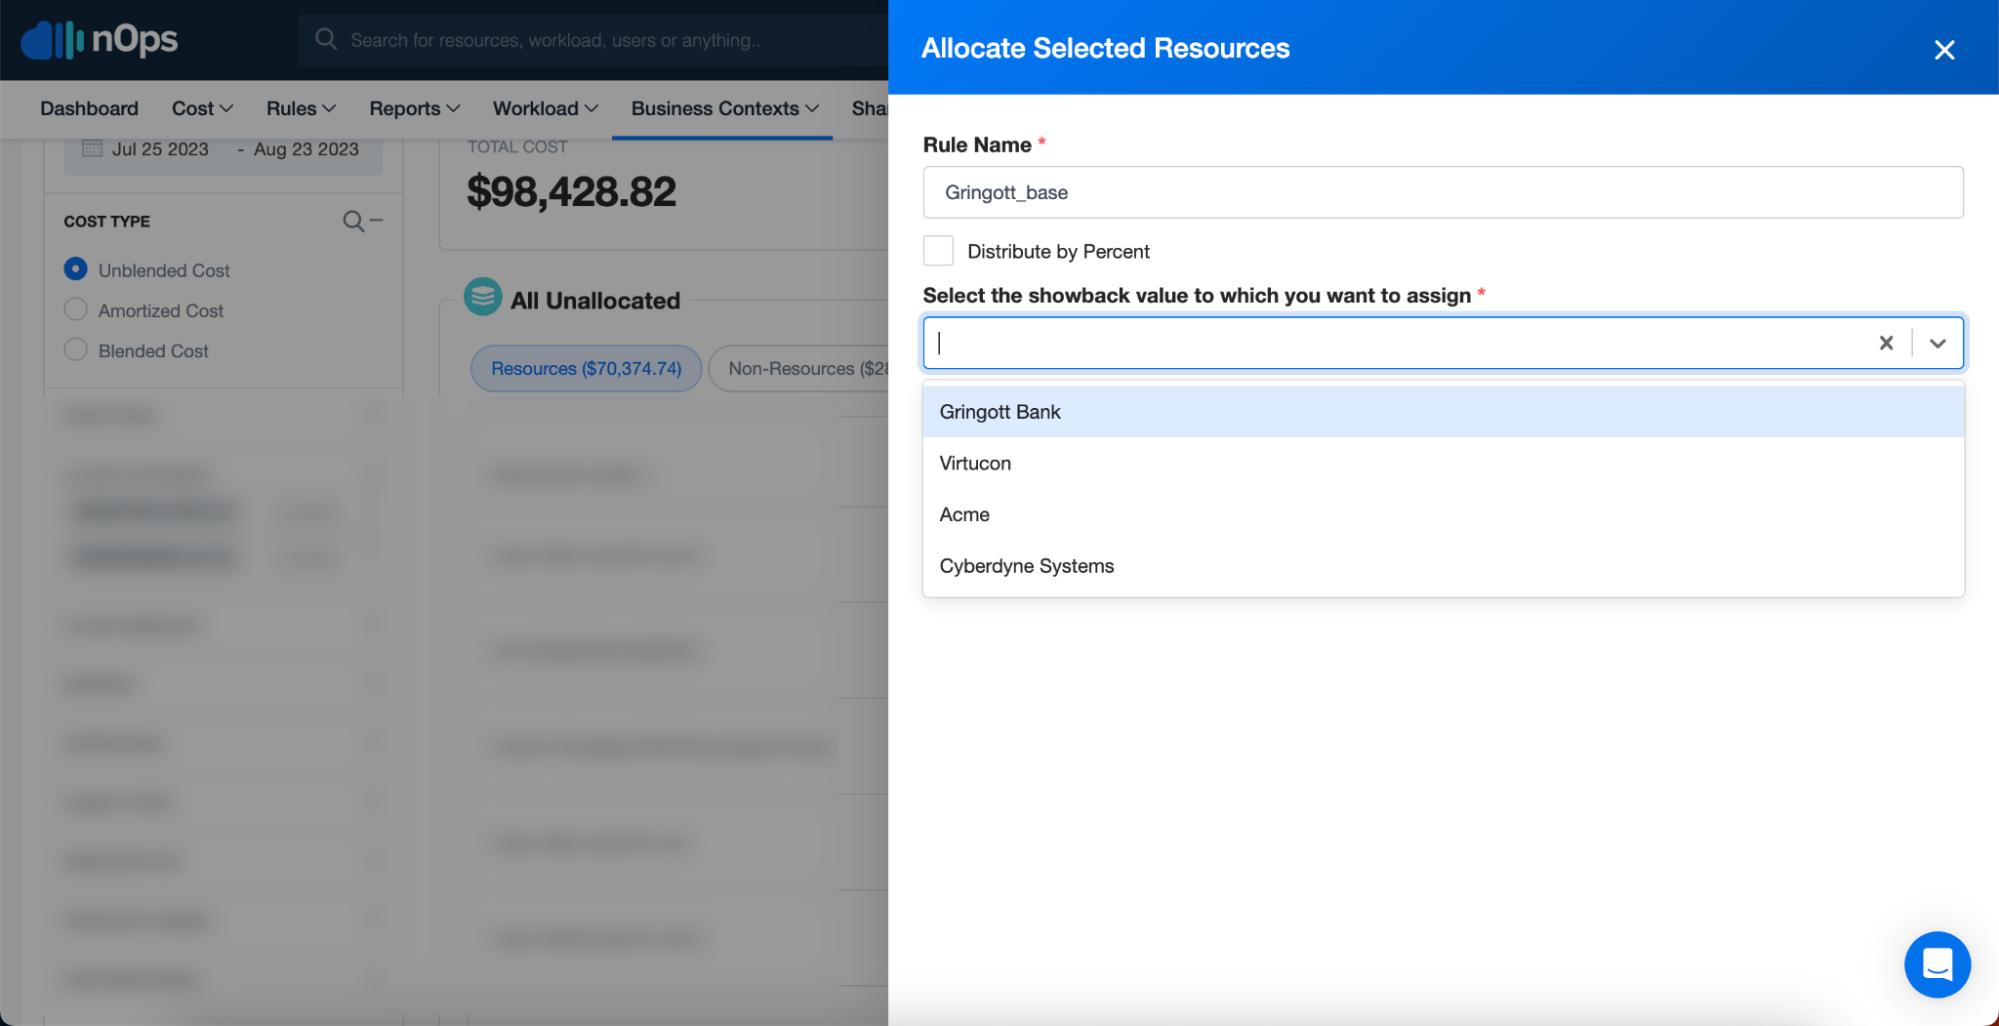
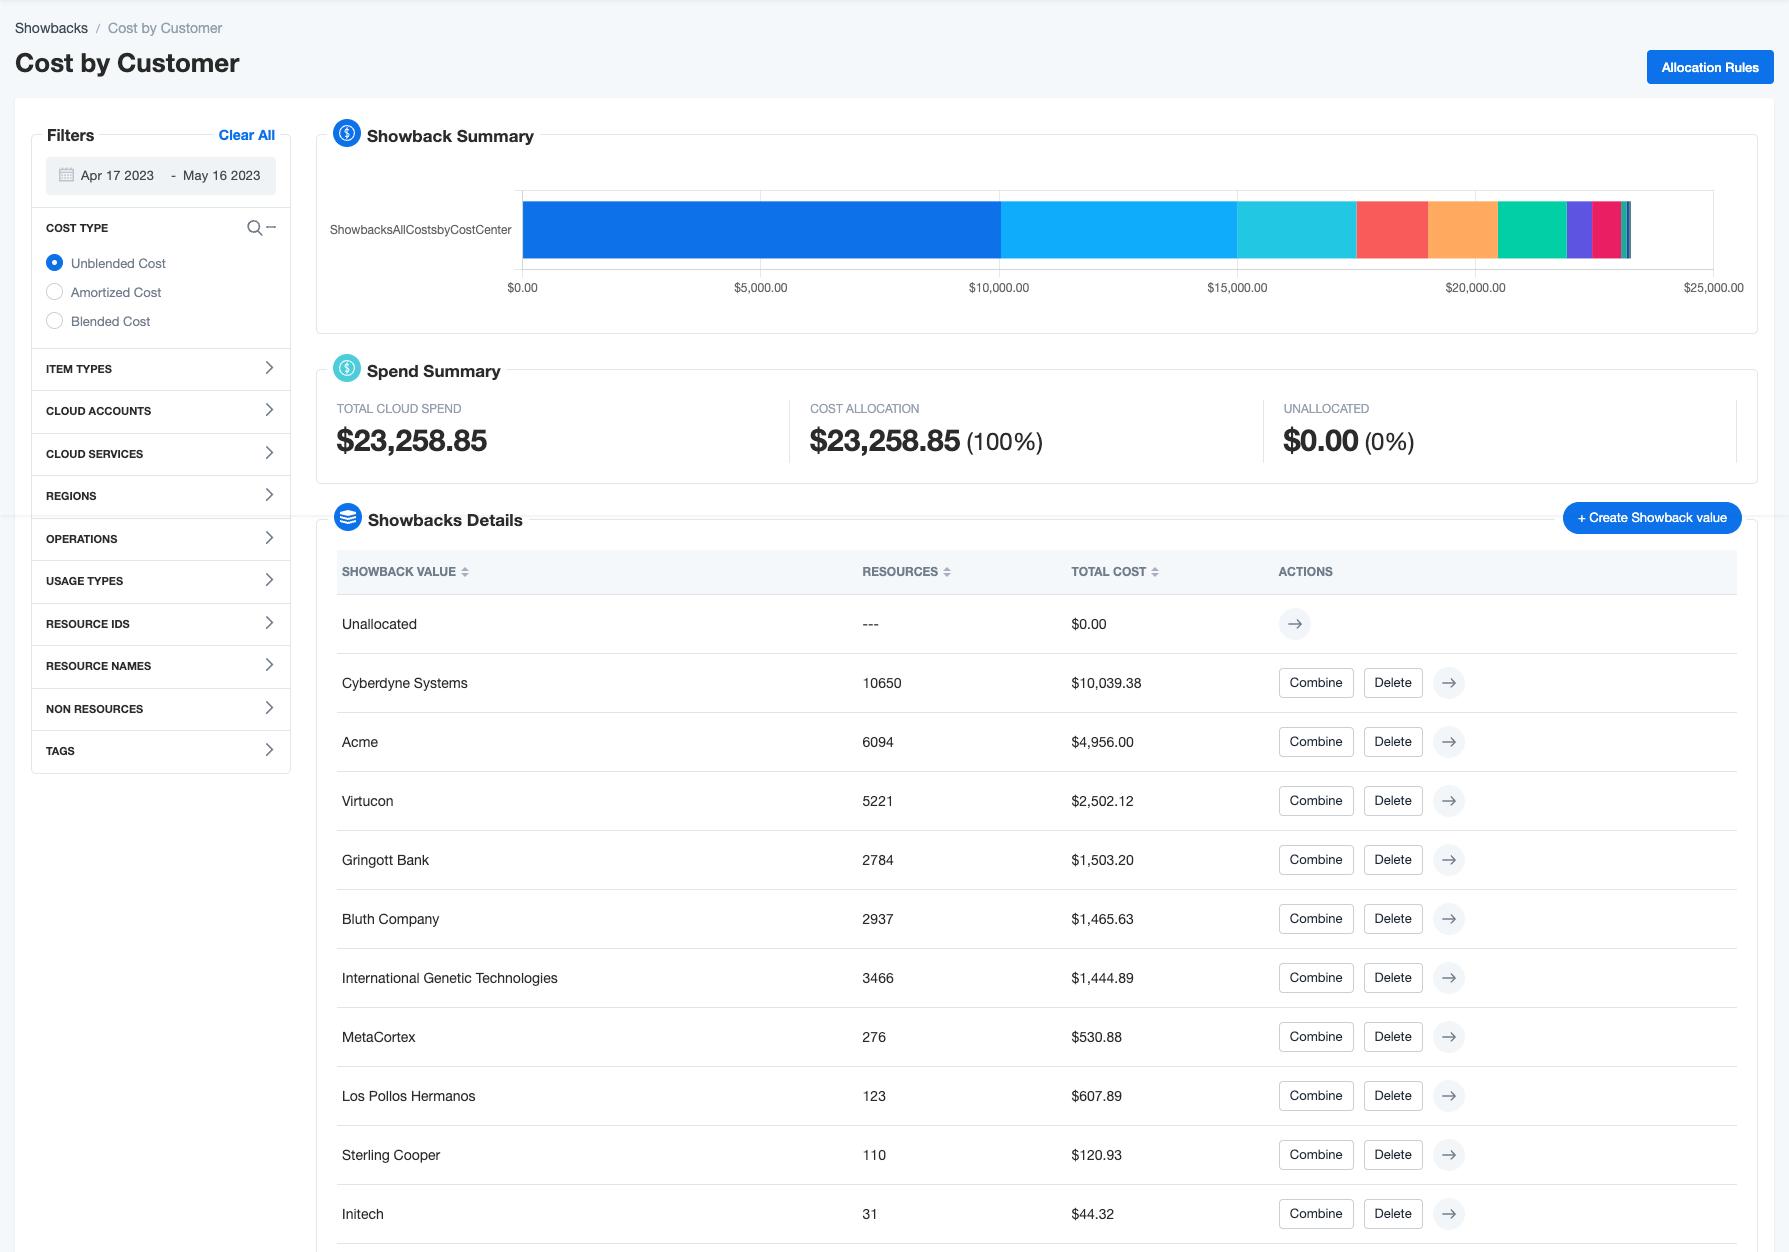
Step 1 – Create Showback Values for each customer
Step 2 – Define the scope of resources for each Showback group. In this case, some accounts were exclusive to customers.
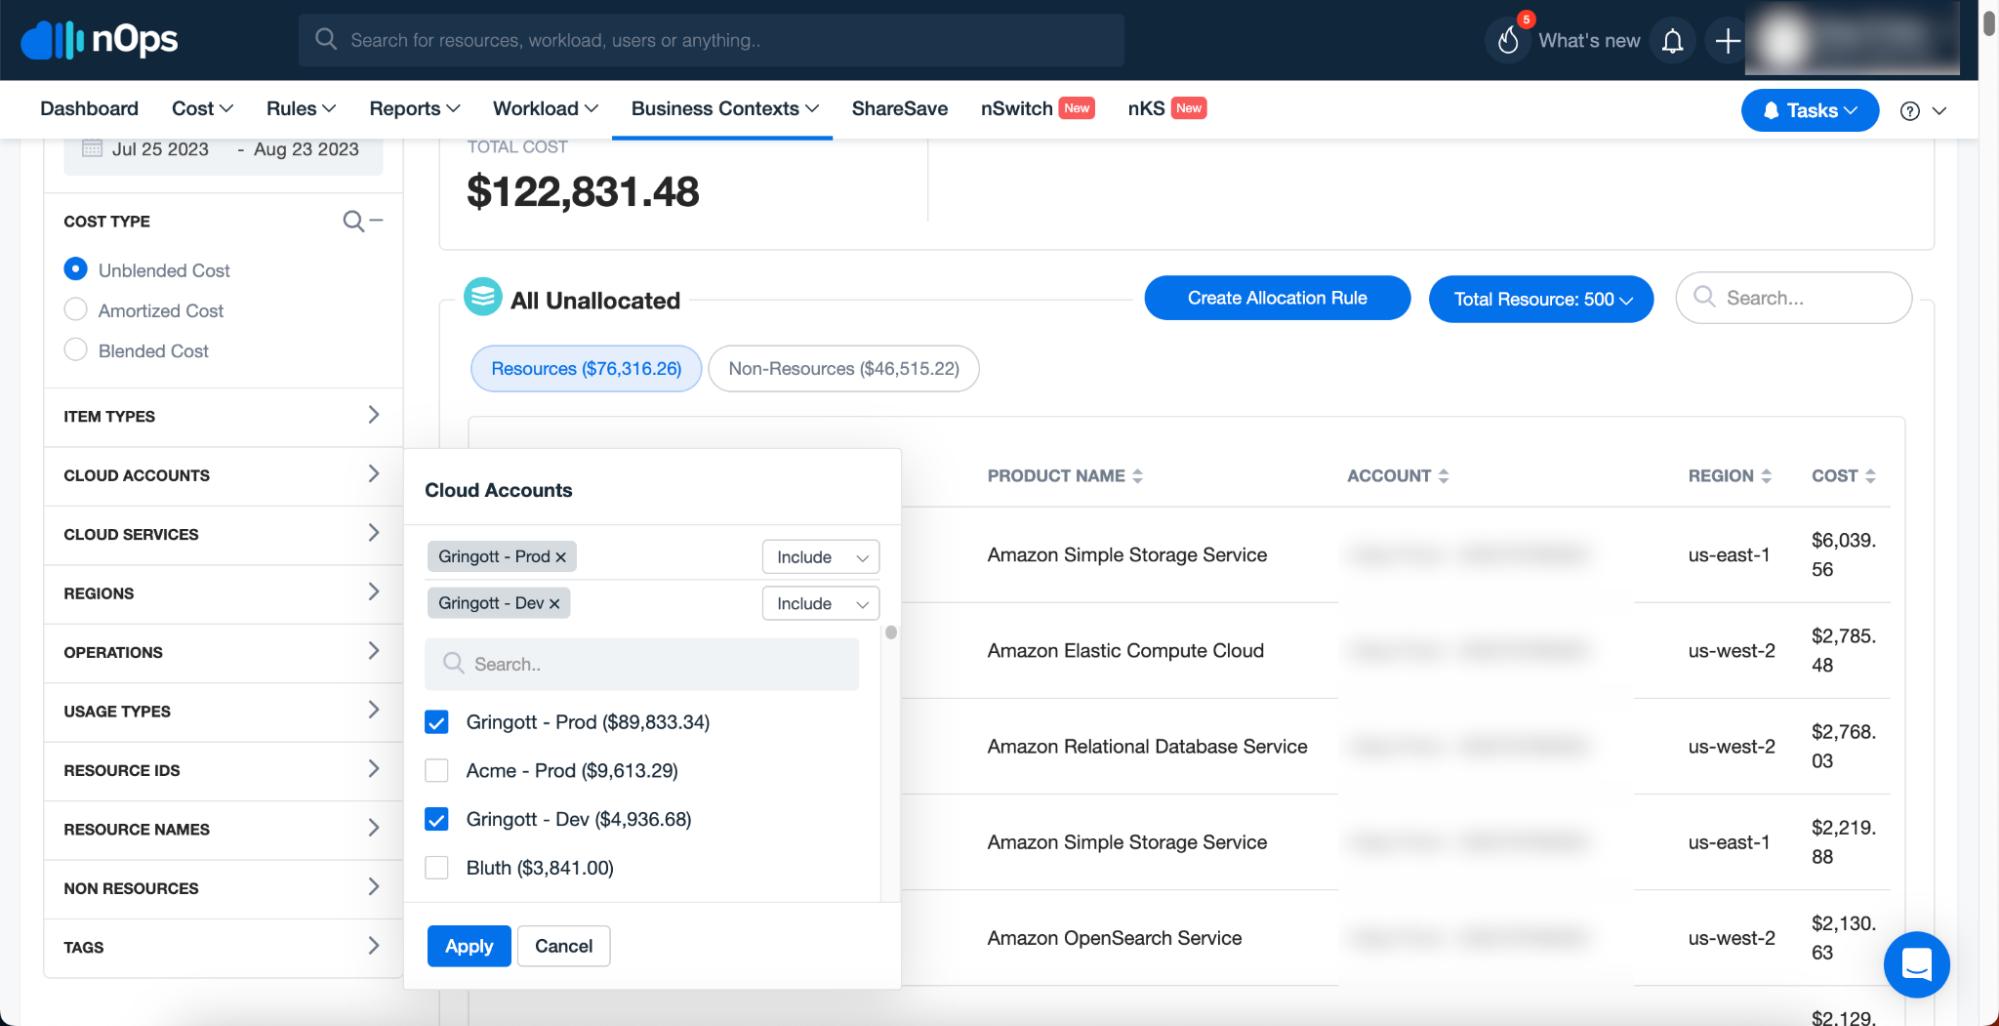
Step 3 – Create a rule to allocate the costs to a Showback Value
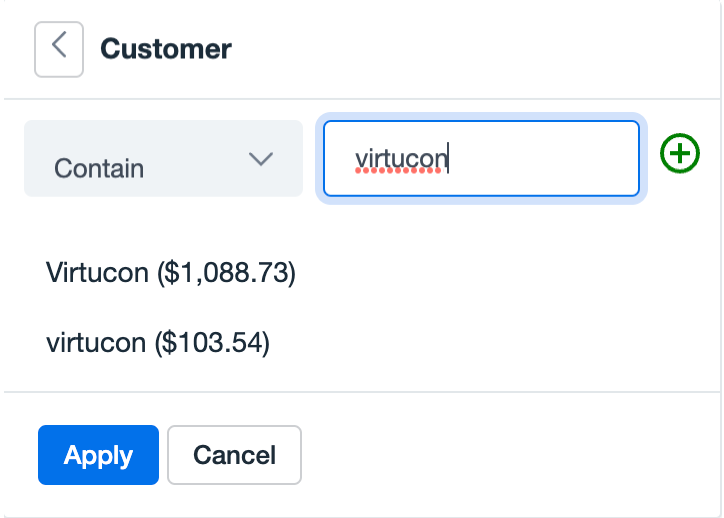
Step 4 – Isolate non-exclusive account resources by other metadata such as resource name or tag and repeat the process.
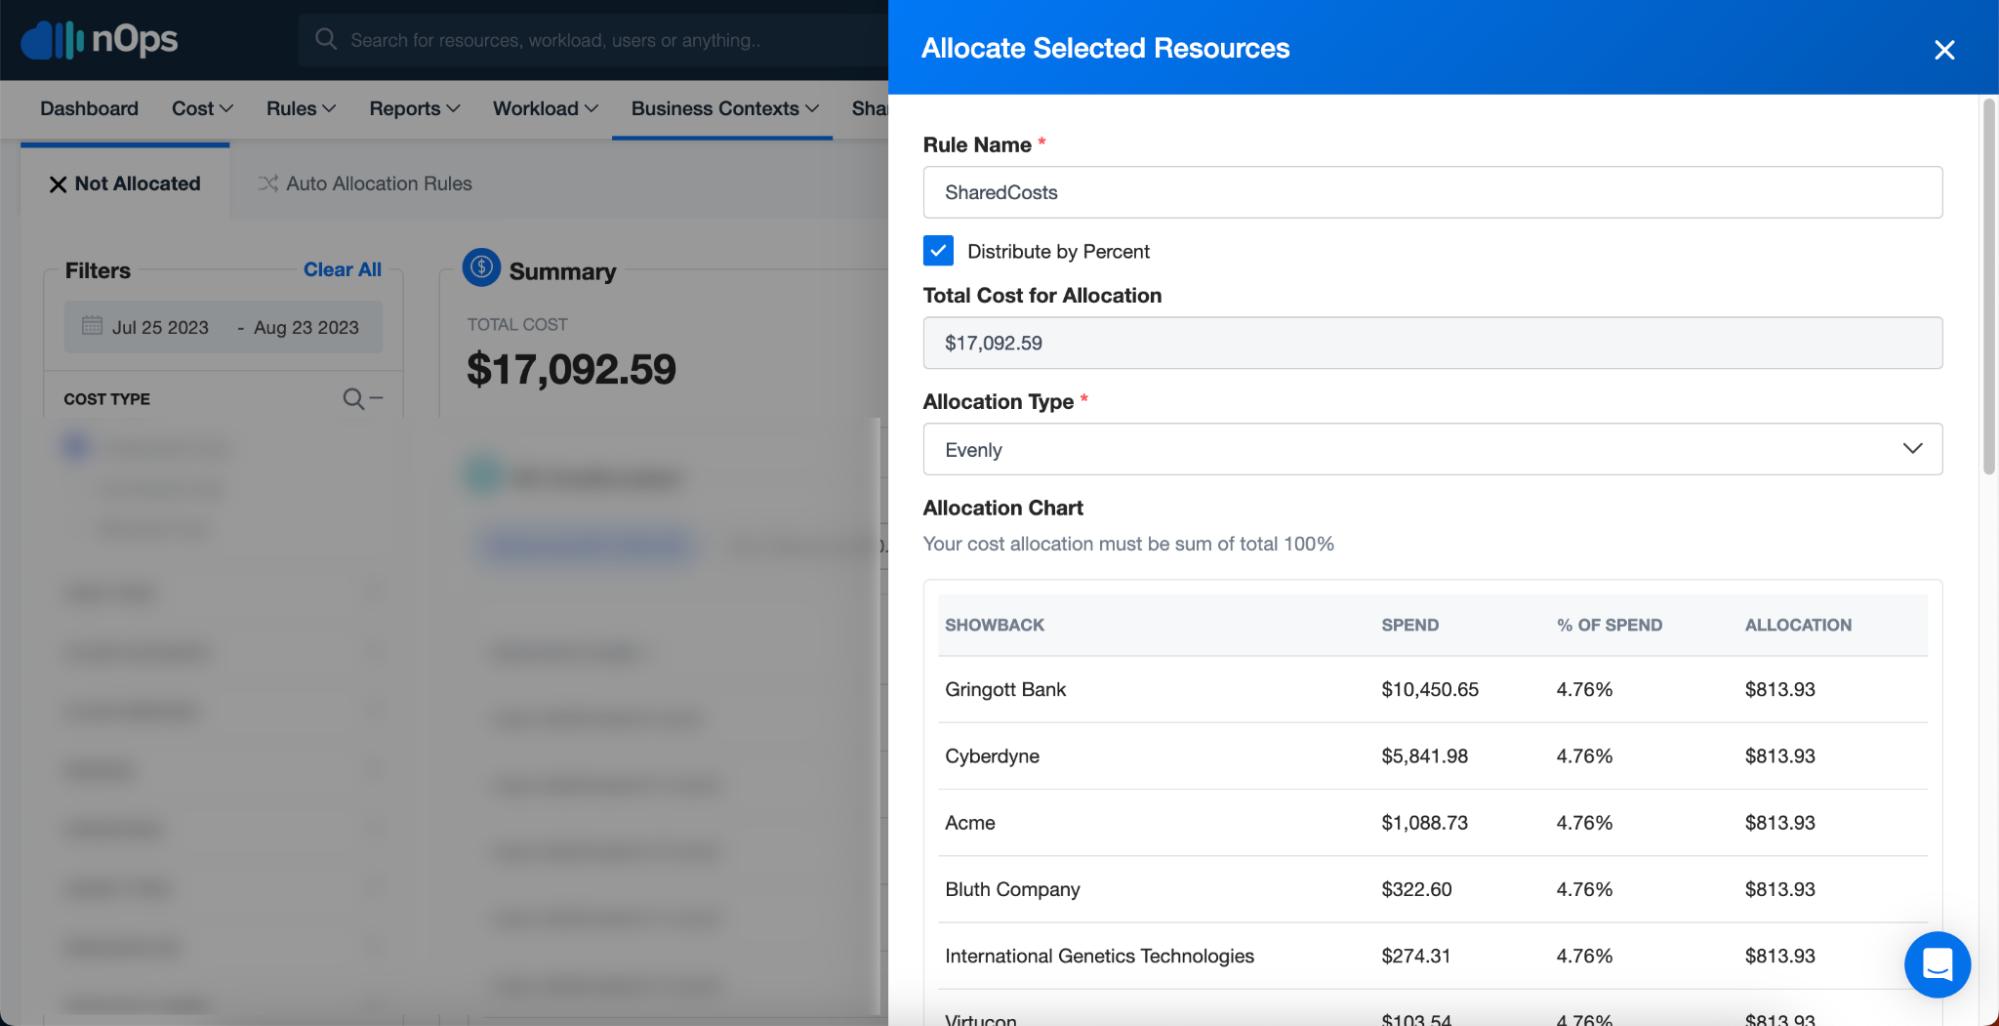
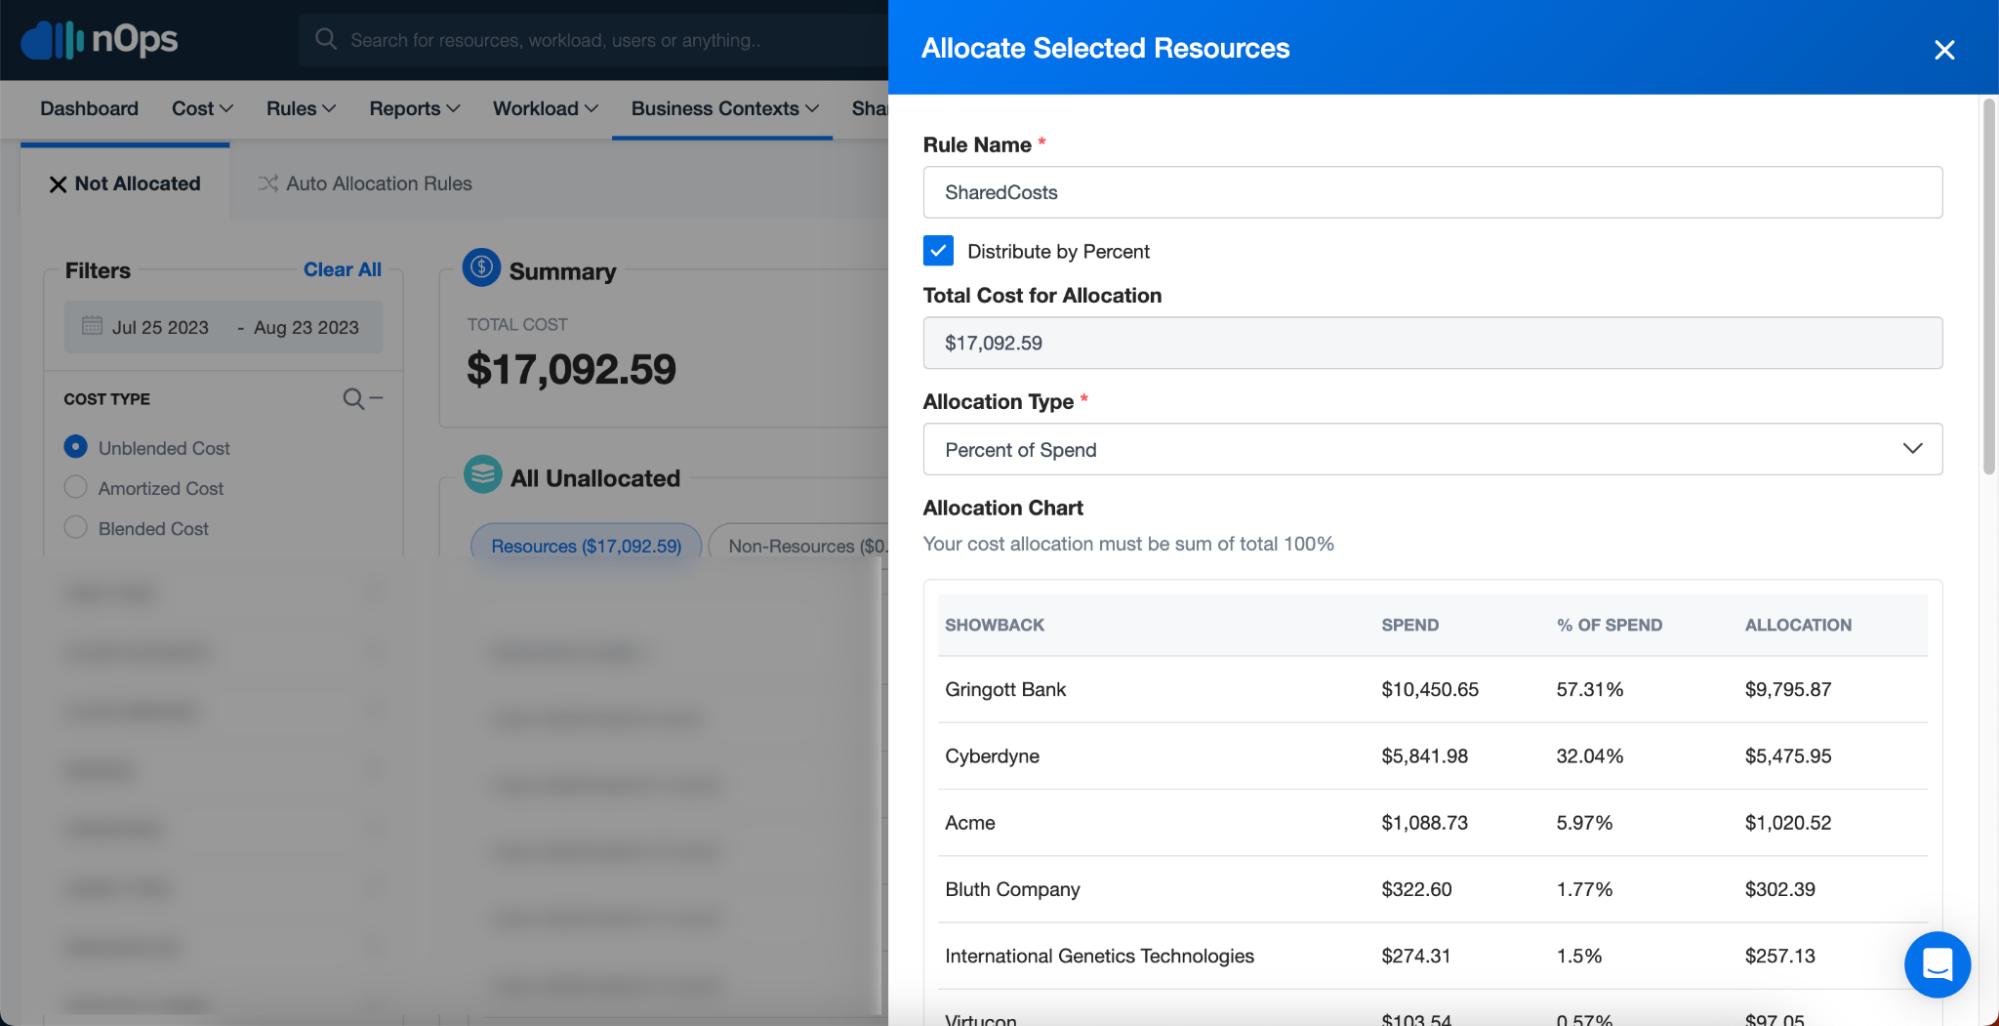
Step 5 – Define the scope of shared resources and create an allocation rule to distribute their cost. In this case, an even split was the requirement.
Here’s a recap of their (and others) situation:
- As shared costs need to be distributed across multiple customers and business units based on their nature, nOps Business Contexts allocates costs effectively by distributing them using fixed percentages or proportionate weightage that takes into account varying usage among teams or services.
- You can have more than one distribution, which helps for when you have a particular service that needs to be allocated slightly differently than the other shared costs.
- nOps streamlines the tagging strategy and even identifies untagged or inaccurately tagged resources. You can easily access past billing data in a visual and interactive environment instead of manually checking AWS cloud bills with thousands of rows of data. This helps you with a unified analysis of all costs impacting your Cost Per Customer.
- If resources are missing tags, or are tagged incorrectly, nOps can still gather resources based on other pieces of metadata while the tags are corrected. You can leverage your existing naming convention for accounts and/or resources to allocate their costs to your customers.
- And our Cost Analysis feature is the game-saver for added granularity. You can see down to the specific resources and resource groups to allocate and take the final call accordingly.
Cost Per Customer data can be a tricky metric to access and is dependent on how your infrastructure is architected, but nOps’ easy interface and powerful features help you get access to these metrics.
Let us help you save! Sign up for nOps today or book a demo call.
How Can You Measure Your SaaS Cost of Goods Sold (COGS)?