AWS X-Ray is a service that helps developers analyze and debug applications.
It provides an end-to-end view of requests as they travel through your application, showing a map of your application’s underlying components to identify and troubleshoot the root cause of performance issues and errors. It supports various platforms including AWS EC2, Lambda, ECS, and EKS.

How does AWS X-Ray work?
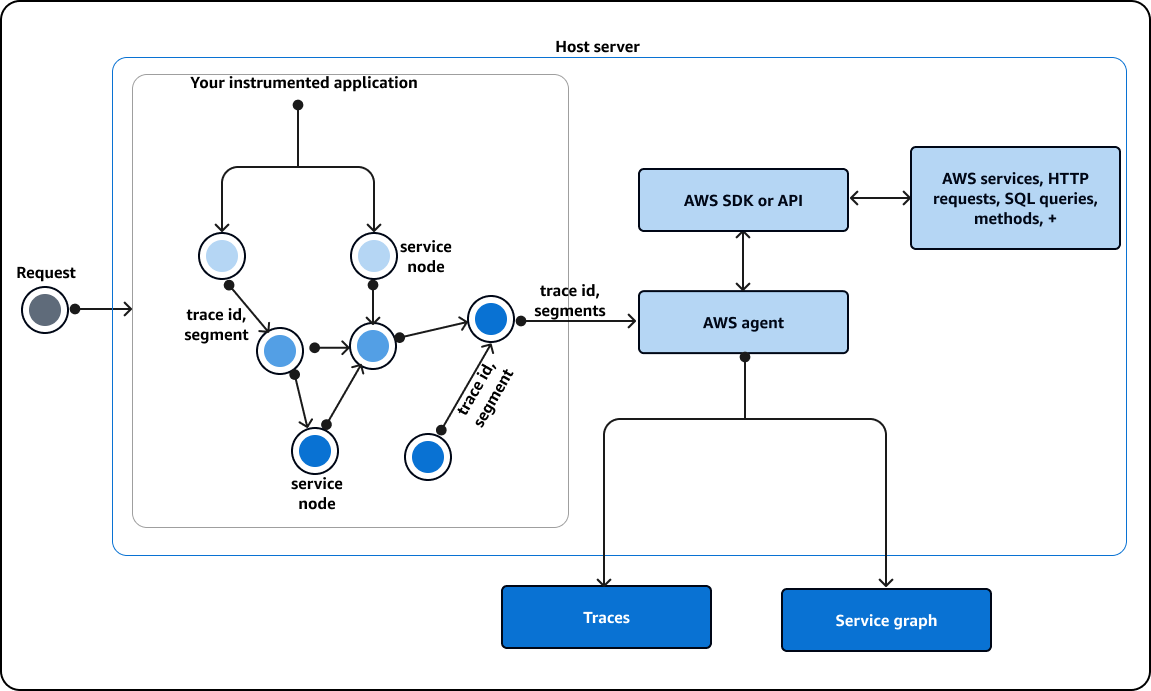
- AWS X-Ray collects data from your application and from AWS services that are integrated with X-Ray. This involves capturing data for both incoming and outbound requests, as well as other significant events within your application. Each trace includes metadata about the requests.
- To enable tracing, your application must be instrumented to send this trace data to X-Ray. For many scenarios, this may only require configuration changes. For instance, a Java application can be configured to instrument all incoming HTTP requests and downstream calls to AWS services. AWS provides various SDKs, agents, and tools to facilitate this instrumentation.
- Some AWS services, such as AWS Lambda, are pre-integrated with X-Ray. These services can add tracing headers to incoming requests and send trace data to X-Ray. AWS Lambda also automatically runs the X-Ray daemon on its workers, simplifying the use of the X-Ray SDK.
- Instead of sending trace data directly to X-Ray, client SDKs send JSON segment documents to the X-Ray daemon, which listens for UDP traffic. This daemon buffers these segments in a queue and uploads them to X-Ray in batches. The daemon is compatible with Linux, Windows, macOS, and is included in AWS Elastic Beanstalk and AWS Lambda environments.
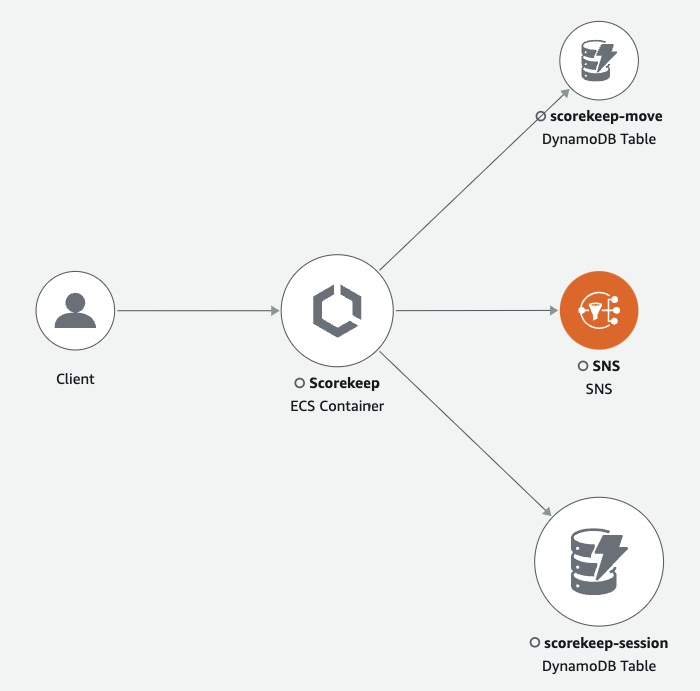
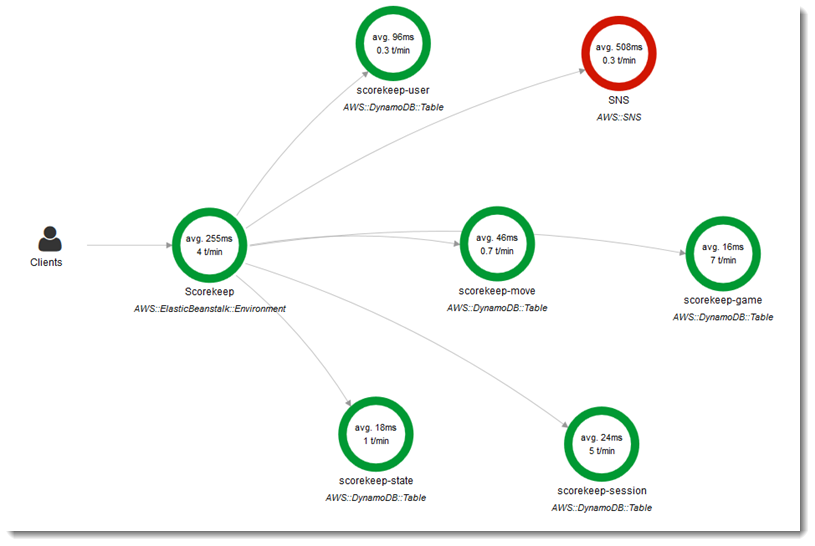
- Using the collected trace data from your AWS resources, X-Ray generates a detailed trace map that illustrates the interactions between your client, front-end service, and backend services involved in processing requests and storing data. This trace map helps identify performance bottlenecks, latency issues, and other performance problems to optimize application performance.
What are the benefits of AWS X-Ray?
Easier Error Tracking / Debugging
Visualize Architecture with the Service Map
Better Performance and Latency Reduction

Query Improvement
Root Cause Analysis
How does AWS X-Ray pricing work?
AWS X-Ray pricing is based primarily on the number of traces recorded, retrieved and scanned. A trace represents a request to your application and may include multiple data points such as for calls to other services and database access.
AWS also offers a free tier, which includes 1 million traces recorded and 1 million traces retrieved each month for the first year. Beyond the free tier, pricing is based on the volume of traces processed, with costs varying by region (below is an example from US-East North Virginia).

AWS X-Ray Key Concepts
What are traces in AWS X-Ray?

What are Segments and Subsegments in AWS X-ray?
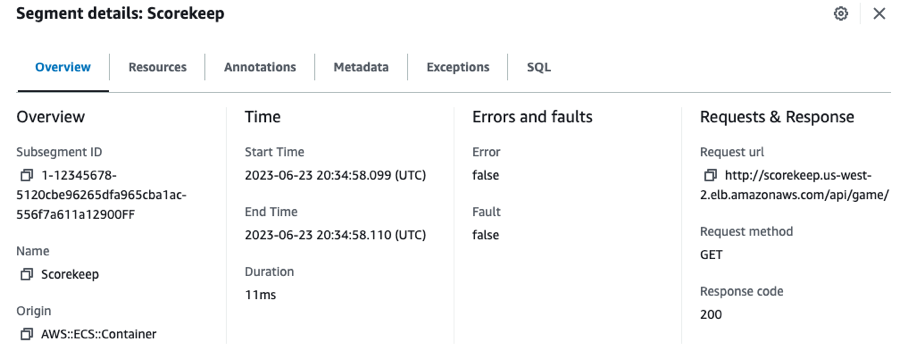
The compute resources running your application logic send data about their work as segments.
Think of segments as the main data units in a trace. Each segment corresponds to a specific service or component your request touches. For example, if a request hits a load balancer, passes through a microservice, and then interacts with a database, each of these components would generate its own segment. Each segment can represent a service, a method call, or an external HTTP request.
Subsegments provide more granular insight than segments. They break down the data further to detail specific operations or internal tasks within a service, such as SQL queries or external API calls.
What is an X-Ray Service Graph?
What are annotations and metadata?
What is the X-Ray daemon?
What is sampling?
Sampling in AWS X-Ray is a mechanism to efficiently capture information about the requests your application processes without recording every single request, which can be resource-intensive. You can configure rules to specify which requests to trace and which to ignore, based on criteria such as request type, frequency, and response time.
Sampling rules tell the X-Ray SDK how many requests to record for a set of criteria. By default, the X-Ray SDK records the first request each second, and five percent of any additional requests.
AWS X-Ray FAQ
Does X-Ray provide an API?
Which AWS service can I use with X-Ray?
What coding languages does the X-Ray SDK support?
The X-Ray SDK supports:
- Go
- Java
- js
- Python
- .Net
- Ruby
Get better performance at lower costs with nOps
If you’re looking to optimize your AWS costs, nOps makes it easy and painless for engineers to take action on cloud cost optimization.
The nOps all-in-one cloud platform features include:
Business Contexts: Understand and allocate 100% of your AWS bill down to the container level
Compute Copilot: Intelligent provisioner that helps you save with Spot discounts to reduce On-Demand costs by up to 90%
Commitment management: Automatic life-cycle management of your EC2/RDS/EKS commitments with risk-free guarantee
Storage migration: One-Click EBS volume migration
Rightsizing: Rightsize EC2 instances and Auto Scaling Groups
Resource Scheduling: Automatically schedule and pause idle resources
nOps was recently ranked #1 with five stars in G2’s cloud cost management category, and we optimize $1.5+ billion in cloud spend for our customers.
Join our customers using nOps to understand your cloud costs and leverage automation with complete confidence by booking a demo today!
