Introducing Databricks Optimization in nOps: Find and fix idle Databricks compute in a few clicks
Today, we're announcing Databricks optimization in nOps.
nOps now finds the Databricks compute you're paying for but not using, and tells you exactly what to change. Each recommendation names the SQL warehouse, cluster, job or app, the hours it sat idle, and what you'd save each month, counting both the Databricks DBUs and the AWS EC2 behind it. Every one comes with the steps to fix it: open a Jira or Linear ticket, or hand the change to Claude Code, Cursor or Codex in one click. It's built for data platform engineers and FinOps teams running Databricks on AWS, and it sits on top of the Databricks cost visibility already in nOps, so every saving ties back to a line on your bill.
Why Databricks waste is so hard to catch
- Databricks cost is split across two bills. You pay Databricks for DBUs and AWS for the EC2 instances your clusters launch. Neither bill alone shows what a warehouse or cluster really costs, so nobody can answer "what does this workload cost us?"
- Idle compute hides in plain sight. SQL warehouses with auto-stop turned off, all-purpose clusters kept awake by a polling notebook, and apps left running all bill around the clock. In our own account, three resources ran 718 to 720 of the last 720 hours, mostly at their idle floor.
- Findings don't turn into changes. A dashboard tile that says "cluster X is expensive" doesn't tell the owner what to change, how risky it is, or whether it worked. Recommendations sit open because acting on them is a research project.
Recommendations that count the whole cost and tell you what to do
- A recommendation for every kind of Databricks compute: nOps now runs Databricks recommendations every day: stop always-on SQL warehouses, all-purpose clusters and apps outside business hours; move compute to Graviton; use spot workers for non-production; schedule always-on streaming jobs; move Pro SQL warehouses to serverless; and switch serverless jobs to standard performance mode. They build on the Databricks visibility you already have in nOps Explorer, where Databricks is a first-class cost entity broken down by SKU (Jobs, Serverless, SQL, All-Purpose, Photon) and by day.
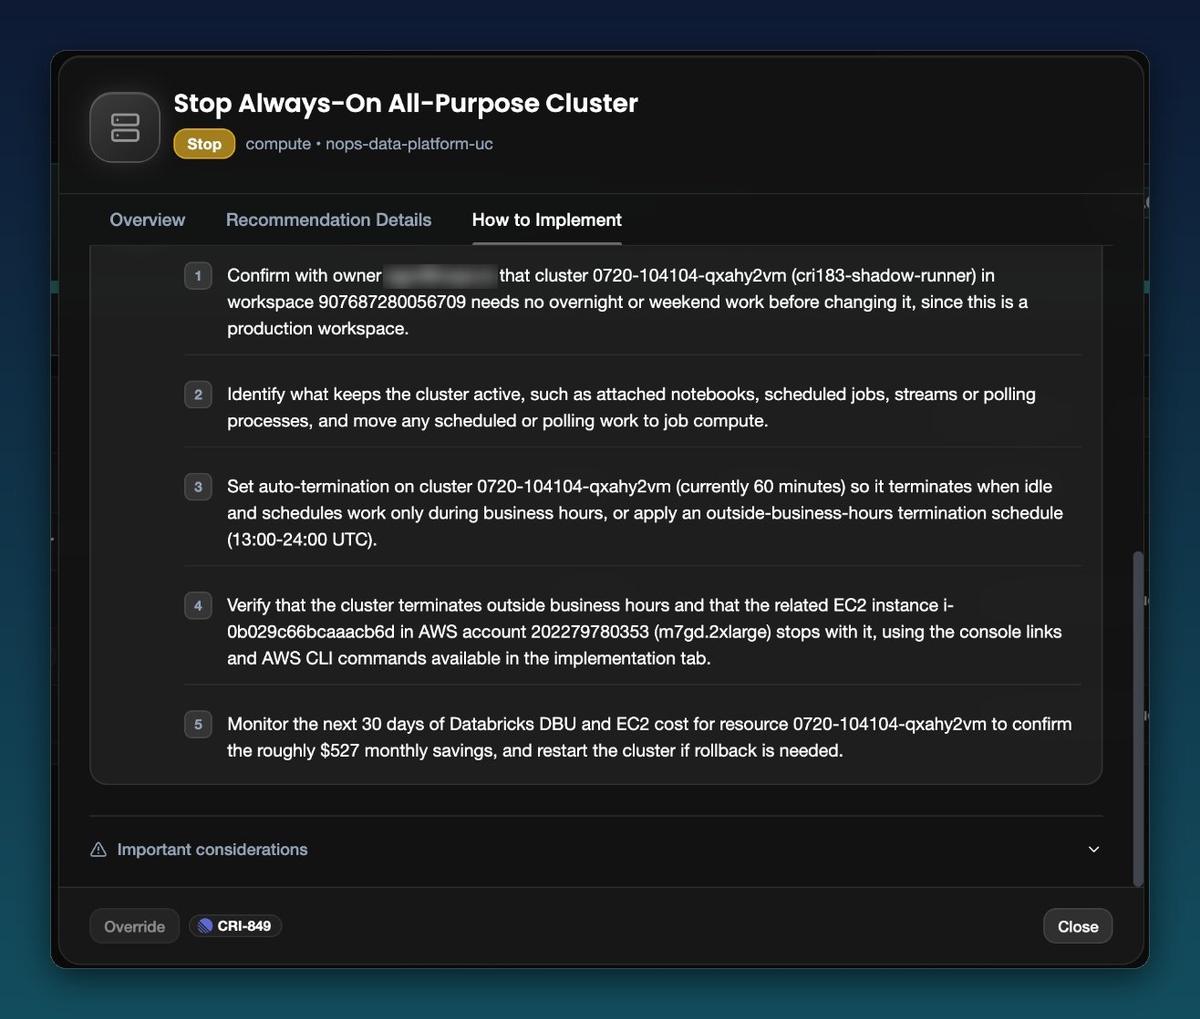
- Built on the full picture: Each recommendation counts the whole cost of the resource, not just DBUs. nOps matches the EC2 instances a cluster launched and adds them to the saving, so the cluster below shows $422 of DBUs plus $105 of EC2. Every number comes from the last 30 days of hourly billing, enriched with Databricks system tables (owner, auto-stop setting, off-hours query count, the client app running those queries). Each recommendation carries a confidence, change risk, rollback and restart rating, and the evidence behind it.
- Clear next steps: Owners get a decision they can act on in minutes: what to change, why it's safe, what it saves. Savings are tracked from open to in progress to achieved, and only count as achieved once billing confirms them.
What nOps found in our own Databricks account
We run nOps on nOps. When we turned these recommendations on for our own Databricks account, they found $1,814 a month (about $21,800 a year) of compute we were paying for while nobody was using it. Here's what that looks like in the product.
Start from the bill
Every recommendation starts from your bill, so that's where we'll start too. In Explorer, filter to Databricks and you'll see your whole Databricks bill day by day, split by SKU: Jobs, Serverless, SQL, All-Purpose and Photon.
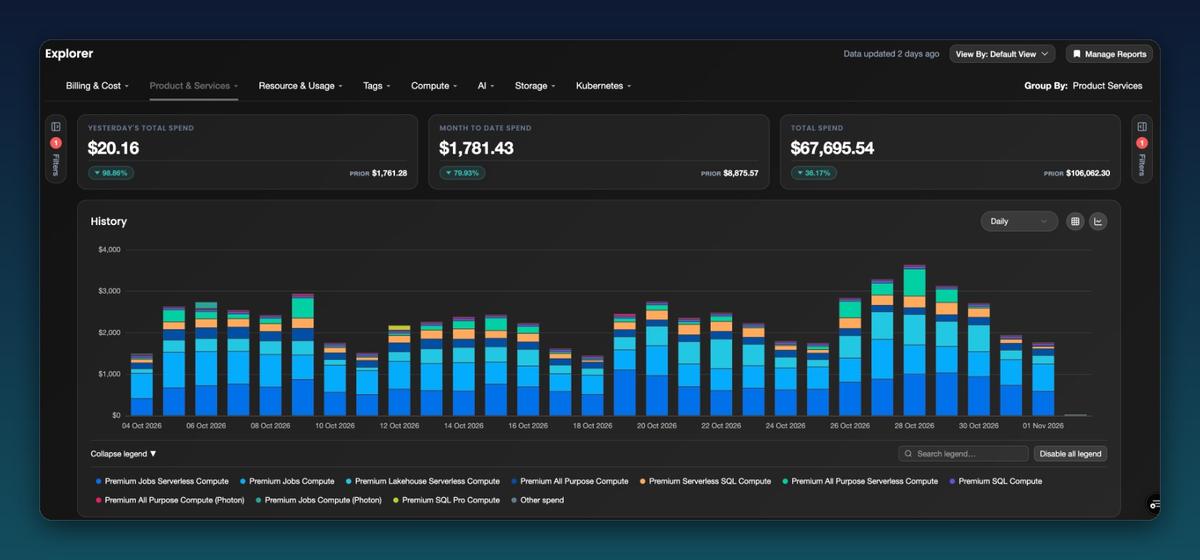
Our Databricks bill came to $67,695 over the last 30 days. Hover over any day to see which SKUs drove it. This is the number every saving below is measured against.
Scroll down and the same data becomes a table, so you can see which SKUs are growing and which are shrinking compared with the previous 30 days.
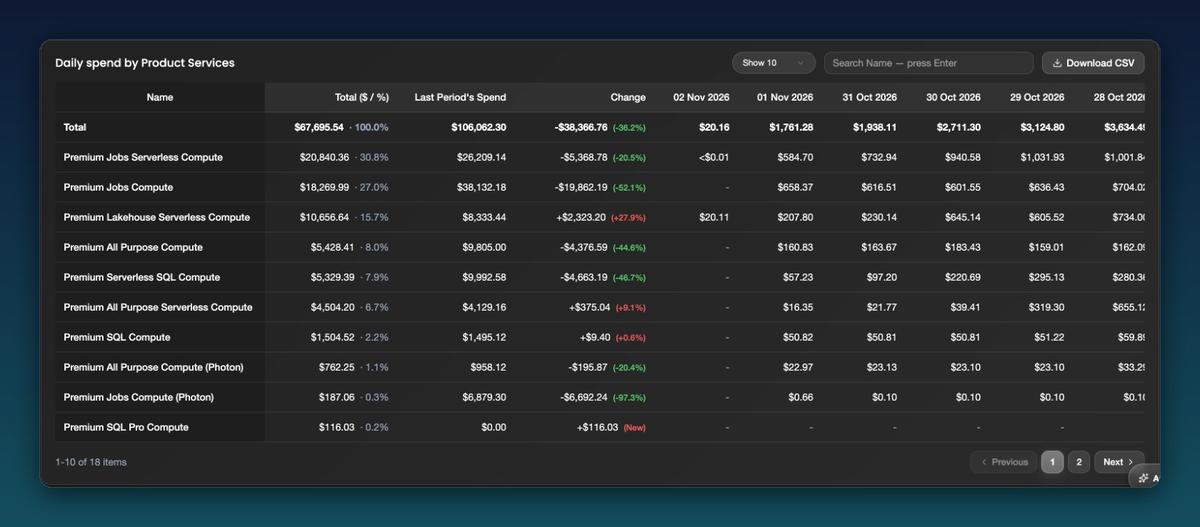
In our case, total Databricks spend fell 36% from the month before. Classic Jobs Compute dropped by more than half while Lakehouse Serverless grew 28%. Visibility tells you what changed.
Recommendations tell you what to do about it.
Find the idle compute
Now for the new part. Open Recommendations and search for Databricks. You'll see every Databricks resource you're likely overpaying for, how much effort the fix takes, and what it saves each month.
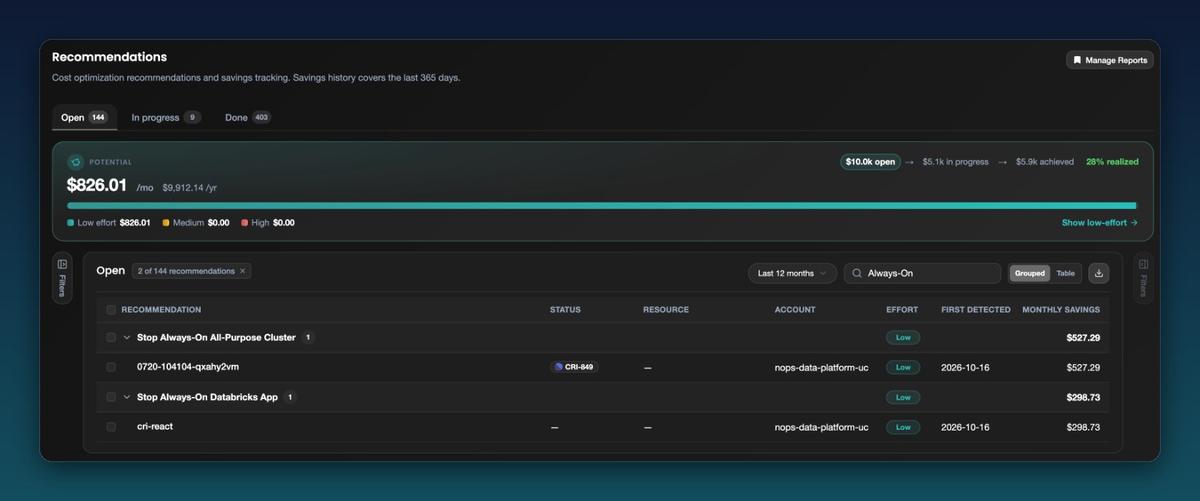
We had an all-purpose cluster and a Databricks App running around the clock, worth $826 a month together, and both are low-effort fixes. A third one, a SQL warehouse, was already in progress with its owner.
Know exactly why, and whether it's safe
Click any recommendation to get the full story. Here's our SQL warehouse: auto-stop was turned off, so it ran all 720 hours of the last 30 days, and in 468 of its 500 off-hours it was sitting at its idle minimum.
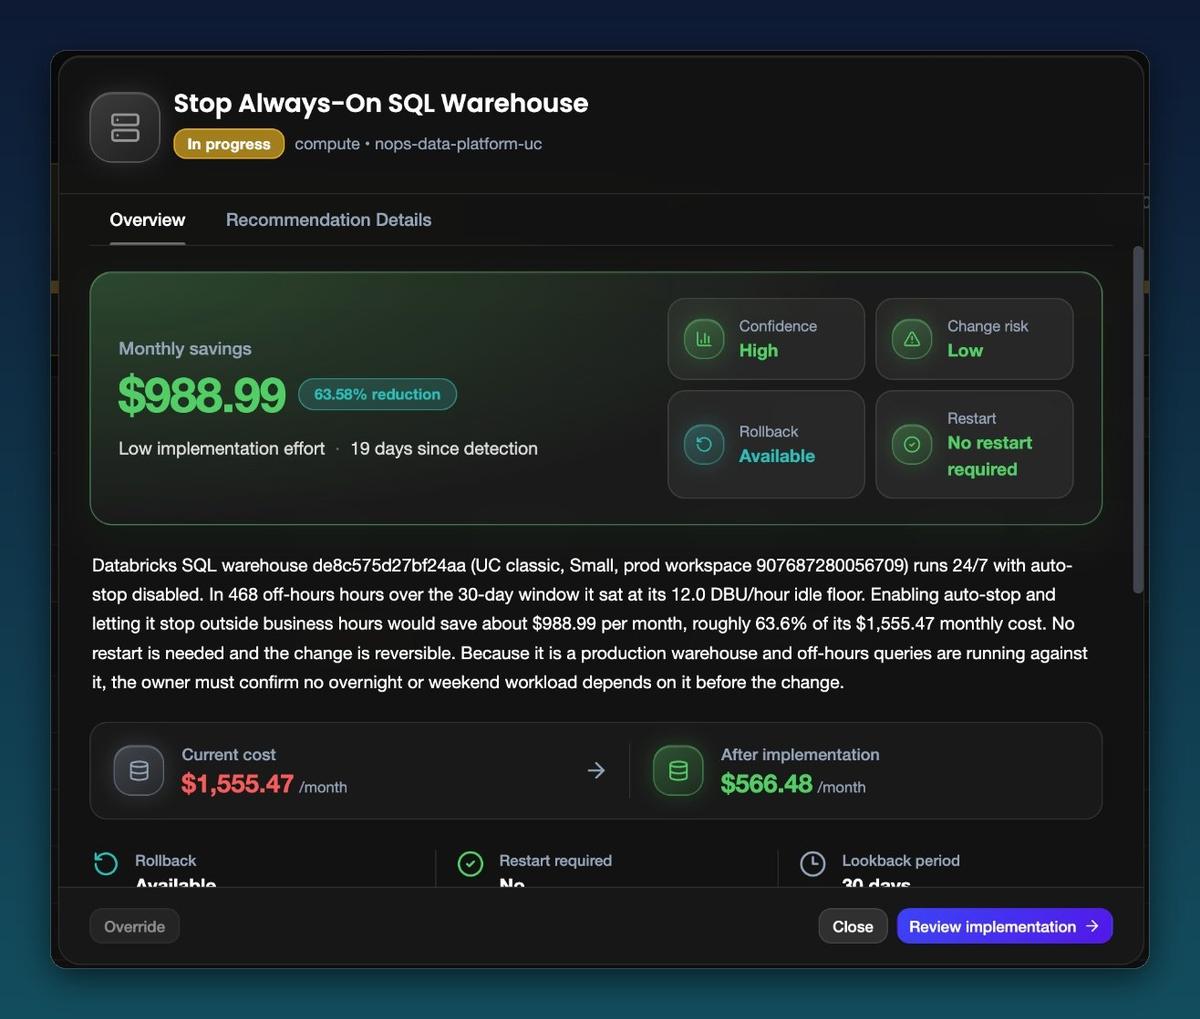
Letting it stop outside business hours saves $988.99 of its $1,555.47 monthly bill. The cards on the right tell you the rest at a glance: high confidence, low change risk, easy to roll back, and no restart needed.
Want to check the math? Switch to Recommendation Details for the evidence behind every number.
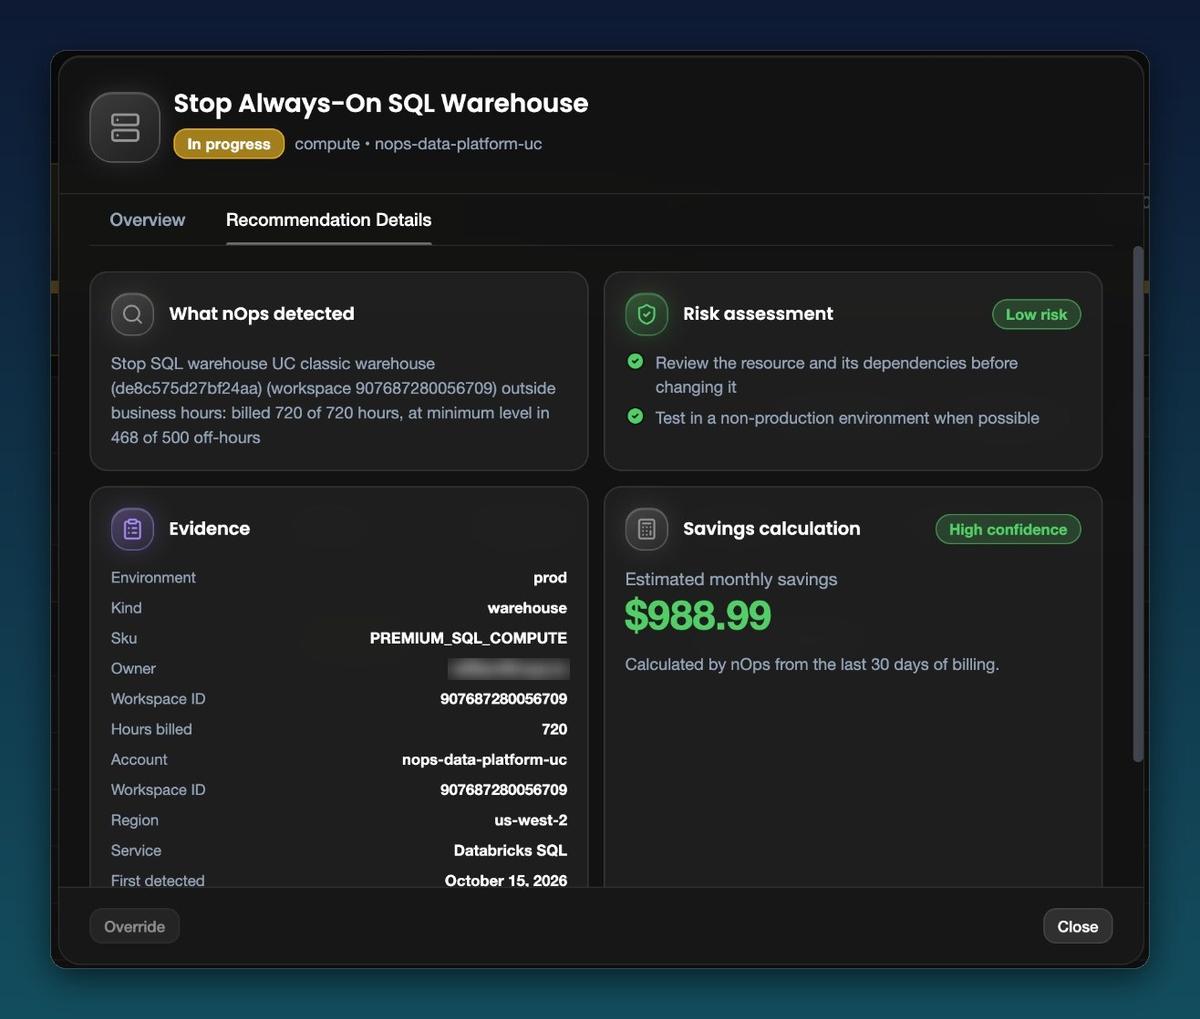
You can see the SKU, owner, workspace, hours billed, region and the date nOps first spotted it, so whoever owns the warehouse can sign off without leaving nOps.
For clusters, nOps goes a step further and counts the whole cost, not just DBUs.
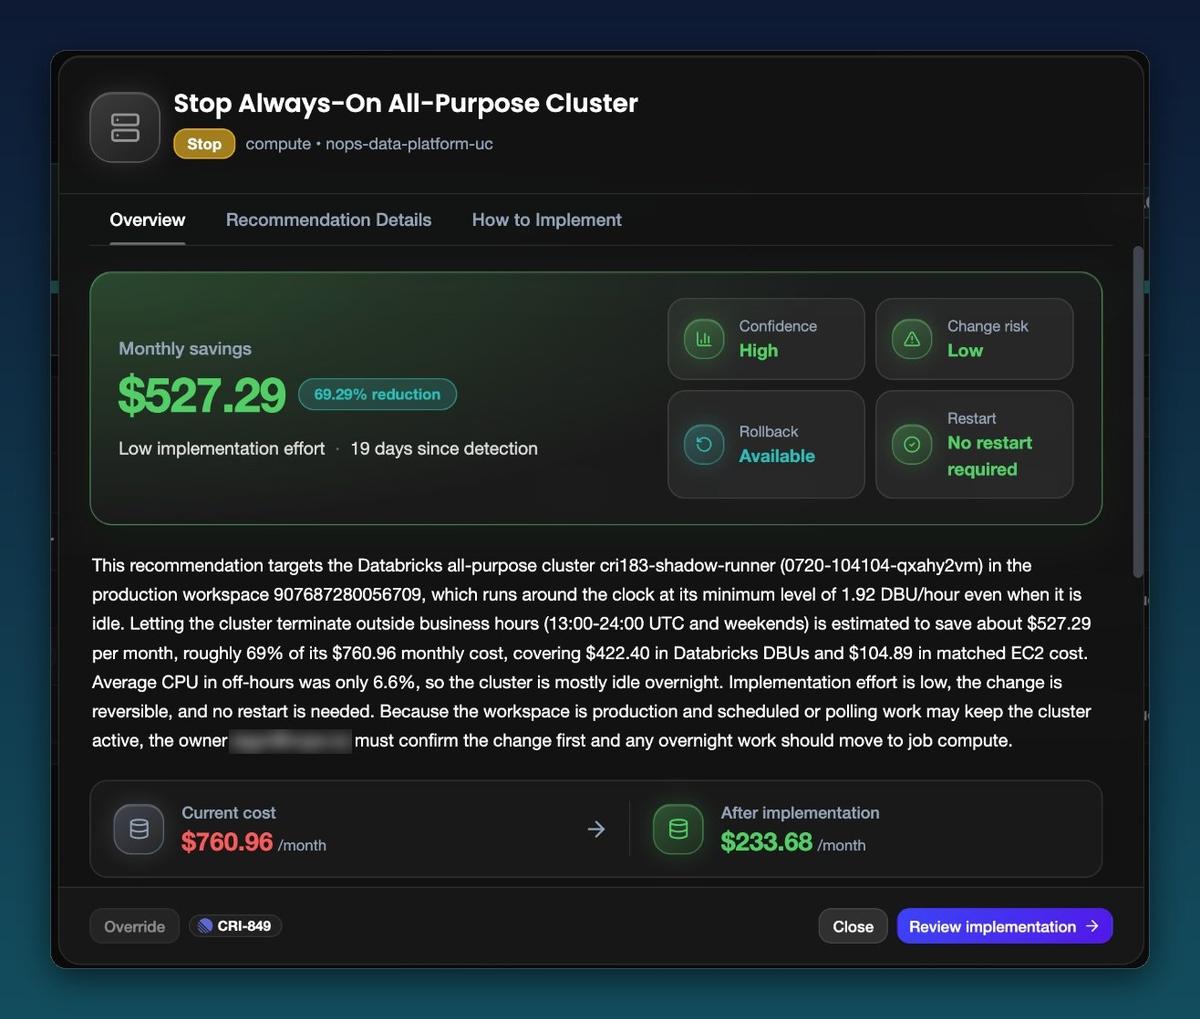
This all-purpose cluster ran at its minimum size day and night, averaging just 6.6% CPU after hours. nOps matched it to the EC2 instance it launched, so the $527.29 monthly saving includes $422.40 in Databricks DBUs plus $104.89 in EC2 that never shows up on your Databricks invoice.
The bottom line: A ranked list of Databricks savings, each with the dollar amount, the evidence behind it and a risk rating. In our own account that added up to $1,814 a month across three resources, about 2.7% of our Databricks bill, and nobody had to dig through a billing export to find it.
Go from recommendation to savings in five steps
- Navigate to Inform → Explorer, open Filters → Billing & Cost → Cost Entity, and include Databricks. Group by Product Services to see spend by SKU.
- Go to Inform → Recommendations and search Databricks (or Always-On) to see every Databricks recommendation, its effort and its monthly saving.
- Click a recommendation. Overview gives the saving, confidence, change risk, rollback and restart; Recommendation Details gives the evidence.
- Open How to Implement and pick how to make the change: create a Jira or Linear ticket with the savings and resource IDs, hand it to Claude Code, Cursor or Codex with a ready-to-send task, or follow the generated steps.
- Move it to In progress. nOps keeps the projected saving there and moves it to Achieved only once billing confirms it.
When you're ready to act, open How to Implement. You can create a Jira or Linear ticket with the details already filled in, or hand the task to Claude Code, Cursor or Codex in one click.
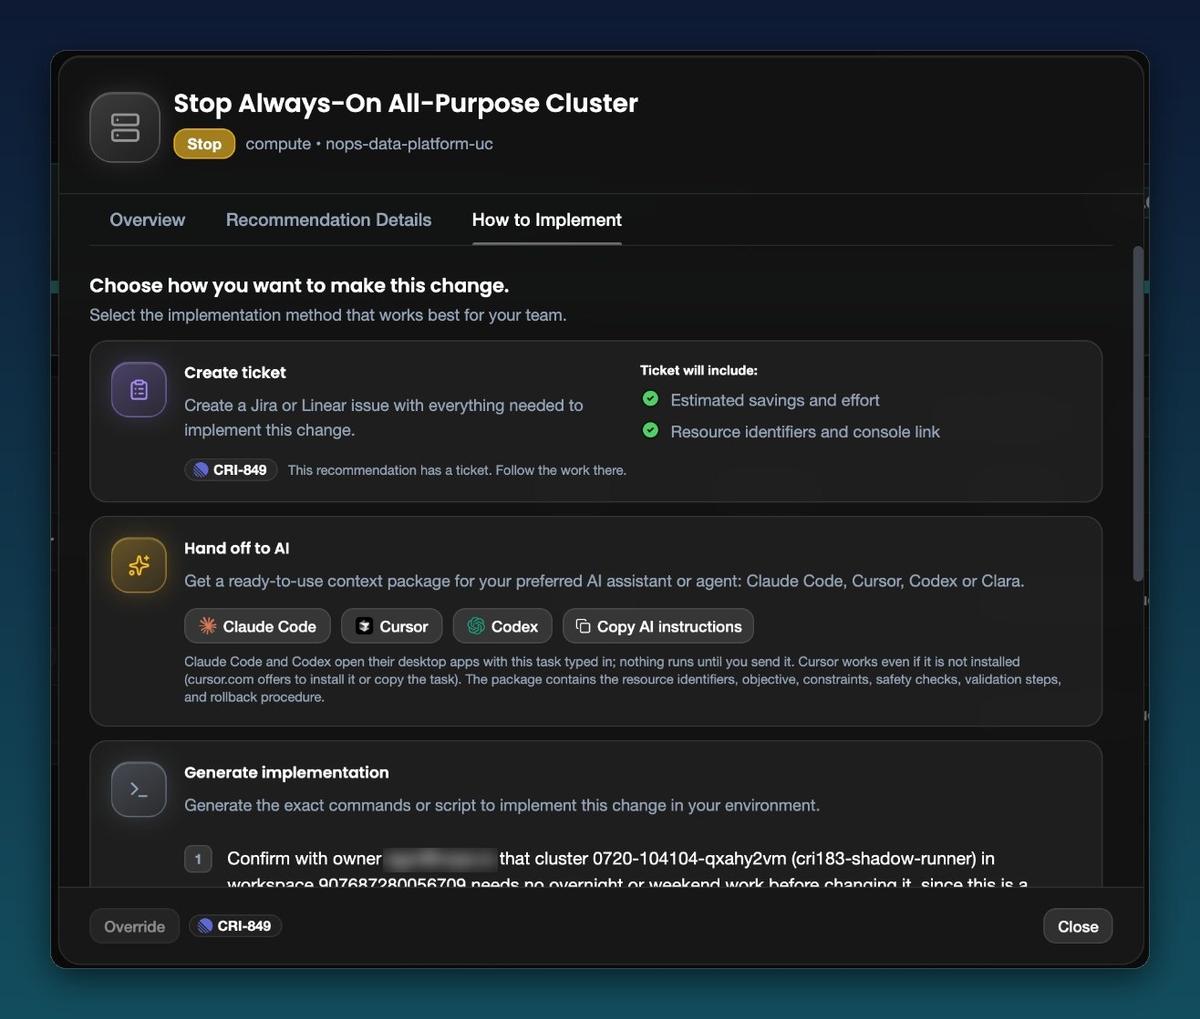
Prefer to make the change yourself? nOps writes out the steps for you, from who to check with first to how to confirm the savings actually showed up on your bill.
Frequently Asked Questions
Which Databricks recommendations does nOps offer?
Here's what nOps looks for today. Every recommendation uses the last 30 days of hourly billing.
Recommendation | What nOps looks for |
|---|---|
Stop Always-On SQL Warehouse | SQL warehouses billed every hour, sitting at their idle minimum outside business hours |
Use Spot Workers for Non-Production Compute | Non-production jobs, pools and clusters running on on-demand workers that could use spot |
Schedule Always-On Streaming Jobs | Jobs that bill in more than 90% of hours but only process a handful of runs |
Move Databricks Compute to Graviton | x86 EC2 instances under Databricks that have a cheaper Graviton equivalent |
Stop Always-On All-Purpose Cluster | All-purpose clusters running at minimum size around the clock, counting both DBUs and EC2 |
Stop Always-On Databricks App | Databricks Apps billed every hour at their minimum size |
Let Lakebase Compute Scale to Zero | Lakebase compute that never scales down, even when it's idle |
Move Pro SQL Warehouse to Serverless | Classic or Pro SQL warehouses that would cost less on your own serverless rate |
Use Standard Performance Mode for Serverless Jobs | Recurring serverless jobs running in performance-optimized mode that don't need it (savings are an estimate) |
Switch Continuous Lakeflow Pipelines to Triggered; Let Model Serving Scale to Zero | Pipelines and serving endpoints that stay on around the clock |
What do I need to connect?
Connect the nOps Databricks integration, which reads your Databricks billing and system tables for details like the owner, the auto-stop setting and query activity. Add your AWS Cost and Usage Report too, so nOps can match the EC2 instances your clusters launch and include them in the saving.
How does nOps calculate the savings?
Every number comes from your own billing data over the last 30 days. For clusters, nOps adds the EC2 cost to the Databricks DBUs, so the saving reflects what you actually pay across both bills. Open Recommendation Details on any recommendation to see the evidence behind it.
How often are recommendations updated?
Every day, using the most recent 30 days of hourly billing.
Will nOps change anything in my Databricks workspace?
No. nOps only reads your billing and system-table data. You decide what to change, and you make the change your way: through a Jira or Linear ticket, by handing it to Claude Code, Cursor or Codex, or by following the steps nOps writes out for you.
How do I know a change is safe?
Every recommendation shows a confidence level, a change-risk rating, how easy it is to roll back, and whether a restart is needed. Start with the high-confidence, low-risk ones, and check with the resource owner nOps lists before you make the change.
How do I know the savings actually happened?
Move a recommendation to In progress when you start on it. nOps keeps tracking it and marks it Achieved only once your bill confirms the lower cost.
How do I get started?
If your Databricks integration is already connected, go to Inform → Recommendations and search for Databricks. New to nOps? Book a demo and we'll walk you through it on your own Databricks data.