New nOps Playground — Smarter Multicloud Commitment Management, Powered by AI
Cloud commitment decisions are high stakes. Lock into a 1, 2, or 3-year commitment that doesn’t match your actual usage, and you’re paying for capacity you’ll never consume. Stay on-demand to keep flexibility, and you’re leaving significant savings on the table. Most teams end up somewhere in between — making coverage decisions across AWS, Azure, and GCP with limited visibility and fragmented data.
That’s why we built a new flexible way to analyze and understand your cloud commitments.
The new Playground makes it easy for anyone — from sales to engineering — to explore cloud cost and commitment data interactively, without needing deep technical expertise or upfront integration.
What's New
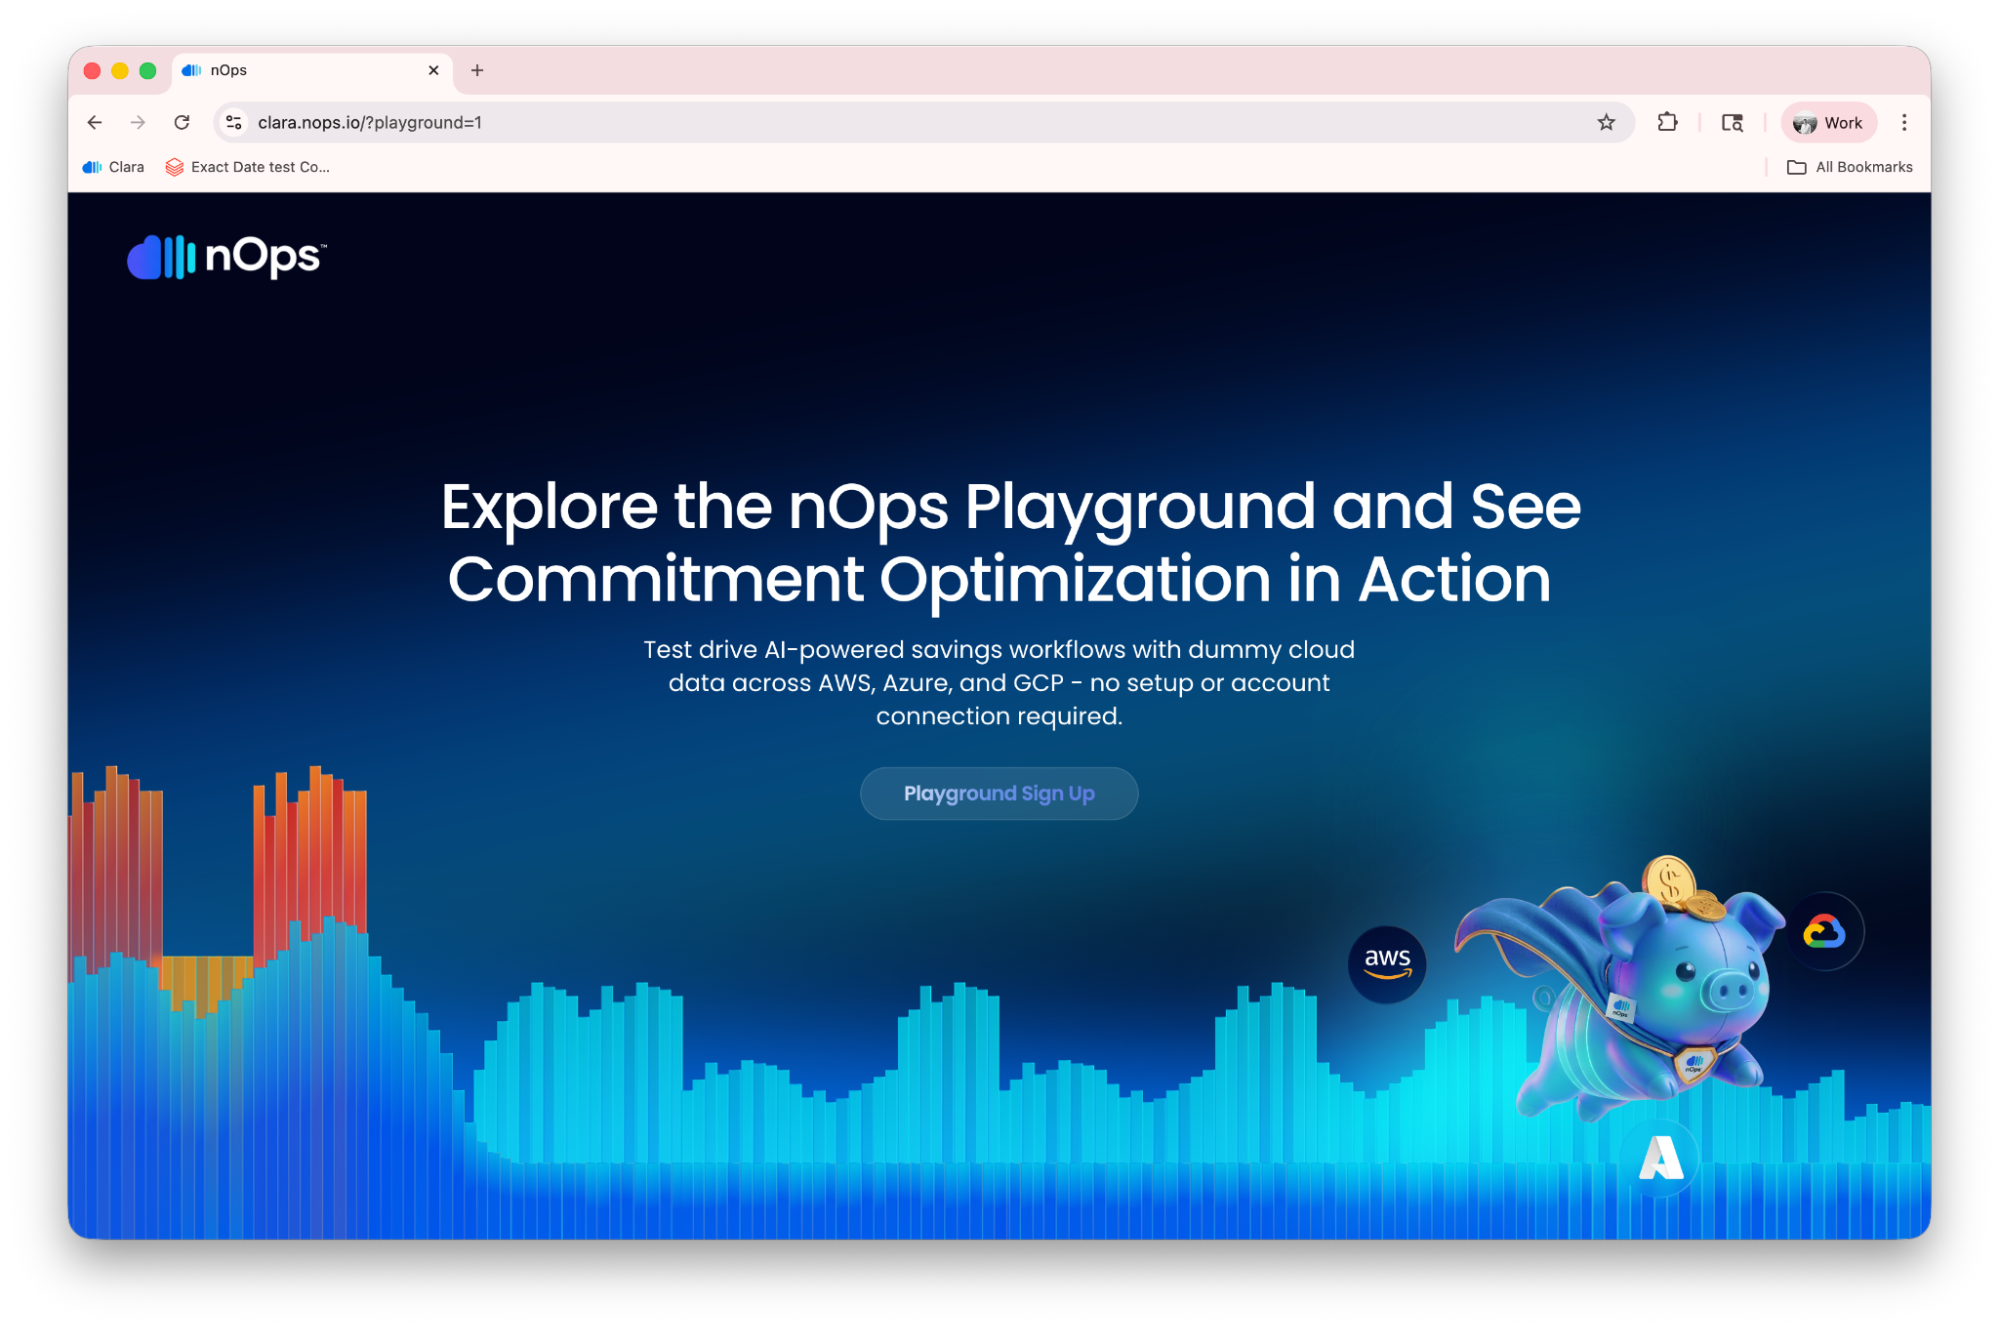
We’re excited to introduce the nOps Playground — an interactive, self-guided environment where you can explore the full capabilities of our new commitment management platform using real demo data and pre-built templates. Starting today, you can access the Playground directly from nOps Playground and start exploring immediately.
The Playground isn’t a watered-down demo. It’s the same platform that new commitment management customers are already using in production across AWS, Azure, and GCP — loaded with sample data so you can see exactly how it works before connecting your own cloud accounts.
Canvases — Your Customizable Commitment Command Center
Many teams struggle to get fast, actionable insights into their cloud commitments. Traditional dashboards are rigid, require setup, and often depend on complex queries or preconfigured reports.
We reimagined cloud data analysis in the age of AI by completely rebuilding the experience.
Canvases are flexible, infinite workspaces for visualizing and interrogating your commitment data — think of them as dashboards without constraints. Unlike traditional fixed-layout dashboards, a Canvas lets you arrange widgets, charts, and text boxes however you want, resize them freely, and group related views together.
You can start from a pre-built template (designed by FinOps experts to cover common use cases like coverage analysis by product category) or create a blank Canvas and build your own. Global filters let you slice data across an entire Canvas and update every widget automatically.
Key capabilities:
- Infinite workspace — add as many widgets as you need, arranged however makes sense to you
- Rebuilt Clara AI, delivering key insights and analysis, resulting in unique and accurate views into your usage
- Global filters that apply across all widgets simultaneously
- Shared Canvases for team collaboration, or private ones for individual analysis
- Folder organization to keep everything structured as your library grows
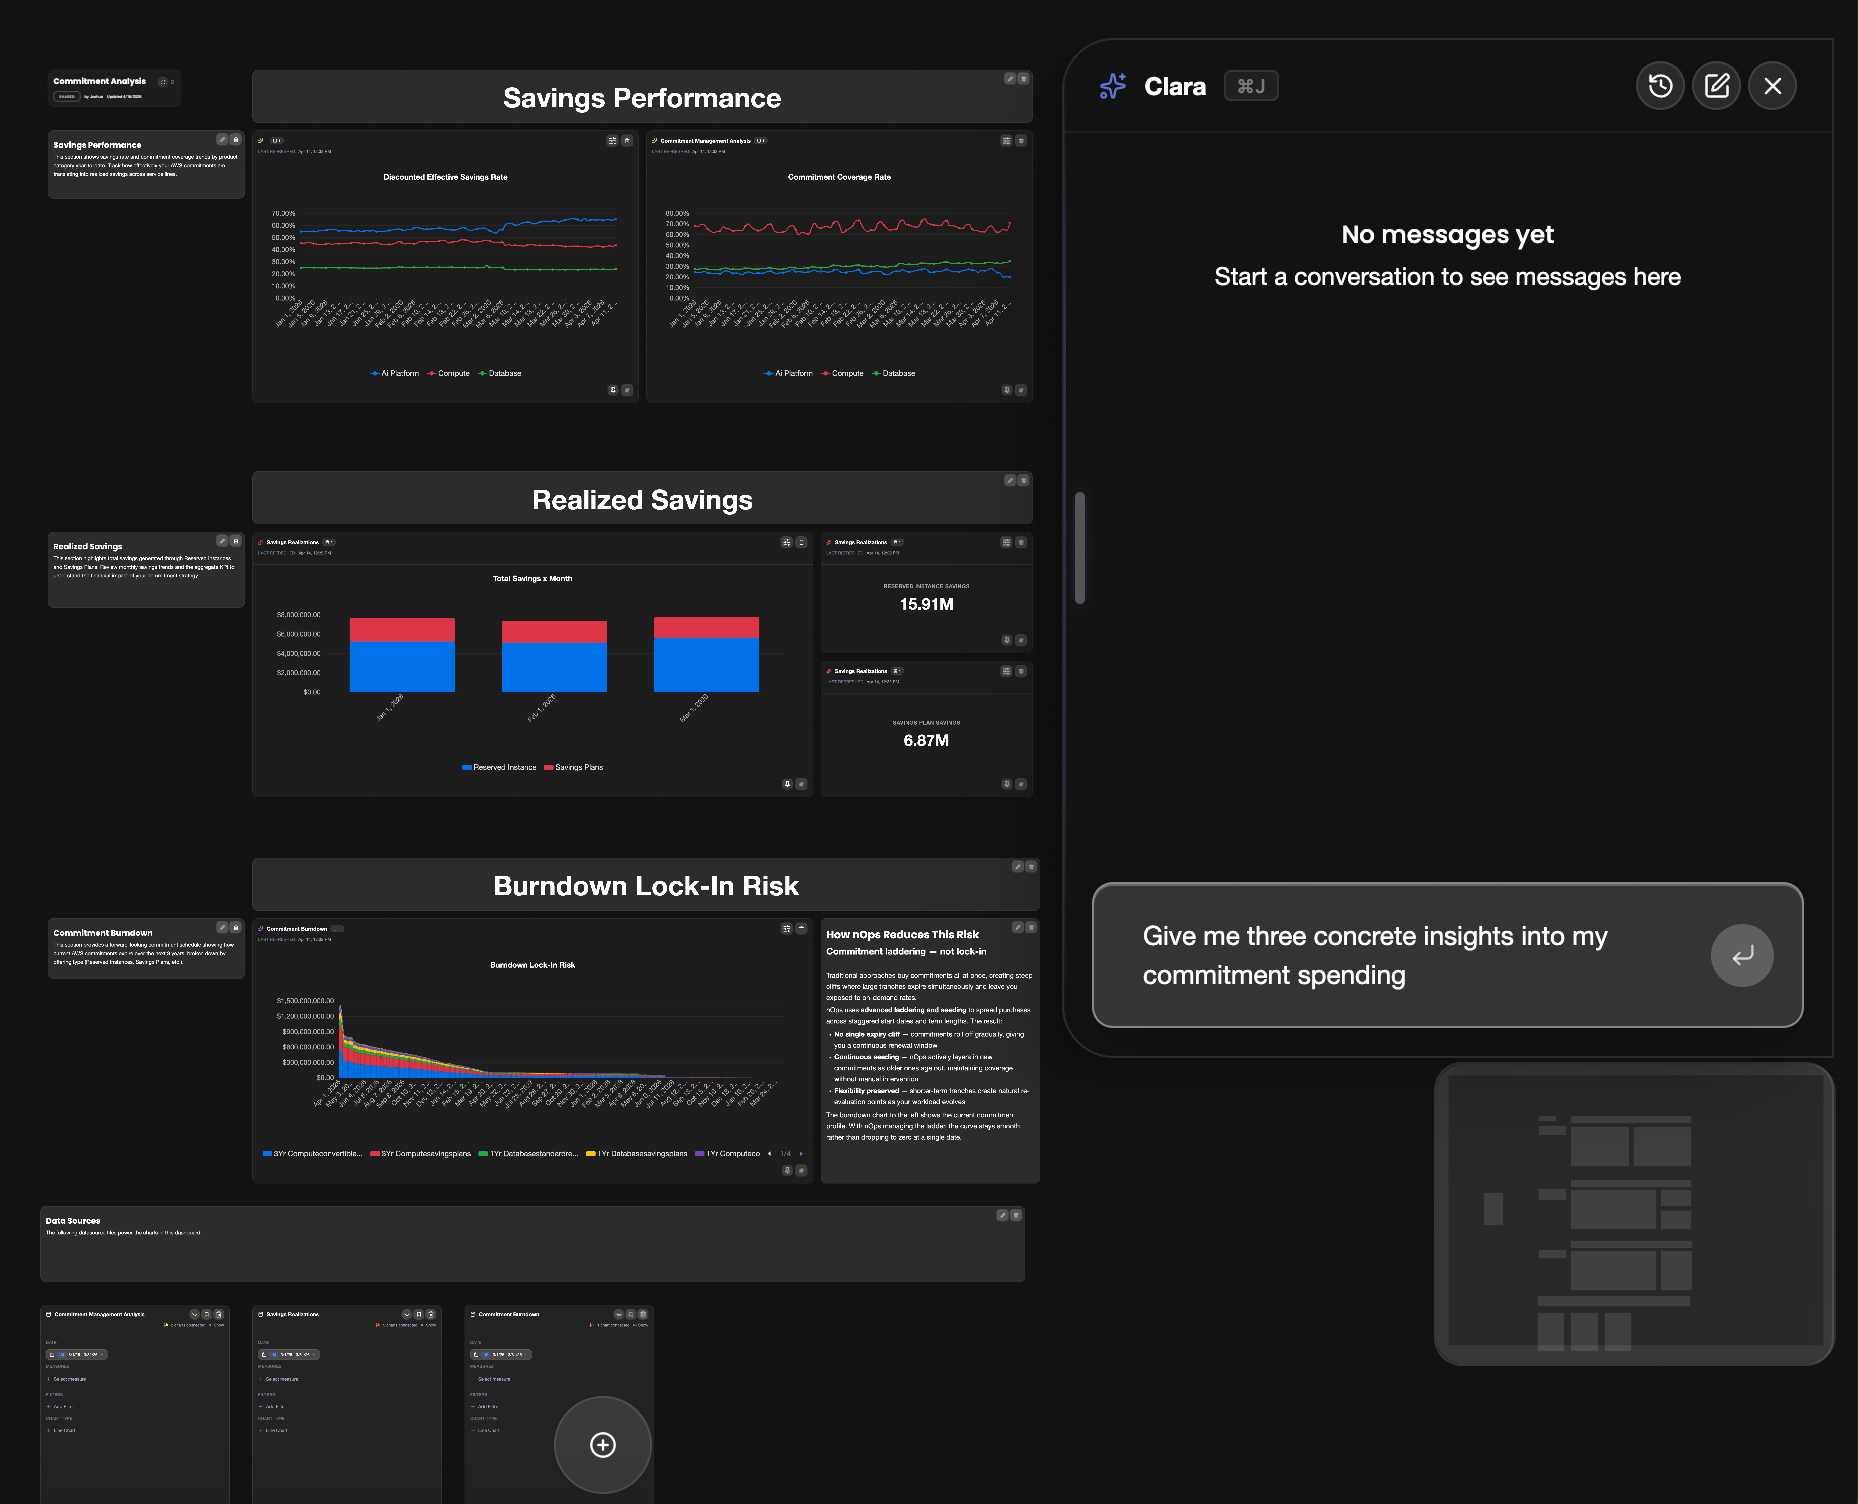
Clara — Your AI Agent trained to analyze complex Commitment Analysis data
Clara is the AI assistant built into every Canvas. Over the last four months, we have rebuilt Clara from the ground up, focusing on how AI agents interact with large data sources. But unlike typical AI analytics tools that rely on a large language model to write complex SQL queries (and hope the output is correct), Clara takes a fundamentally different approach.
Our data science team has pre-built verified functions— carefully crafted metric definitions and measures (things like discounted effective savings rate, utilization breakdowns and lock-in risk) that Clara can utilize directly, negating the need for complicated queries. Clara doesn’t need to guess how to calculate a FinOps KPI or navigate complex table structures. It calls a verified function and gets accurate data back every time.
Ask Clara to “show me my discounted effective savings rate month-to-date, split by product category,” and it will:
- Select the right data source automatically
- Run queries in parallel for faster results
- Generate charts and visualizations directly on your Canvas
- Chat with you in natural language about what this data actually means
Clara also has full Canvas control — it can add widgets, rearrange layouts, and run complex analyses on top of your data, while storing them within widgets.
What powers Clara under the hood: The entire AI infrastructure was rebuilt on Amazon Bedrock AgentCore, utilizing new achievements in Databrick’s Lakehouse and Lakebase, to create a new era of AI Agents interacting with your advanced business intelligence toolkit within the Clara Canvas.
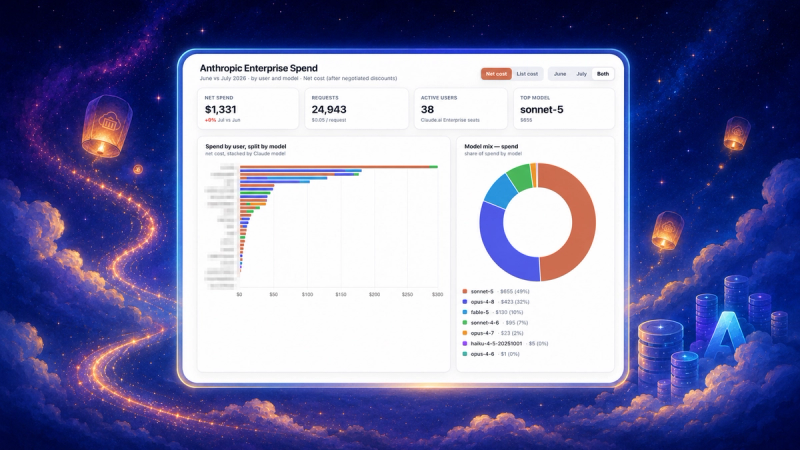
Multi-Cloud & Cross-Service Commitment Management
Your current accumulated spend over a defined period. Azure Cost Management surfaces this in cost analysis views, filterable by subscription, resource group, service, location, or meter category. The key metric: daily burn rate — your average cost per day over the trailing 7 or 30 days. A sudden jump in daily burn rate is often the first sign something changed.
Interactive Tour & Guided Onboarding
New to the platform? When you first enter the Playground, a guided modal helps you choose your starting point:
- Start with a template — pre-built Canvases covering common commitment scenarios
- Open a shared Canvas — jump into something a teammate has already built
- Create from scratch — blank Canvas, full freedom
- Take the interactive tour — a step-by-step walkthrough that teaches you to create widgets, use the mini-map, and chat with Clara
The tour is hands-on: it guides you through creating your first widget, navigating the Canvas, and running your first Clara analysis — all in under five minutes.
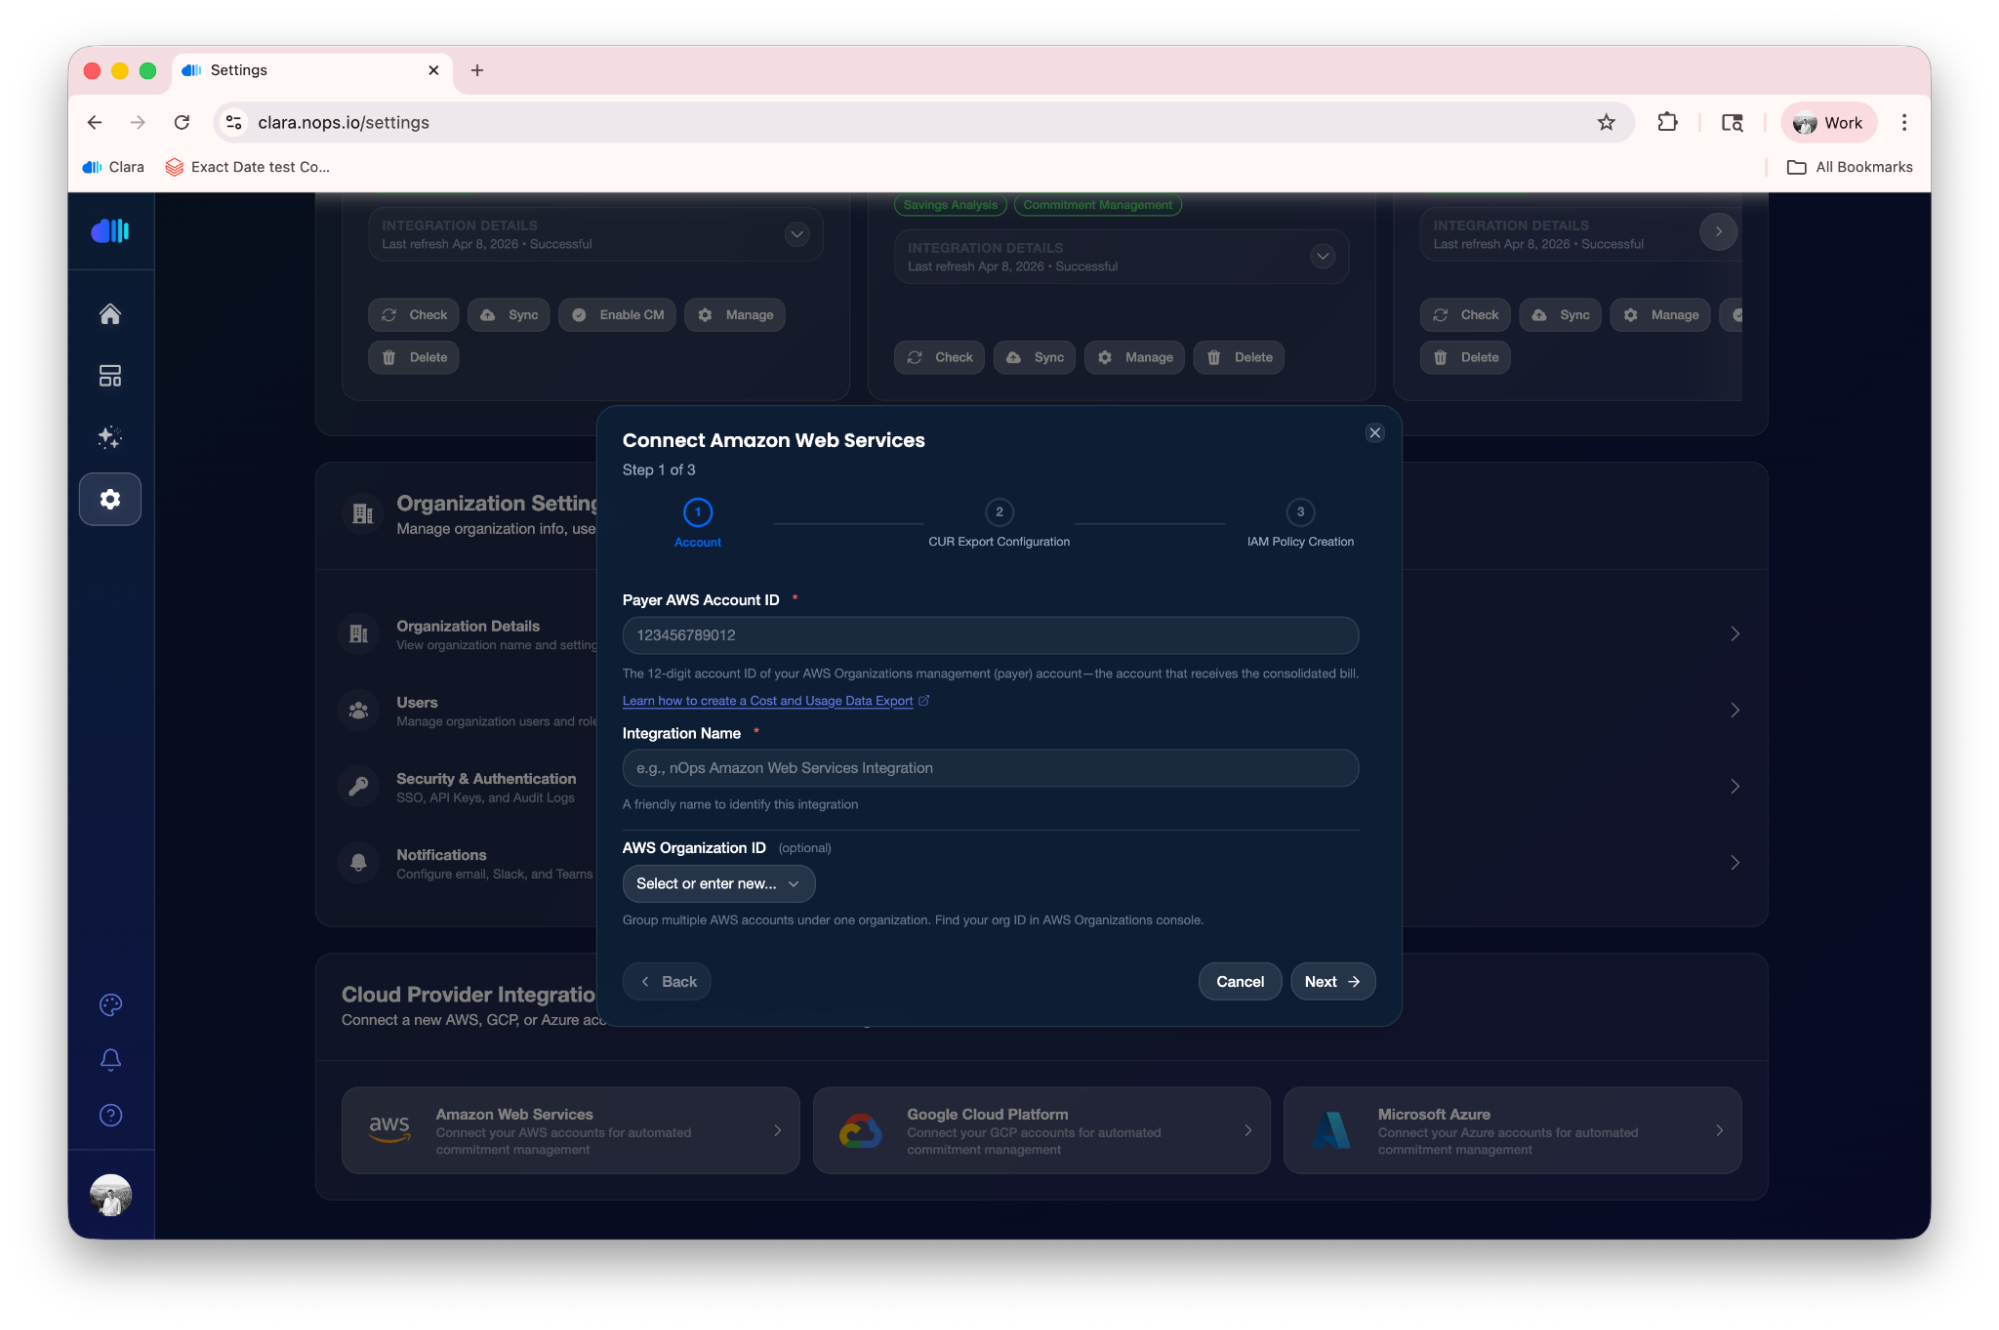
And if you like what you see, you can connect your cloud accounts with a quick guided onboarding and start analyzing your real commitment data. Built-in integrations and onboarding flows get you up and running in just a few minutes.
Budget vs. Actual
The gap between plan and reality. Track it per subscription or resource group. A persistent delta means either your forecasting is off or your workload patterns have changed. Both need attention.
Who Benefits Most
| FinOps Practitioners and Cloud Economists | Engineering and Platform Leaders | Finance and Procurement Teams |
|---|---|---|
| Get an interactive analytics workspace that goes beyond static dashboards. Use Clara to quickly interrogate commitment coverage, identify gaps, and generate reports — without writing SQL or building custom queries. The FinOps template library gives you a head start on the analyses you run most often. | Evaluate whether nOps handles the complexity of your environment — multi-cloud, multi-account, mixed commitment types — before committing to anything. The Playground uses realistic demo data so you can pressure-test the platform against real scenarios like layering strategies or coverage optimization across compute, database, and AI workloads. | See exactly how commitment utilization, savings rates, and coverage gaps surface in the platform. The visual Canvas format makes it easy to build views tailored for executive reviews or monthly cost optimization check-ins — and Clara can generate the narrative analysis to go with the data. |
How It Works
- Visit nops.io and click the Playground button
- Sign in using Google, Microsoft, GitHub, or a Magic Link — no lengthy onboarding process
- Choose your starting point — template, blank Canvas, or the interactive tour
- Explore freely — all demo data is pre-loaded. Create widgets, ask Clara questions, build Canvases, and test global filters
- When you’re ready, switch to your real cloud account from within the Playground to start onboarding your actual data
The Playground is always available. Come back anytime to test new features or train team members.
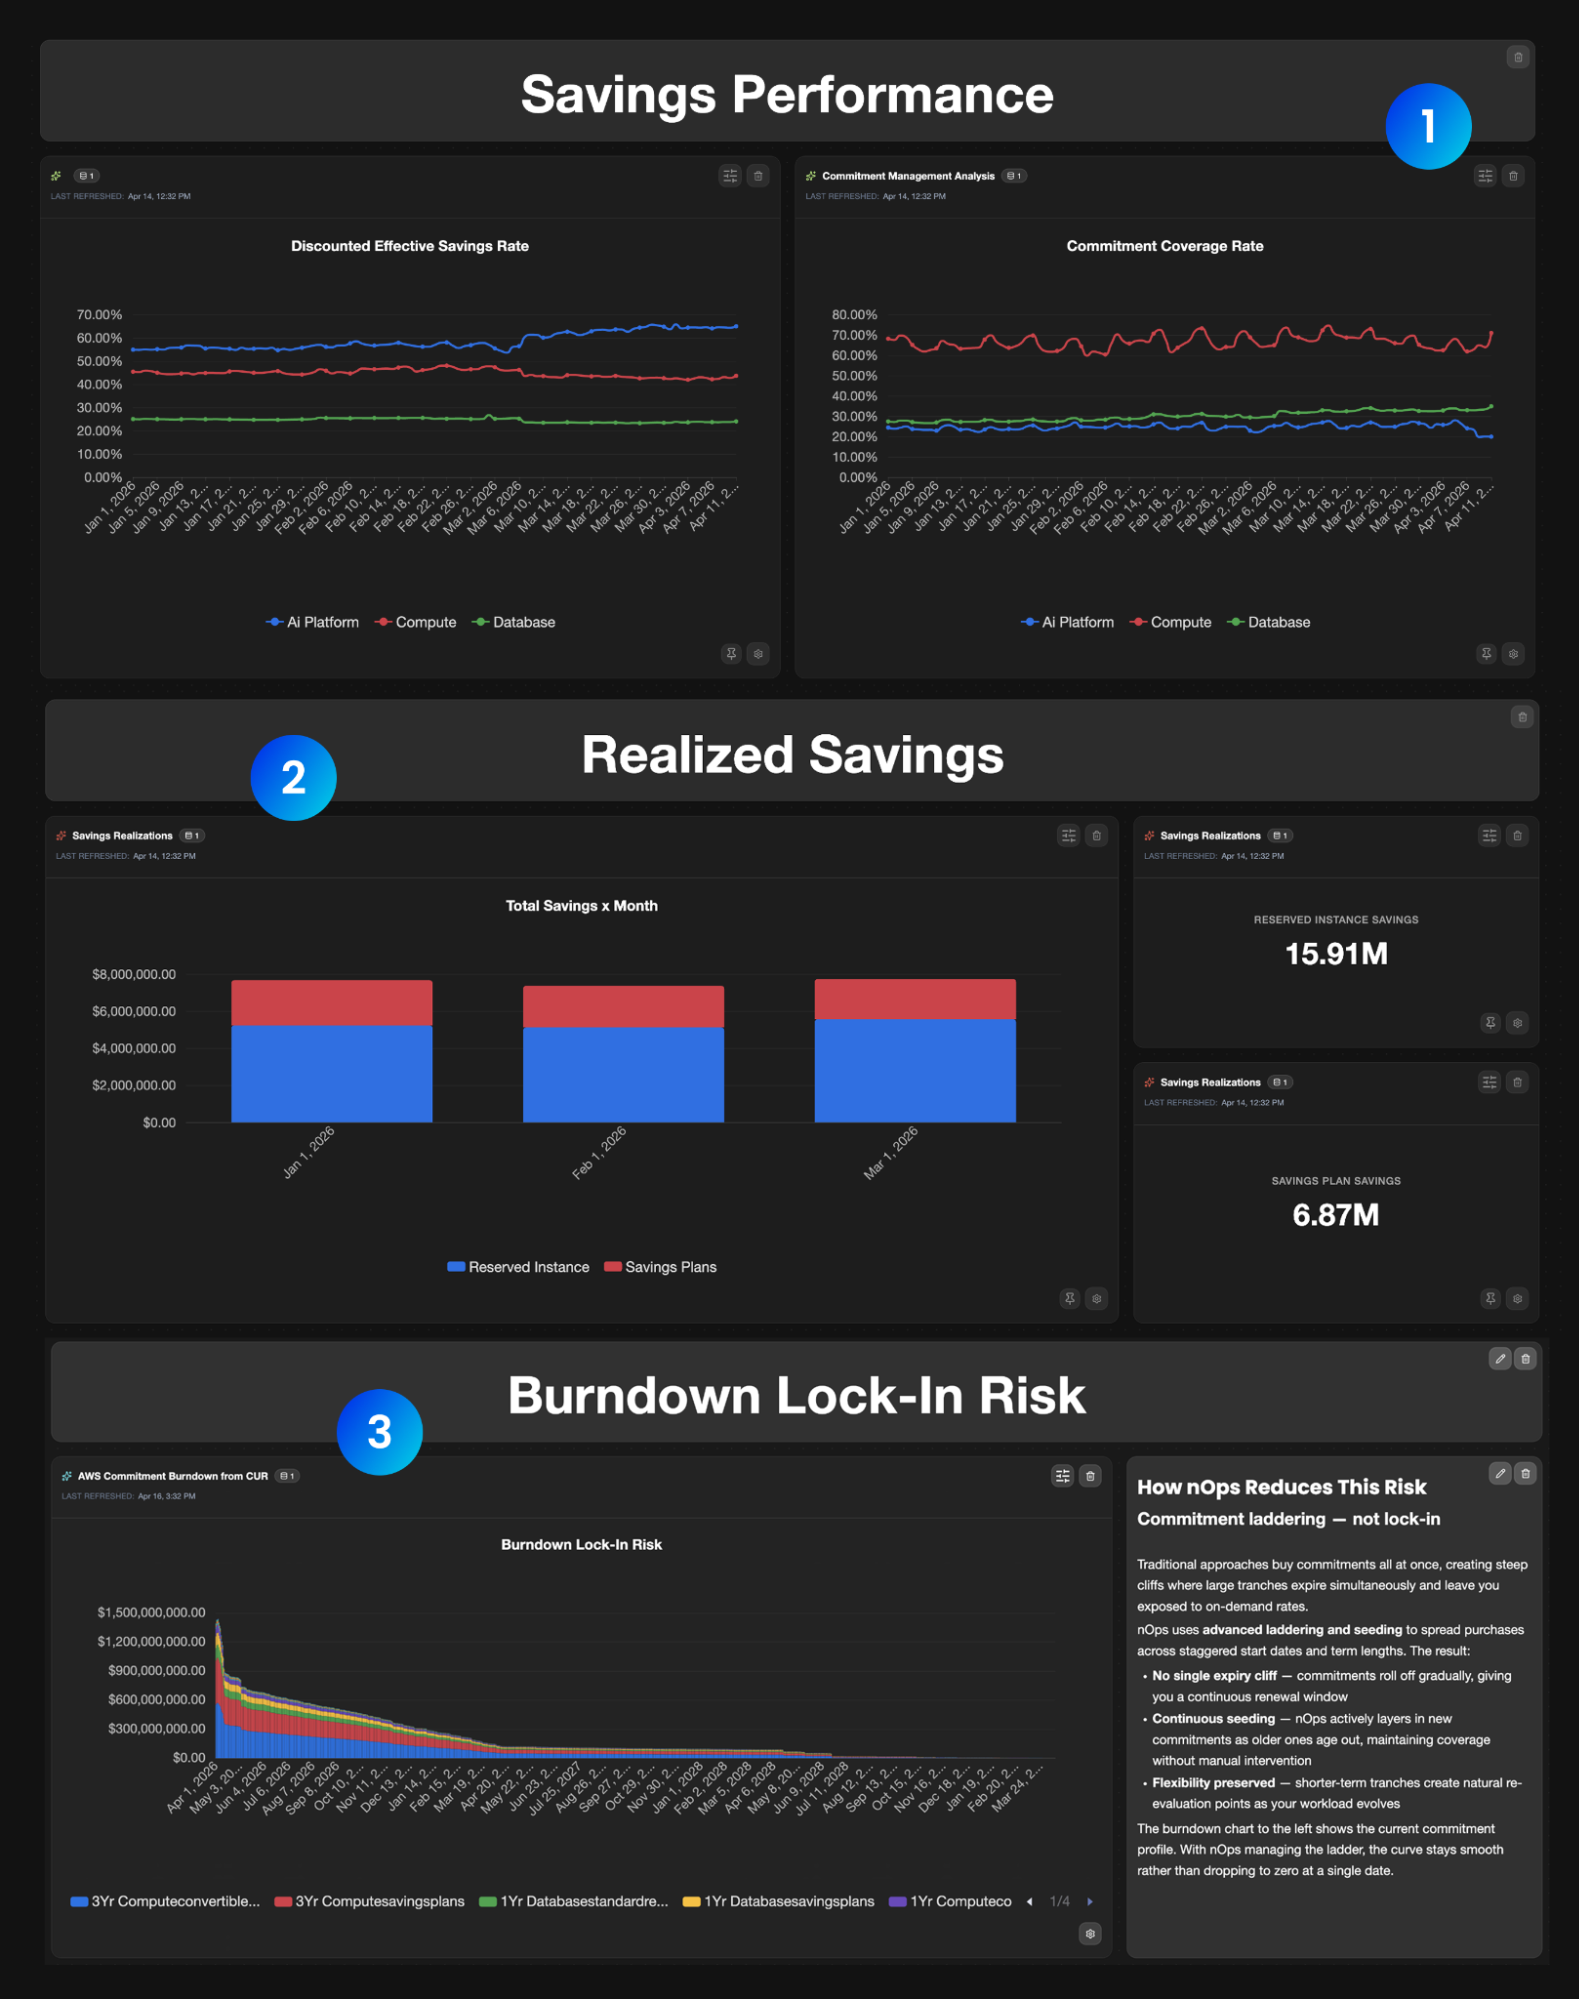
- Savings Performance: This section shows savings rate and commitment coverage trends by product category year-to-date. Track how effectively your AWS commitments are translating into realized savings across service lines.
- Realized Savings: This section highlights total savings generated through Reserved Instances and Savings Plans. Review monthly savings trends and the aggregate KPI to understand the financial impact of your commitment strategy.
- Commitment Burndown: This section provides a forward-looking commitment schedule showing how current AWS commitments expire over the next 3 years, broken down by offering type (Reserved Instances, Savings Plans, etc.).
How to Get Started
If you’re already on nOps…
Have questions about the new platform experience? Need help migrating to the new Canvases? Our dedicated support team is here for you. Simply reach out to your Customer Success Manager or visit our Help Center. If you’re not sure who your CSM is, send our Support Team a message.
If you’re new to nOps…
nOps was recently ranked #1 with five stars in G2’s cloud cost management category, and we optimize $4+ billion in cloud spend for our customers.
Join our customers using nOps to understand your cloud costs and leverage automation with complete confidence by booking a free savings analysis with one of our AWS experts.