Allocate Every Dollar
100% of Bedrock and AI spend mapped to a product, team or environment. No black box, no orphan costs.
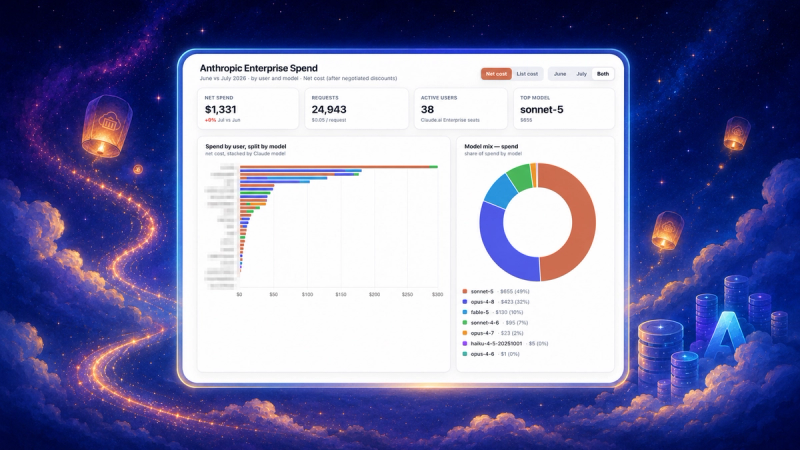
Map AI costs — from Bedrock models to developer agents and external platforms — to the product, team or environment behind them, down to the hour. Track developer AI spend through nOps to attribute costs from Cursor, Claude Code and OpenAI Codex to the teams and projects that generate them.
Catch AI cost spikes as they happen — not days later when the invoice lands. Hourly comparison flags structural anomalies and sudden model cost changes the same hour they occur.
Turn visibility into action — nOps surfaces token efficiency opportunities, model substitution candidates and cache tuning recommendations alongside your spend data.
nOps manages $4B+ in annual cloud spend for innovative brands, from startups to enterprises, saving them 50%+ autonomously.


100% of Bedrock and AI spend mapped to a product, team or environment. No black box, no orphan costs.
Hourly comparison vs the prior week flags anything 3× over its same-hour baseline, plus structural anomalies — automatically.
Virtual tag rules allocate costs that AWS never tagged — condition-based, priority-ordered, with an unallocated bucket showing exactly what’s left.
Attribute developer AI spend from Cursor, Claude Code and OpenAI Codex to the teams and projects that generated it — no tagging changes required.
Turn visibility into action — model substitution candidates, cache tuning opportunities and provisioned throughput candidates surfaced alongside your spend.
Delivered through nOps Inform and exposed to every leading AI harness — query your spend from the tools you already use.
See where every AI dollar is going in minutes — no agent and no changes to your applications.
Connect Your Billing Data
nOps Inform reads your AWS Cost & Usage Report — no agent, no SDK, no code change. Bedrock and Claude line items are picked up automatically.
Visibility & Attribution
Get hourly spend mapped to model, account, department and token type, with this-week-vs-last-week context and automatic spike detection.
Define Your Allocation Rules
Build virtual tag rules in a point-and-click UI — match costs by service, account, region or any existing tag value and assign a team, product or cost category. An unallocated bucket shows exactly what still needs a rule. No code, no AWS tagging changes.
Allocate & Monitor Continuously
Keep 100% of spend allocated with week-over-week tracking and real-time anomaly alerts. Act on AI optimization recommendations — model substitution, cache tuning and throughput candidates — surfaced alongside your spend. Queryable from nOps Inform or any leading AI harness.
See why leading teams choose nOps to allocate, attribute and control their AI spend.
| Capability | nOps | Traditional Cost Tools |
|---|---|---|
| Hourly cost granularity | Yes | Daily or monthly only |
| Spend allocated by model | Yes | Service-level only |
| Department / product attribution | Fully mapped | Manual tagging required |
| Token-level cost breakdown | Input / output / cache | Not available |
| Cache-write cost visibility | Yes | Hidden in blended totals |
| Real-time anomaly detection | Automated, same-hour alerts | After the invoice lands |
| Structural anomaly detection | Overnight / wrong-account / new model | None |
| Customer-facing vs internal split | Derived | Not possible |
| 100% of spend allocated | Guaranteed | Large 'unassigned' bucket |
| Multi-account, multi-model | Unified | Siloed views |
| Works with your AI harnesses | Native (nOps Inform) | Dashboard-only |
| Developer tool attribution | Native via Bedrock BYOK | Not available |
| AI cost optimization recommendations | Model substitution, cache tuning, throughput | Not available |
| Setup effort | Connect CUR — no agent | Tagging projects & manual mapping |
| Custom allocation rules (no AWS tagging needed) | Built-in virtual tag rule builder | Requires manual AWS tag changes or scripting |
| Named views with custom filter & breakdown logic | Unlimited user-defined views | Fixed reports only |
Cost granularity, not daily averages
Of AI spend allocated to a team or product
Anomalies caught the hour they happen
Queryable wherever your teams work
nOps Inform reads your AWS Cost & Usage Report and resolves each Bedrock / Claude line item down to the hour, then maps it to a model, AWS account and the department or product that owns it. The result is a full attribution chain — hour → account → model → department — with 100% of spend allocated and nothing left in an "unassigned" bucket.
All Claude models on Bedrock — Opus, Sonnet and Haiku across versions — plus native Amazon Bedrock usage such as Nova tokens, Titan embeddings and Guardrails. Native Bedrock infrastructure is shown separately and never blended into model-inference totals. New model versions are picked up automatically and flagged the first time they appear.
Hourly. Hourly granularity surfaces overnight bursts and intra-day spikes that daily or monthly averages mask entirely — the level you need for real anomaly detection.
Through a department mapping that pairs AWS accounts and models with the product or team behind them — for example, Opus spend to Sales, Sonnet 4.5 to one platform and Sonnet 4.6 to another, regardless of which account they appear in. The same mapping is applied consistently to both cost and token views.
A pattern that is suspicious regardless of dollar size — such as a sales workload running between midnight and dawn, a model showing up in an account where it shouldn't, or a brand-new model version appearing for the first time. nOps flags these alongside cost spikes.
For each hour in the current week, nOps compares cost against the average of the same hour across the prior week. A spike is flagged when an hour runs several times over its same-hour baseline and clears a minimum dollar floor, plus any single hour above a high-water threshold — each tied to the model, account and department that caused it.
Yes. Spend is split into input, output, cache-read and cache-write tokens under the same department mapping as the cost view, so you can see not just how many tokens you burned but which kind drove the bill.
Cache writes are usually a small share of token volume but a large share of cost, while cache reads are the opposite — high volume, low cost. Showing tokens and cost side by side makes that divergence visible and points to opportunities to tune cache TTL and reuse.
Yes — this is one of the most common use cases. If your CUR data includes Bedrock cost allocation tags (session tags, model tags or custom resource tags) that identify which customer or feature drove a call, nOps reads them directly and a named view can group by that dimension immediately. If your spend isn't tagged at that level, virtual tag rules let you derive the same breakdown using account, service, region or any tag combination — without touching your application code. The result is a per-customer COGS view and a per-feature view that you can compare against revenue or usage data to understand which parts of your AI product are profitable and which aren't.
Yes, for spend that flows through AWS Bedrock or appears in your AWS Cost & Usage Report. Tools like Cursor support bring-your-own-key configurations that route model calls through your own Bedrock account — those costs appear in your CUR exactly like any other Bedrock inference and are attributed automatically. For AI API spend that lands outside AWS (direct Anthropic or OpenAI billing), that won't appear in the CUR; you would track it through those providers' billing exports separately.
Virtual tag rules let you assign a cost category — team, product, environment or any label — to any cost row that matches conditions you define in the nOps UI. Each rule tests a combination of service, AWS account, region or existing tag values. Rules are evaluated in priority order: the first rule whose conditions all match wins, and the assigned tag value is applied to that row. A catch-all rule (no conditions) placed last captures anything not yet matched. An unallocated bucket always shows what hasn't been covered, so Allocated + Unallocated always equals your total spend — there's no hidden remainder.
Named views are saved lenses on your AI cost data — each with its own filter rules and breakdown dimension. For example, an "AI Platform" view filters to Bedrock spend and groups by feature tag, while a "Customer-Facing AI" view filters to production accounts only and groups by product. Views appear as tabs on the reporting page so you can switch between them without rebuilding a query. Every view shows its own daily trend, breakdown chart and unallocated bucket with the same reconciliation guarantee.
No. Allocation is built entirely from your AWS Cost & Usage Report. There is nothing to install in your application and no SDK to integrate.
The AWS CUR typically lands one to two days behind, so the most recent calendar day of the current window is usually partial. nOps states this clearly so week-over-week numbers aren't misread.
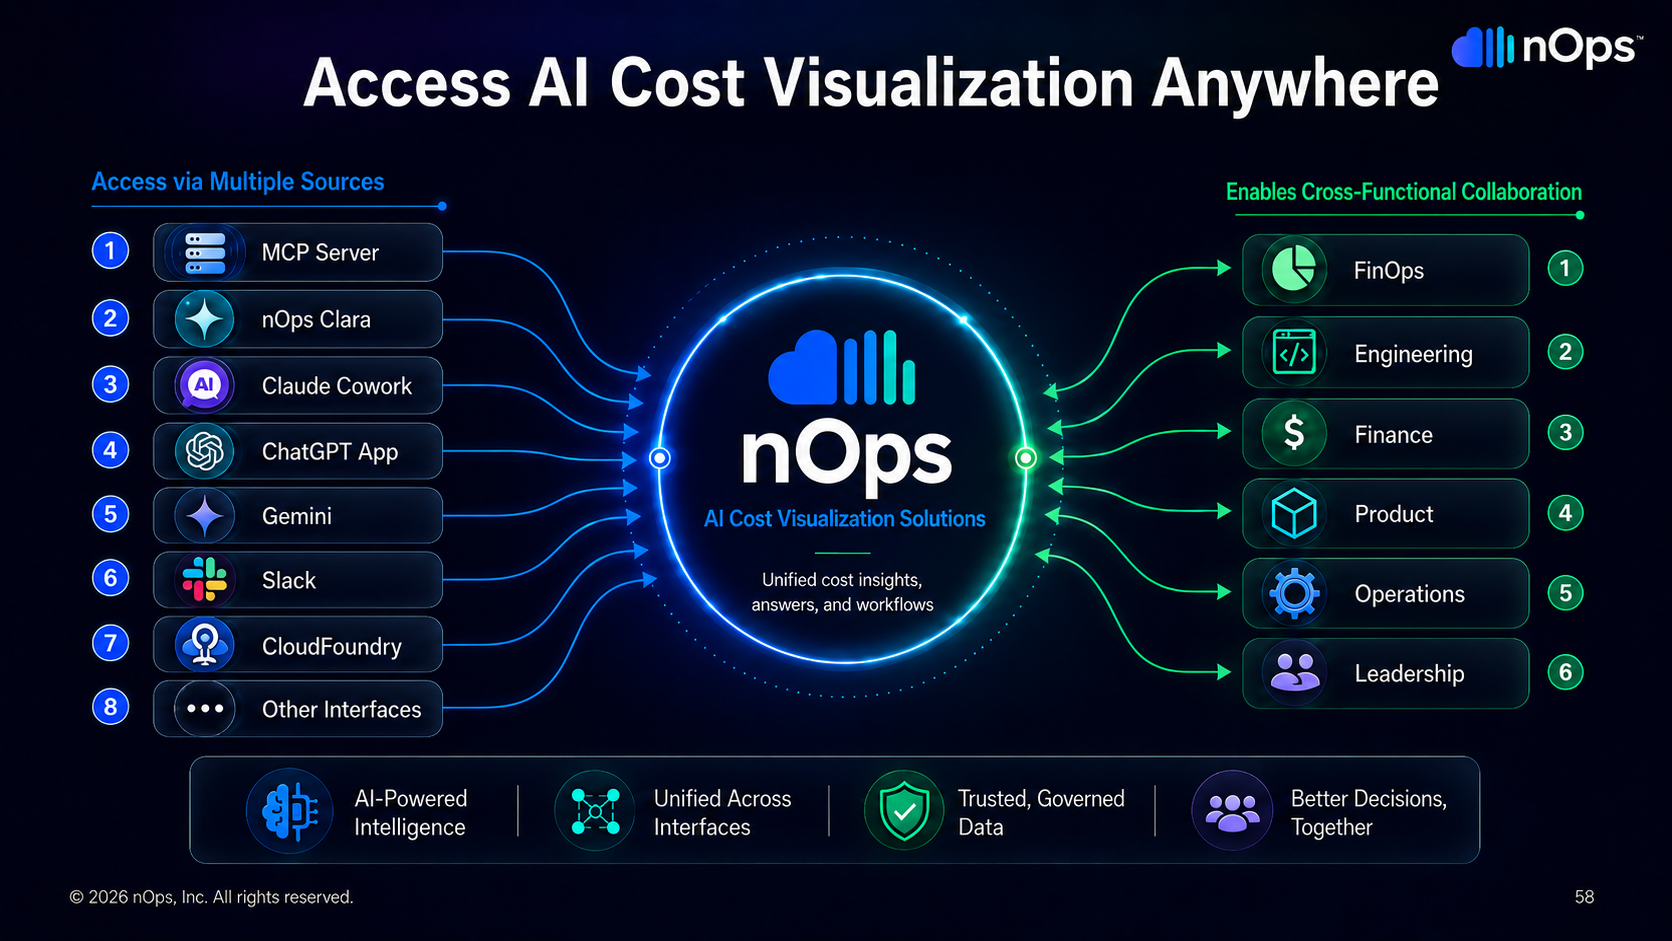
The feature is fully available in the nOps Inform platform and exposed to all leading AI harnesses, so your teams can request allocation, anomalies or token breakdowns from the assistants and copilots they already use — returning the same data and the same department mapping as the dashboard.
Yes. Spend across every connected account and model is unified into one view, with the mapping resolving each account to its owning team or product.
It is included in the analysis automatically, assigned to its account's department, and flagged explicitly as new — version migrations can change the per-call price significantly, so nOps calls out the shift rather than silently absorbing it.
Allocation is derived from billing and usage metering in the CUR — model names, accounts, token counts and cost — not from prompt or response content.
Yes. nOps Inform complements your existing cost tooling and adds the model-, department- and token-level allocation those tools typically can't produce.
Achieve a 55% effective savings rate with nOps.
Book a free savings analysis to:
Customers who switch to nOps save 20% more on average versus competitors.


“Partnering with nOps made it easy and seamless to optimize our AWS costs. The platform's automated cost optimization and commitment management reduced our AWS spend significantly, allowing us the time to focus on building and innovating. The flexibility nOps offers means we can stay agile and efficient without the risk of long-term commitments.”

Matt Morgan
Head of Engineering & Product, US, CommentSold
“nOps has transformed how we manage our AWS infrastructure. We considered several solutions, including another Reserved Instance solution, and then decided to work with nOps because it was a more complete solution. It gave us automated commitment management and an effortless way to track and monitor our costs with Business Contexts. We have seen a significant reduction in costs and highly recommend nOps to any organization looking to optimize their cloud costs and improve operational efficiency.”

Herman Lotter
Technology Operations Manager, Kurtosys

“As a FinOps lead at Arlo, I view cost transparency as non-negotiable, and nOps has delivered exactly that. The platform gave us end-to-end visibility into our cloud spend, eliminating guesswork and surfacing the true cost drivers across our environment. What stands out is how quickly the insights translate into action. nOps doesn’t just present data, it highlights the specific optimizations, anomalies, and inefficiencies we can address immediately. Those recommendations have driven real cost reductions for us while strengthening accountability across engineering teams.”

Alex Kuan
FinOps Lead, Arlo
“nOps provided the visibility and control we needed to optimize our AWS costs without long-term commitments. I highly recommend nOps for cloud optimization and managing cloud costs effectively.”

Andy Kwan
Senior Director of Infrastructure, BENlabs

“nOps has been invaluable in helping manage the intricacies of optimizing AWS environments and costs in today’s dynamic environment. The nOps Commitment Manager program provides us with the agility to progress and innovate, without the typical constraints associated with long-term commitments. The platform also gives us a clear and transparent picture of our costs, so we can plan and rightsize our resources accordingly.”

Khaled BEN JANNET
Datacenter & Cloud Team Leader, Vermeg
Schedule a demo with our AWS experts to see how to optimize your AWS cloud
Advanced technology partner AWS, G2 4.8 rating, FinOps Foundation member and many more