
6 AWS Spot Facts That Might Surprise You
As organizations increasingly turn to AWS Spot instances to save on cloud costs, it’s common knowledge that AWS says:
- 95% of Spot instances won’t be interrupted.
- You have 2-minute advance warning of termination.
But is that as straightforward as it sounds? nOps processes $1 billion in cloud spend, meaning that we have extensive historical data about Spot usage and terminations — and we’ve discovered some surprising Spot insights.
What is AWS Spot?
AWS Spot Instances are spare AWS capacity that users can purchase at a heavy discount. It allows AWS to monetize idle time in their data center by offering it on the Spot market.
Why can Spot be challenging to use? The TL;DR is that AWS gives you a discount on the instance, but not a guarantee that you’ll be able to use it to the end of your compute need.
When a user willing to pay the full On-Demand price emerges, AWS can terminate these instances with a two-minute warning (known as a Spot Instance Interruption). These unexpected interruptions can cause workloads to fail, potentially posing a major problem for production or mission-critical applications. That’s why many companies avoid using it despite the significant potential cost savings.
In this blog post, we’ll share 6 little-known facts about Spot reliability and savings.
#1: Spot is a lot more reliable than commonly believed
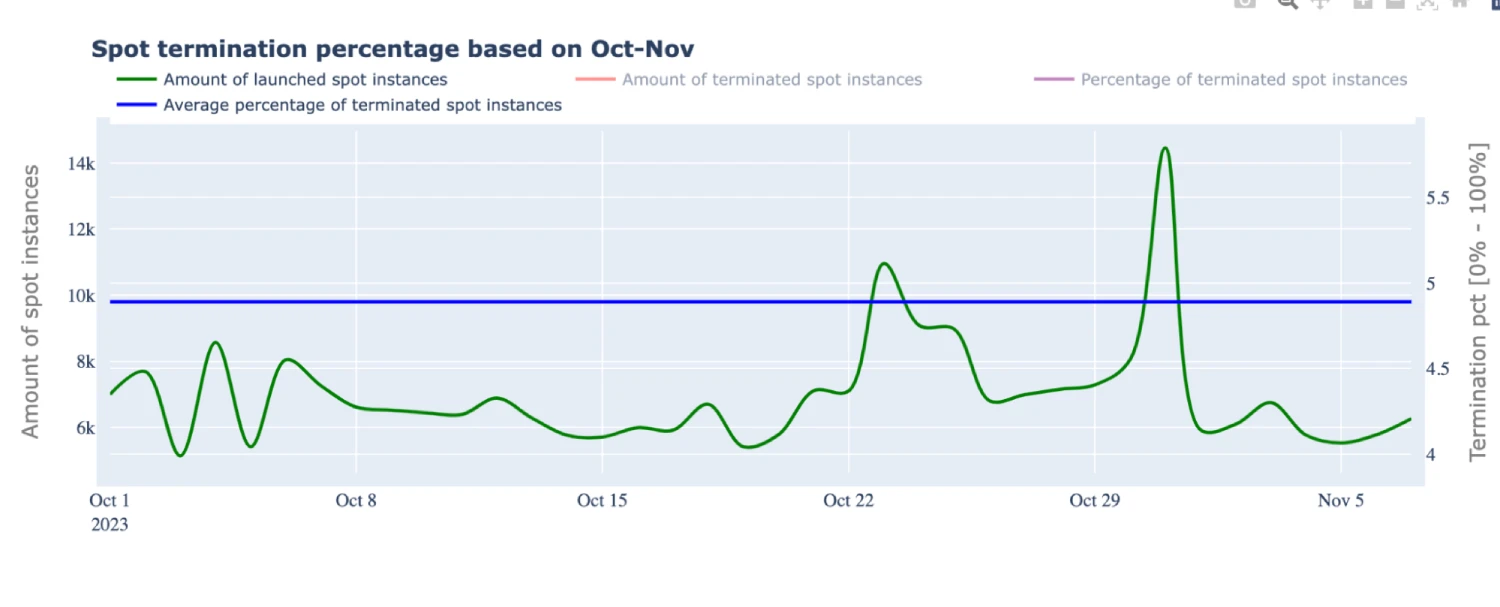
Most of the organizations we’ve talked to believe Spot terminates at an alarmingly higher rate than it actually does (50% of the time!?) — but the reality is that less than 5% of Spot instances are terminated in any given month.
Here is a graph that shows real historical data charting the likelihood of Spot instance termination.
#2: Spot instances generally live longer than users ask them to
Let’s take a look at the typical lifetime of (1) a Spot instance that lived its life through and was terminated gracefully by a user, compared with (2) a Spot instance that was terminated by AWS.
Who terminated | Mean Lifetime |
|---|---|
Gracefully Terminated | 0:47:44 |
Termination by AWS | 3:48:31 |
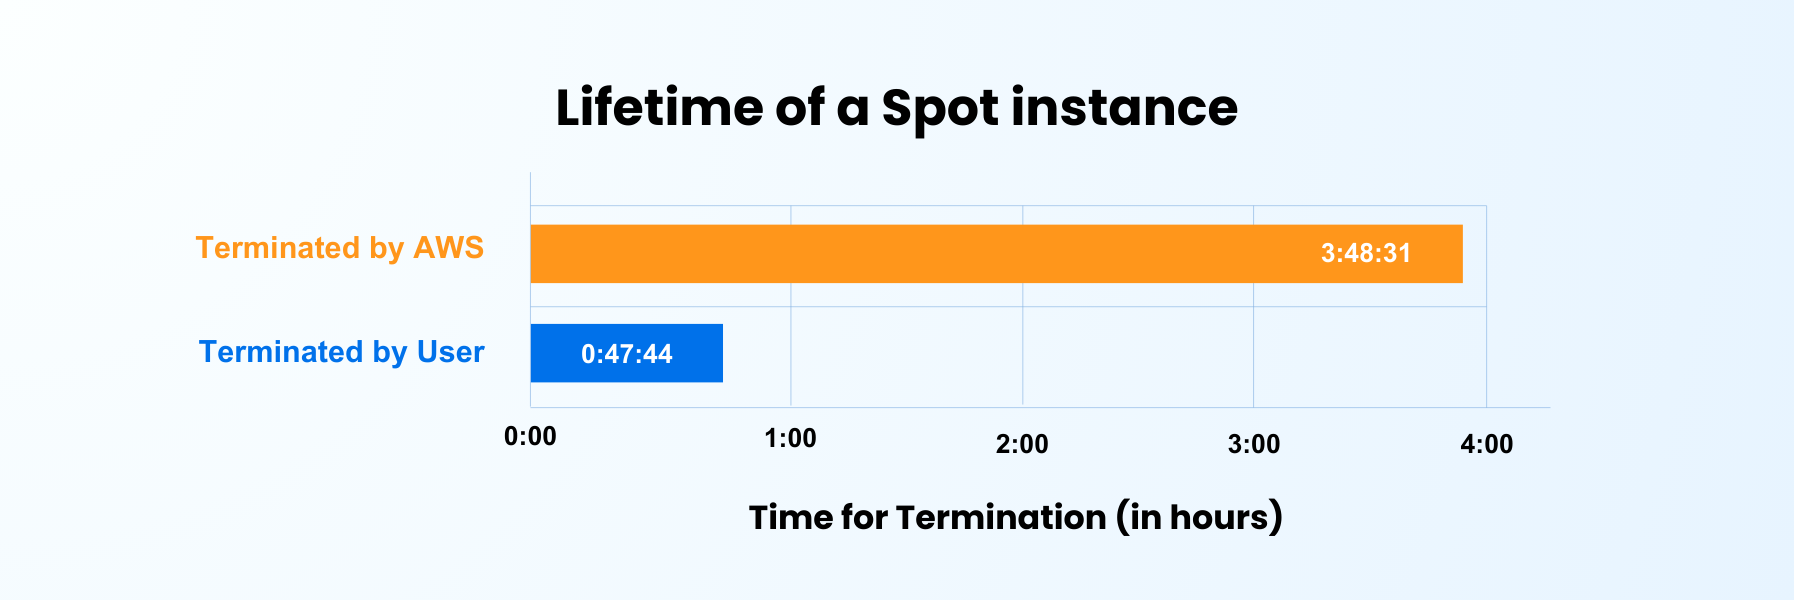
Most users who gracefully terminated their Spot usage ran on the instance for over 45 minutes. And on average, it takes almost 4 hours before AWS will terminate your Spot instance.
A few high-level inferences we can make from this is that if you want to have more confidence that your Spot instance won’t be terminated by AWS, you’ll need to run it for less than an hour. And additionally, the longer you run on a Spot instance, the higher the chance that you will be terminated.
#3: Some Spot instances show surprising longevity
Our data shows that the average Spot instance lives for around 4 hours. However, there also exist some digital Methuselahs among them. Although some Spot instances that where shutdown by the user lived up to 257 days, there were Spot instances there were terminated at 351 days 18 hours and 11 minutes of lifetime.
Some extraordinarily stable Spot instances have lived for almost a year!
#4: Spot instances lifetimes vary hugely from region to region
Let’s look at some instances across the United StatesS
Region | Who terminated | Mean Lifetime |
us-west-2 | User Shutdown | 0h 34m 44s |
us-west-2 | Spot Instance Termination Event | 3h 53m 20s |
us-west-1 | User Shutdown | 0h 50m 31s |
us-west-1 | Spot Instance Termination Event | 10h 46m 30s |
us-east-2 | User Shutdown | 1h 11m 56s |
us-east-2 | Spot Instance Termination Event | 21h 53m 19s |
us-east-1 | User Shutdown | 1h 02m 26s |
us-east-1 | Spot Instance Termination Event | 3h 07m 51s |
A couple of observations:
- For the us-west-2 region, we have figures that are very similar to those in the previous table (all Spot instances). The fact that they resemble the typical instance means that they are likely the most prevalent in terms of volume.
- For the us-west-1 region, we see a significant difference from the average. Severed terminations are at 10 hours and 46 minutes, three times higher than the average or us-west-2. If you’re looking for reliability, the hard data indicates that you should choose us-west-2 over us-west-1.
Related Content
The Ultimate Guide to Karpenter
Maximizing efficiency, stability, and cost savings in Kubernetes clusters
Download Now
#5: It’s typically misleading to say “Spot is 95% reliable”
AWS says that Spot instances have 95% reliability — meaning that in theory, only 5% of uses of Spot will face termination issues.
We’ve already shown that the actual average is in fact lower than 5%. Now, let’s compare by region.
Region | Observed Instances | Terminated Instances | Termination rate |
|---|---|---|---|
us-west-2 | 3,879,849 | 158,159 | 4.08% |
us-west-1 | 36,620 | 175 | 0.48% |
us-east-2 | 225,321 | 2,465 | 1.09% |
us-east-1 | 2,442,402 | 243,108 | 9.95% |
The above table shows how summarized numbers can be deceiving, as we have wildly different Spot instance behaviors, lifetimes and termination rates depending on region. For comparison, us-east-1 is only 90% reliable, whereas us-west-2 is 99% reliable.
#6: Spot reliability varies greatly by instance type
As you break down Spot instance averages from all instances to region types, you see much less dispersed variation in this population. The same holds true when you drill down by instance type, availability zone — not to mention other parameters such as day of the week, month, etc.
Instance Type | Observed Instances | Terminated Instances | Percentage |
i3.4xlarge | 82,522 | 9,451 | 11.45% |
i3.xlarge | 164,971 | 14,186 | 8.6% |
m5.2xlarge | 56,611 | 16,717 | 29.53%< |
m5.4xlarge | 69,338 | 7,353 | 10.6% |
m5.large | 75,931 | 9,768 | 12.86% |
m5.xlarge | 292,221 | 41,074 | 14.06% |
m5n.xlarge | 318,505 | 9,482 | 2.98% |
m6a.xlarge | 48,560 | 8,289 | 17.07% |
r5.2xlarge | 162,034 | 11,759 | 7.26% |
r5.4xlarge | 115,541 | 12,488 | 10.81% |
r5.8xlarge | 177,695 | 9,168 | 5.16% |
r5.xlarge | 1,098,040 | 55,123 | 5.02% |
r6i.2xlarge | 22,763 | 7,146 | 31.39% |
r6i.xlarge | 103,294 | 11,013 | 10.66% |
As you can see, if you’re running a r6i.2xlarge, it’s nowhere near 95% reliable – it’s only 79% reliable on average.
As you can see, improving the detail of your Spot lifetime termination data, significantly improves the precision and reliability of your termination prediction — even without a time series, advanced analytics, Machine Learning, or other advanced techniques that can be used to improve results further.
Why everyone wants to (but usually can’t) predict Spot terminations
In an ideal world, you would be able to benefit from Spot discounts with certainty that a workload will not fail, stop or be interrupted. Achieving this depends on accurately predicting when Spot terminations will occur. Knowing about terminations in advance allows users to gracefully shift their workloads to other instances, avoiding disruption.
The challenge in perfecting this prediction lies in the scarcity of detailed historical data on Spot usage. Amazon does release some data about Spot availability trends, offering insights into the expected market conditions in the short term, such as the next hour or few hours. However, these data points are far too limited to conduct a classical data science analysis. Many academic and scientific papers have been written about the difficulty of predicting Spot terminations, yet come with a huge asterisk acknowledging a lack of available historical data with sufficient variation and time.
Because nOps processes $1 billion in cloud spend, we are one of the few sources with access to sufficient relevant historical data to answer this question.
nOps uses proprietary ML to analyze massive amounts of Spot market and historical data for instance families, given region, instance type, availability zone, and many other factors. As a result, we can accurately predict Spot terminations far in advance of the 2-minute warning provided by AWS.
Why nOps?
If you’re looking to save on cloud costs, pricing is typically the biggest lever. nOps helps you save 50-60% automatically, with 5-minute setup, Spot compatibility, and no infrastructure changes required.
Maximize savings. nOps continuously layers commitments in small hourly increments to capture 55%+ savings while minimizing overcommitment risk — even for dynamic workloads
Results-based pricing model: Customers typically save ~20% more by switching to nOps — and you pay only when you get better results.
Free Savings Analysis: Quantify exactly how much more you can save for no work on your part. We optimize, and you get the credit.
You can book a free savings analysis to find out how nOps can help you start saving today!
nOps processes over $4 billion in cloud spend and was recently named #1 in G2's cloud cost management category.