 Skip to content


- Blog
- Cost Allocation & Reporting
- How to Analyze Cloud Cost Using AWS Cost Explorer
How to Analyze Cloud Cost Using AWS Cost Explorer
Managing AWS cloud costs starts with understanding what you’re spending and why. AWS Cost Explorer is the native tool every AWS customer has access to — and for many teams, it’s the first step toward financial accountability in the cloud. But as organizations scale past a handful of accounts and predictable workloads, Cost Explorer’s limitations become painfully clear.
This guide walks through how to use AWS Cost Explorer effectively, where it falls short, and when it makes sense to graduate to a platform that automates what Cost Explorer can only visualize.
What Is AWS Cost Explorer?
AWS Cost Explorer is a free cost visualization tool built into the AWS Billing and Cost Management console. It provides graphs, tables, and filters that let you analyze your AWS spending by service, account, region, tag, or any combination of dimensions.
Once enabled, Cost Explorer gives you access to:
- Historical cost data at monthly granularity going back up to 38 months
- Daily granularity for more recent data
- Hourly granularity for the past 14 days (with additional charges)
- Forecasting based on historical usage patterns
- Savings Plan and RI recommendations based on your usage
- Preconfigured reports for common views like monthly cost by service or by linked account
- Cost Comparison — a feature launched in May 2025 that automatically detects significant cost changes between months and surfaces key drivers
- Amazon Q integration — ask natural language questions about your costs directly in the console
Cost Explorer is included at no charge for basic usage. The API costs $0.01 per paginated request, and hourly granularity costs $0.01 per 1,000 usage records monthly.
How to Access and Set Up AWS Cost Explorer
Step 1: Enable Cost Explorer
Cost Explorer must be enabled before you can use it. Navigate to the AWS Billing and Cost Management console, then select Cost Explorer from the left navigation. If it’s your first time, click “Enable Cost Explorer.” Data takes approximately 24 hours to populate after enablement.
Step 2: Choose Your Time Granularity
Cost Explorer offers three granularity levels:
- Monthly — available for up to 38 months of history. Best for high-level trend analysis and year-over-year comparisons.
- Daily — available for the past 14 months. Best for identifying cost spikes and tracking daily patterns.
- Hourly — available for only the past 14 days, and only when enabled separately. Best for understanding peak usage windows and evaluating commitment coverage. Note: hourly granularity incurs charges ($0.00000033 per usage record daily).
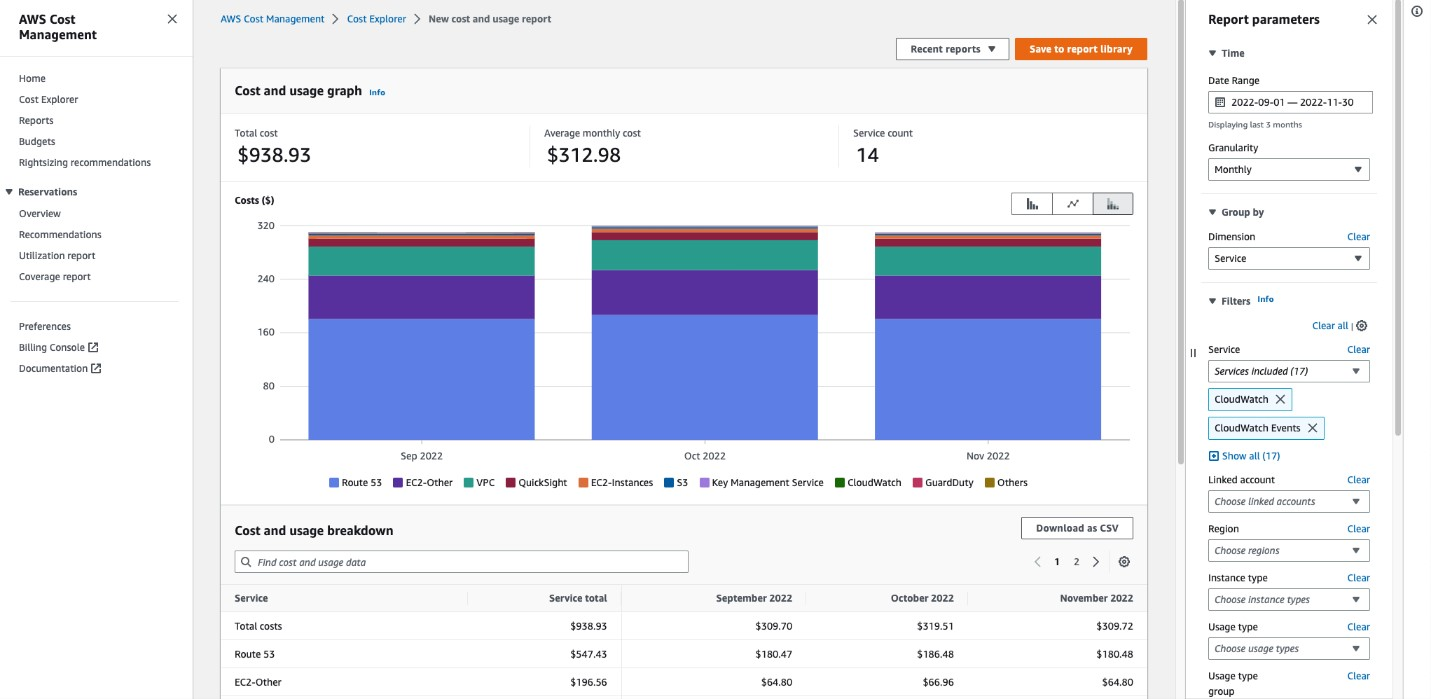
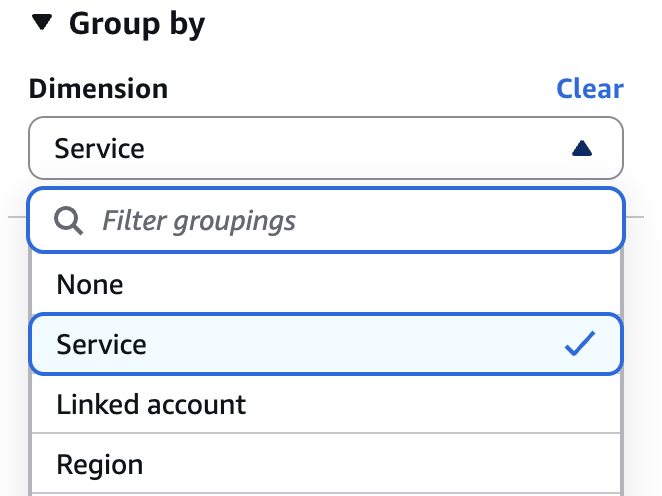
Step 3: Apply Filters and Groupings
Cost Explorer supports up to 18 filter dimensions. Common workflows include:
- Group by Service to identify your top cost drivers (the graph shows the top 9 services)
- Group by Linked Account to understand which team or business unit is driving spend
- Filter by Purchase Type to separate On-Demand, Reserved Instance, Savings Plan, and Spot usage
- Filter by Tag to view costs by project, environment, or cost center — assuming your tagging is consistent
Step 4: Use Preconfigured Reports
AWS provides several built-in reports that require no setup:
- Monthly costs by service
- Monthly costs by linked account
- Monthly EC2 running hours (costs and usage)
- Daily costs
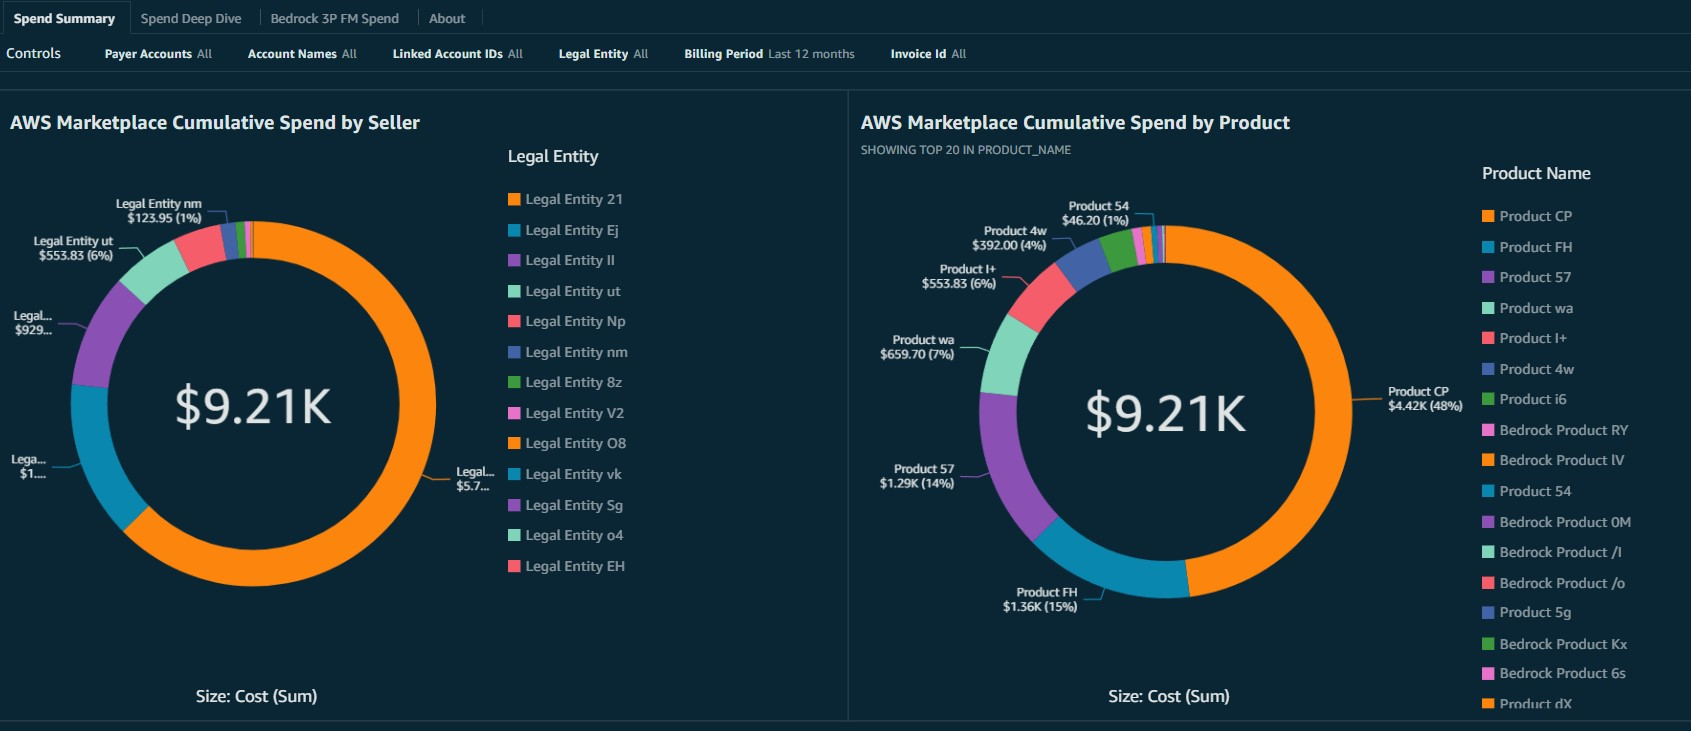
- AWS Marketplace costs
These preconfigured views surface accurate cost breakdowns without additional configuration.
Step 5: Create and Save Custom Reports
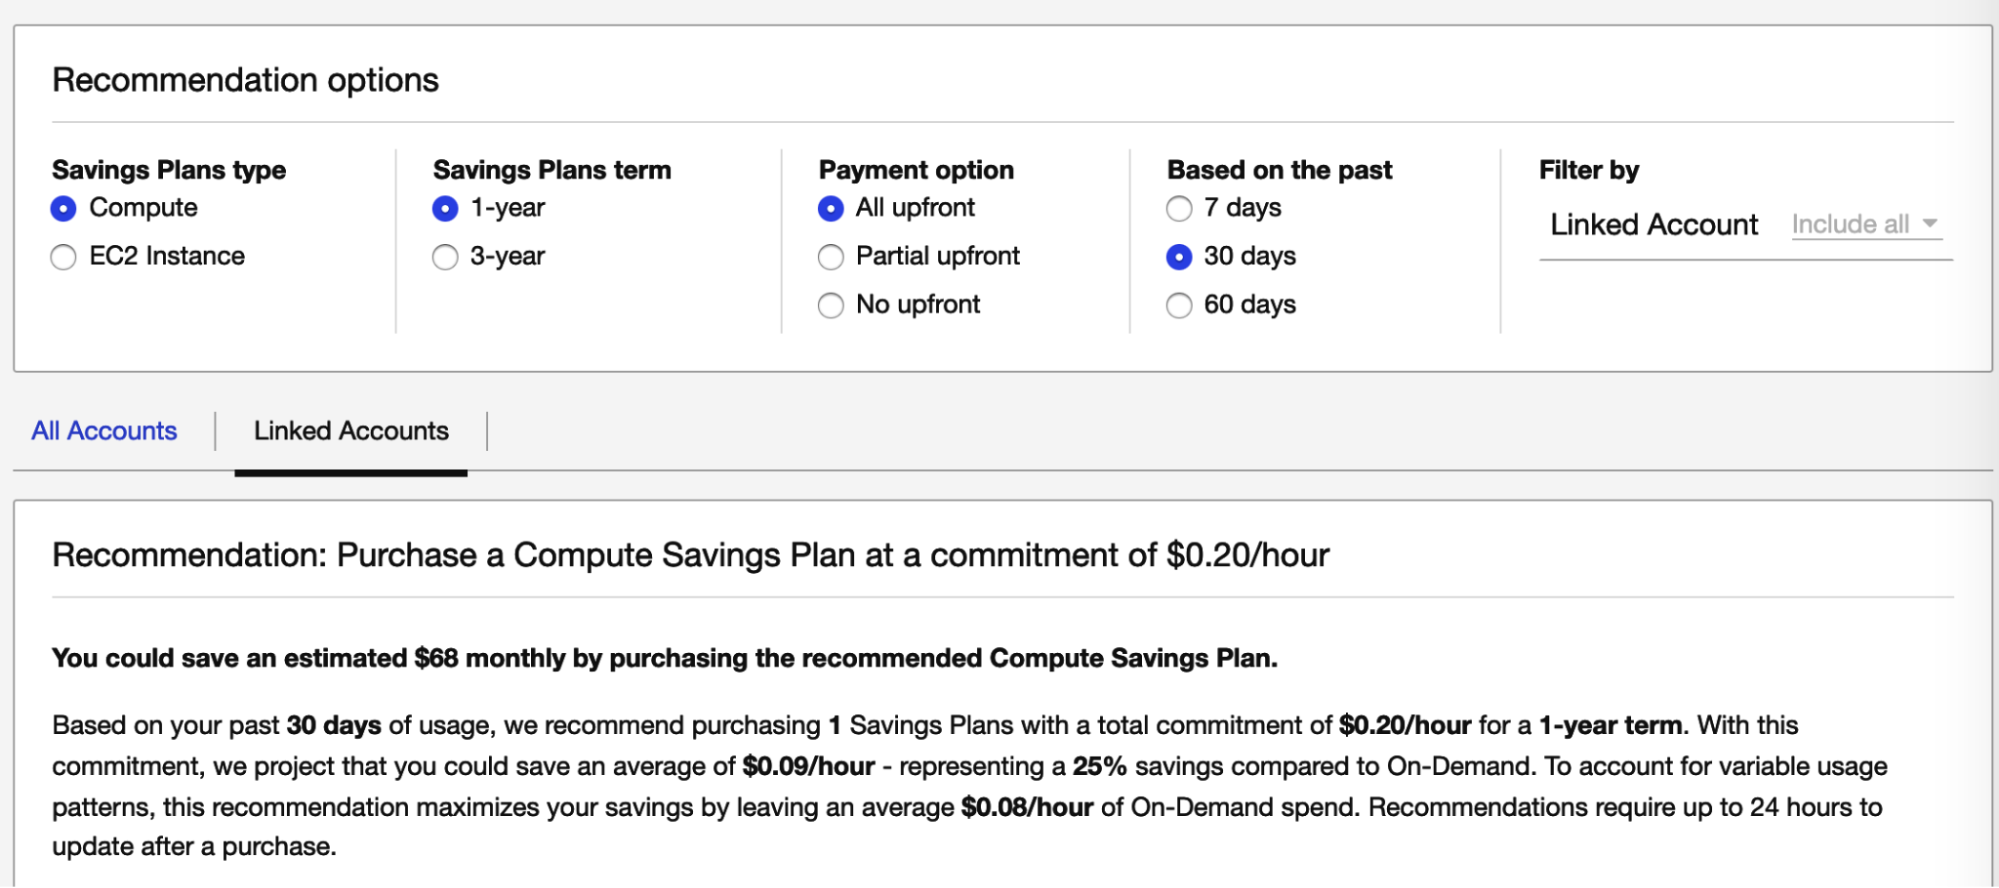
Step 6: Review Savings Recommendations
Step 7: Use Cost Comparison for Month-Over-Month Analysis
The Cost Comparison feature (launched May 2025) automatically identifies the most significant cost changes between two consecutive months. Instead of manually switching between views or exporting to spreadsheets, you get:
- Automatic detection of substantial cost changes across services, accounts, and regions
- Detailed breakdowns of cost drivers including usage changes, credits, refunds, and volume discount impacts
- A Top Trends widget on the Billing console home page showing the top 10 cost variations
Step 8: Ask Questions with Amazon Q
Where AWS Cost Explorer Falls Short
Cost Explorer is a solid starting point. But teams managing meaningful cloud spend — especially those with variable workloads, multiple accounts, or limited engineering bandwidth — consistently hit the same walls.
1. The 14-Day Hourly Data Cap
2. Recommendations Refresh Slowly
Cost Explorer’s Savings Plan and RI recommendations update every 72+ hours. In dynamic environments where workloads scale up and down throughout the day, stale recommendations lead to under-coverage or waste.
3. No Automation — Only Visualization
Cost Explorer tells you what happened. It does not act on what it finds. If it recommends a Savings Plan, you still need to manually evaluate the recommendation, gain internal approval, navigate to the purchase console, and execute. Then you need to monitor utilization yourself.
We recently spoke with a Director of Engineering at one mid-market company. Their process: four people meeting to review Cost Explorer recommendations and decide on savings plan purchases, yet still ending up with 57% utilization on some plans because the coverage didn’t match their variable workloads.
4. No Multi-Cloud Visibility
Cost Explorer is AWS-only. If you run workloads across Azure, GCP, or SaaS platforms like Snowflake and Databricks, you need a separate tool for each — or one unified multicloud platform that spans all of them.
5. Tagging Is Required but Not Enforced
Cost Explorer’s filtering depends entirely on consistent resource tagging. If teams don’t tag resources, those costs are invisible in any tag-based view. Cost Explorer provides no tagging enforcement, no detection of untagged resources, and no automation to fix gaps. You’re dependent on organizational discipline.
6. Limited Anomaly Detection
While AWS offers Cost Anomaly Detection as a separate service, Cost Explorer itself provides no built-in alerting when spend deviates from expected patterns. You can set budget alerts through AWS Budgets, but these are threshold-based, not ML-driven pattern detection.
7. The Commitment Management Gap
This is where Cost Explorer’s limitations become most expensive. The tool can recommend that you purchase a Savings Plan. It cannot:
- Continuously adjust commitment levels based on hourly usage fluctuations
- Convert or exchange commitments when workloads shift
- Ladder multiple small commitments to reduce lock-in risk
- Cover bursty workloads that spike from baseline to 2x or more
A Senior Director of Platform Engineering described the challenge clearly in a recent nOps introductory call: “We don’t want to spend a lot of time managing [commitments]. We’re looking at other vendors that can do a lot of that automation for us.” His team was paying entirely on-demand rates — not because they lacked awareness, but because the manual effort and lock-in risk of self-managing commitments wasn’t worth it for a two-person SRE team.
8. Static Analysis in a Dynamic Environment
When to Move Beyond Cost Explorer
Cost Explorer is the right tool when:
- You have a single account or small number of accounts
- Workloads are predictable and steady-state
- You have engineering bandwidth to manually manage commitments
- Your monthly spend is low enough that optimization payoff is minimal
Consider graduating to a dedicated platform when:
- Your savings plans are underutilized. If utilization is below 80%, you’re paying for commitments you’re not using. Automated management eliminates this.
- Your workloads are bursty. Variable usage from batch jobs, auto-scaling, or seasonal traffic makes static commitments risky. Platforms that adjust hourly coverage handle this natively.
- Nobody owns FinOps full-time. When cost management is a side task for an SRE or DevOps engineer, automation pays for itself in time reclaimed. As one platform engineering leader told nOps: “We’re in a place where we would just prefer to pay a small fee to somebody else to do it for us rather than us having to spend a whole bunch of our time fine-tuning all of this.”
- You’re scaling past $10K/month. At this spend level, even small coverage gaps represent thousands in missed savings monthly.
You need database commitment management. RDS and ElastiCache reservations carry higher lock-in risk than compute. Automated platforms manage this risk by laddering smaller commitments biweekly rather than making large, infrequent purchases.
How nOps Extends What Cost Explorer Started
Automated Commitment Management
nOps uses 100% automation to manage cloud commitments. The platform monitors usage hourly, purchases and exchanges commitments automatically, and maintains coverage without any manual intervention.
The result: customers achieve an average 40% improvement in their effective savings rate in year one, with even more savings in years two and three as the system matures.
Eliminate Lock-In Risk
Traditional self-managed commitments force you to predict usage months or years in advance. nOps works even for dynamic workloads that scale up and down. It commits in small increment and ladders commitments to create many small decision points for flexibility and less lock-in. If your workloads change — maybe you’re migrating from RDS to Aurora, or shifting compute to Bedrock — the automation adapts without stranded commitments.
Savings-First Pricing
nOps operates on a results-based pricing model: the platform only charges a percentage of the savings it generates. No upfront cost. No long-term commitment. If nOps doesn’t save you money, you don’t pay.
Full Cost Visibility
Beyond commitments, nOps provides the visibility layer that Cost Explorer offers — plus multi-cloud support, container cost allocation for EKS and ECS, SaaS contract tracking, and anomaly detection. Clara, nOps’s AI agent, delivers scheduled insights and answers natural language cost questions across your entire cloud footprint.
Getting Started
If you’re currently using Cost Explorer and want to see what automated optimization could save, you can book a free savings analysis with nOps. It takes just 15-30 minutes to connect your AWS account and review your potential savings with an AWS expert.
nOps manages $4 billion in AWS spend and was recently named #1 in G2’s Cloud Cost Management category.
Frequently Asked Questions
Does AWS Cost Explorer cost money?
How far back can I see data in Cost Explorer?
What is "EC2-Other" in AWS Cost Explorer?
Can Cost Explorer manage my commitments automatically?
Does nOps replace AWS Cost Explorer?
Last Updated: May 27, 2026, Cost Allocation & Reporting
Tags
Last Updated: May 27, 2026, Cost Allocation & Reporting
