- Blog
- Announcement
- New Kubernetes Total Workload Visibility UI
New Kubernetes Total Workload Visibility UI
Troubleshoot & simplify cluster management with full visibility from a single interface.
Getting visibility into your workloads can be complex, often requiring multiple tools and switching between platforms like Datadog, Cost Explorer, and Lens to piece together real-time insights into workloads, costs, and performance. And while Lens offers deep Kubernetes visibility, it’s resource-heavy, requires elevated access, and takes several steps to log in and start using.
Now, you can access the same visibility power as Lens effortlessly through nOps. Access node visibility, container rightsizing, workload troubleshooting, binpacking, and more — all without juggling multiple tools.
Designed for Developers and DevOps engineers, the nOps Kubernetes dashboard is optimized for ease of use and access. It’s easy to instantly see what’s going on in your clusters. Monitor and troubleshoot complex workloads at scale in a single streamlined UI with all the context, critical metrics and clarity you need.
What’s New
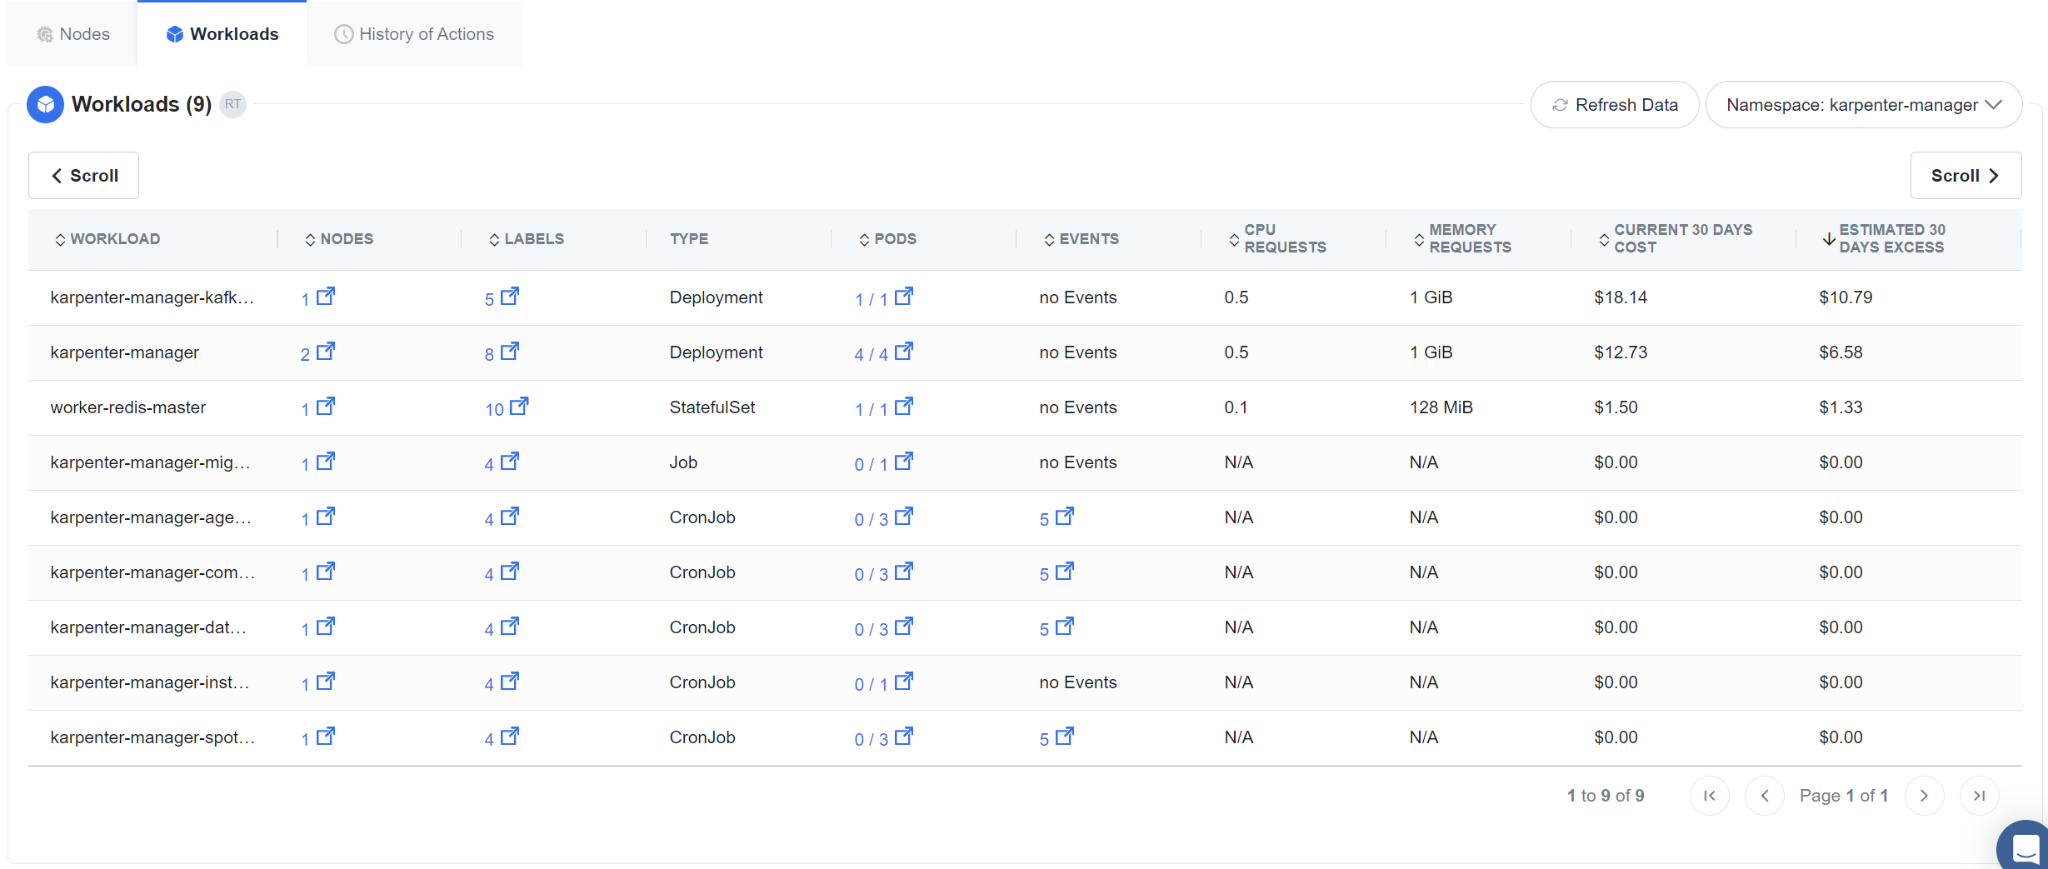
View all workloads on a single page
Get visibility into all of your workloads in one place — without the need to run multiple commands or connect via VPN or AWS authentication.
Gain a status overview, click into clusters, get insights, explore, and quickly understand what action to take.
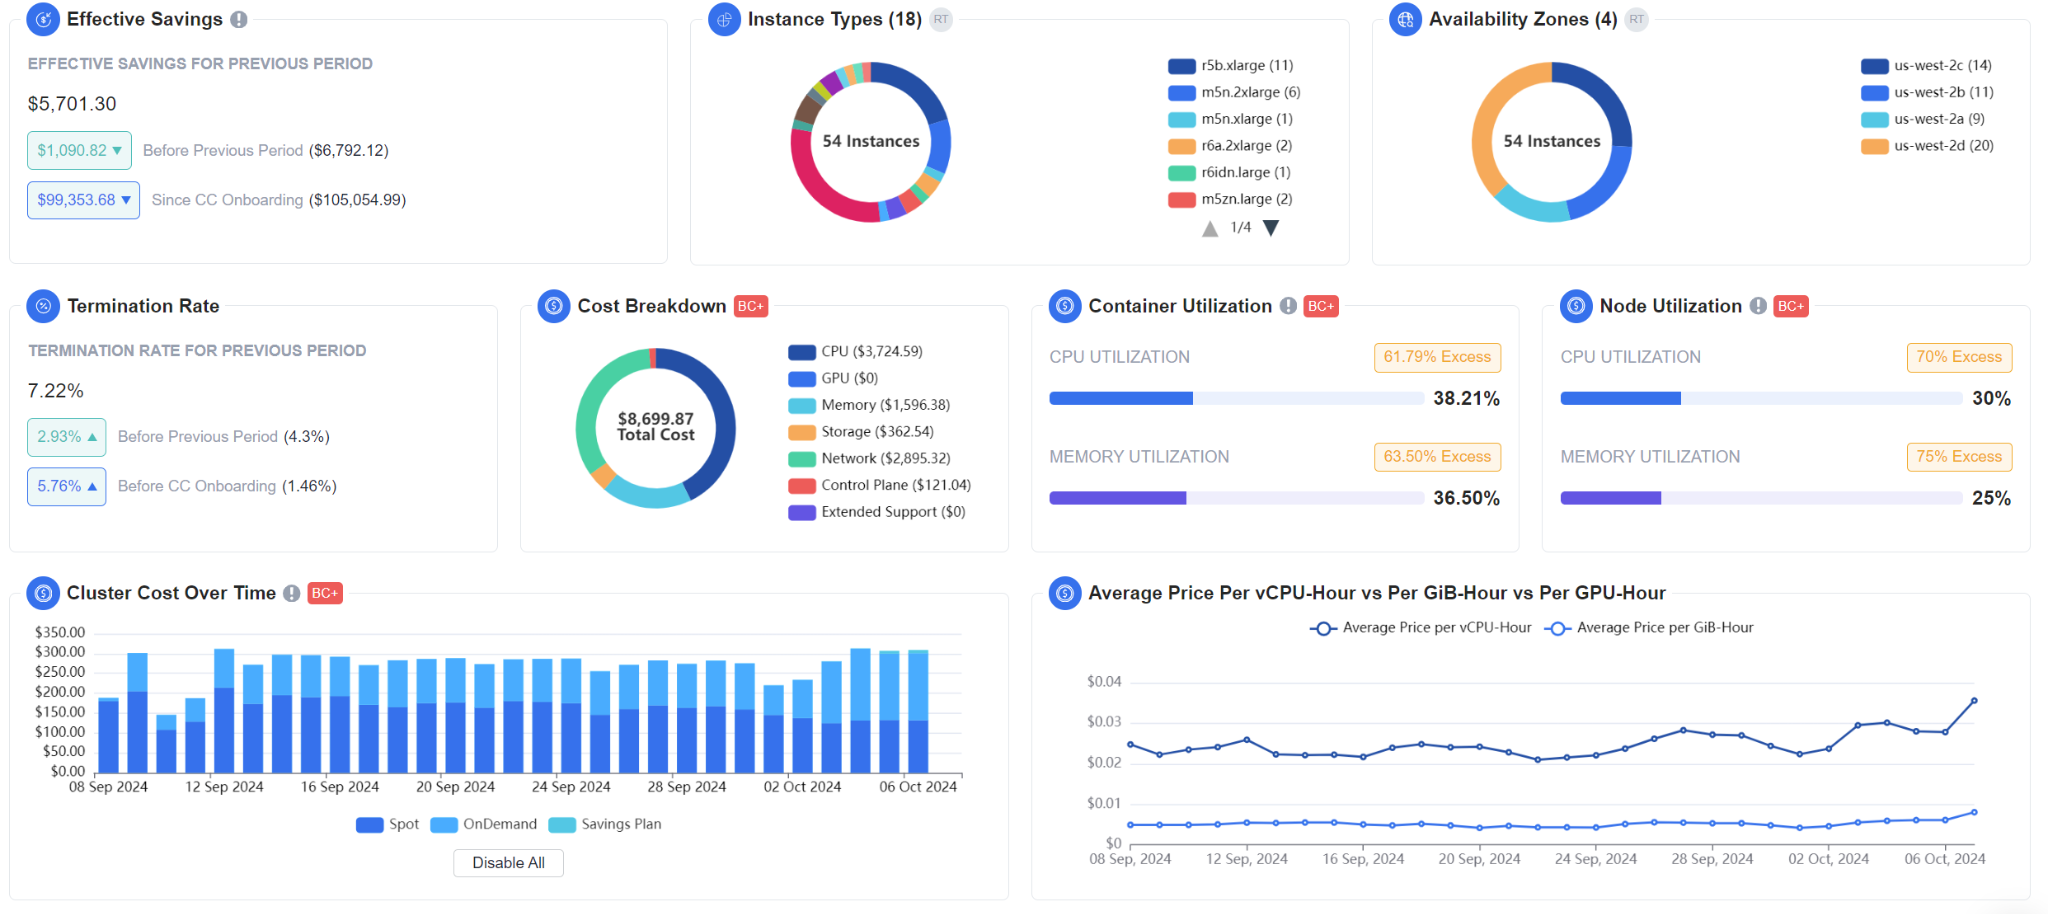
Understand critical metrics
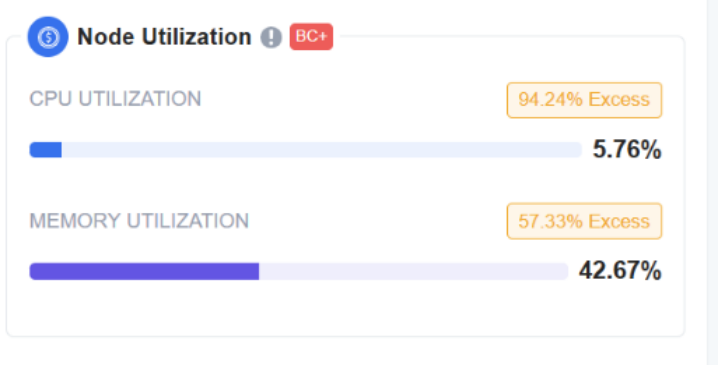
Monitor and optimize node resource use in EKS clusters
Tracking node utilization is one of the most impactful metrics for assessing the true efficiency of your Kubernetes optimization efforts, providing insights that drive meaningful cost savings and resource optimization.
Node-level visibility (not just container-level) is crucial to uncovering the true cost of excess capacity at the infrastructure level — which directly translates to wasted dollars. Even the most thorough container rightsizing efforts will have limited impact if your node utilization isn’t within an effective range.
The Node Utilization KPI provides detailed insights into CPU and memory usage across your EKS clusters, making it easy to identify and reduce wasted CPU and memory directly at the node level.
You can view Node Utilization both at the aggregate level (offering a comprehensive view of actual usage versus available capacity) and by cluster (allowing targeted adjustments to node resources).
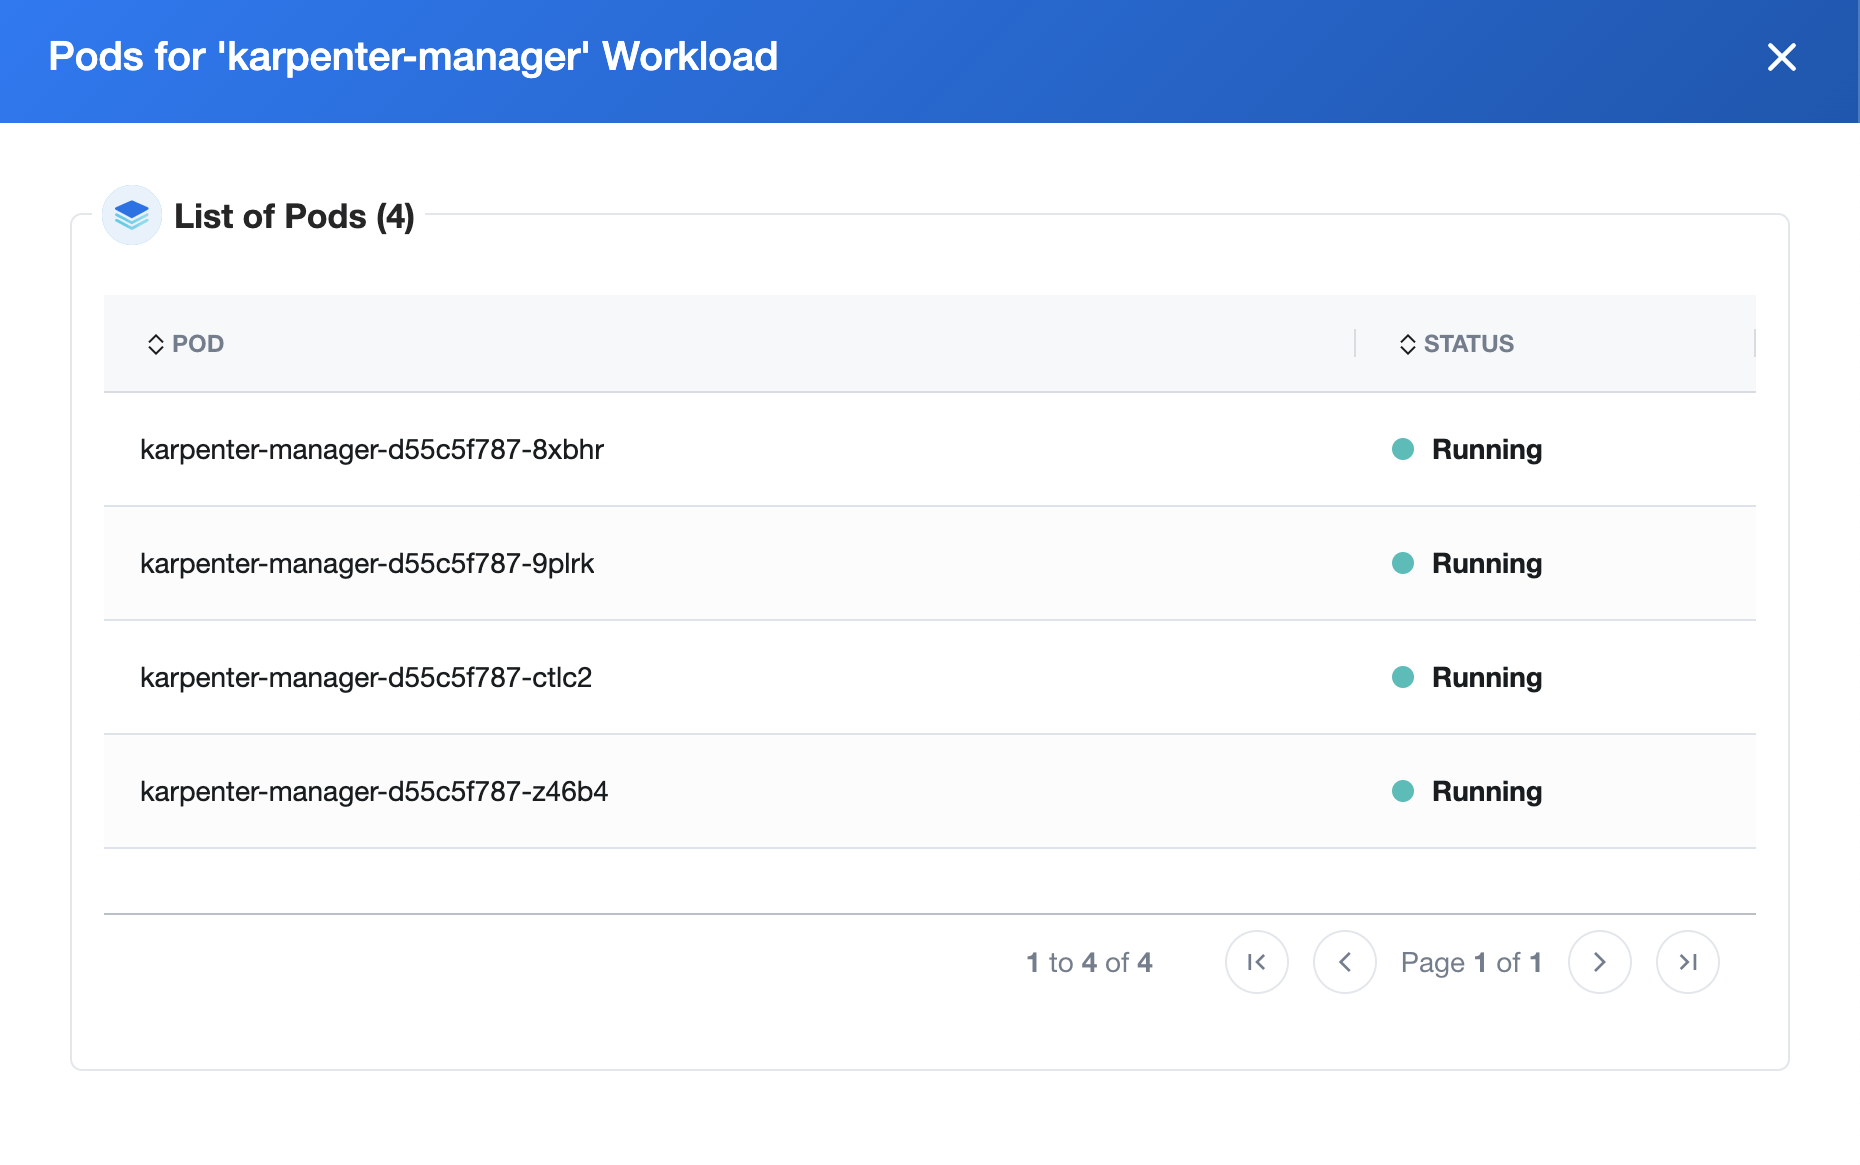
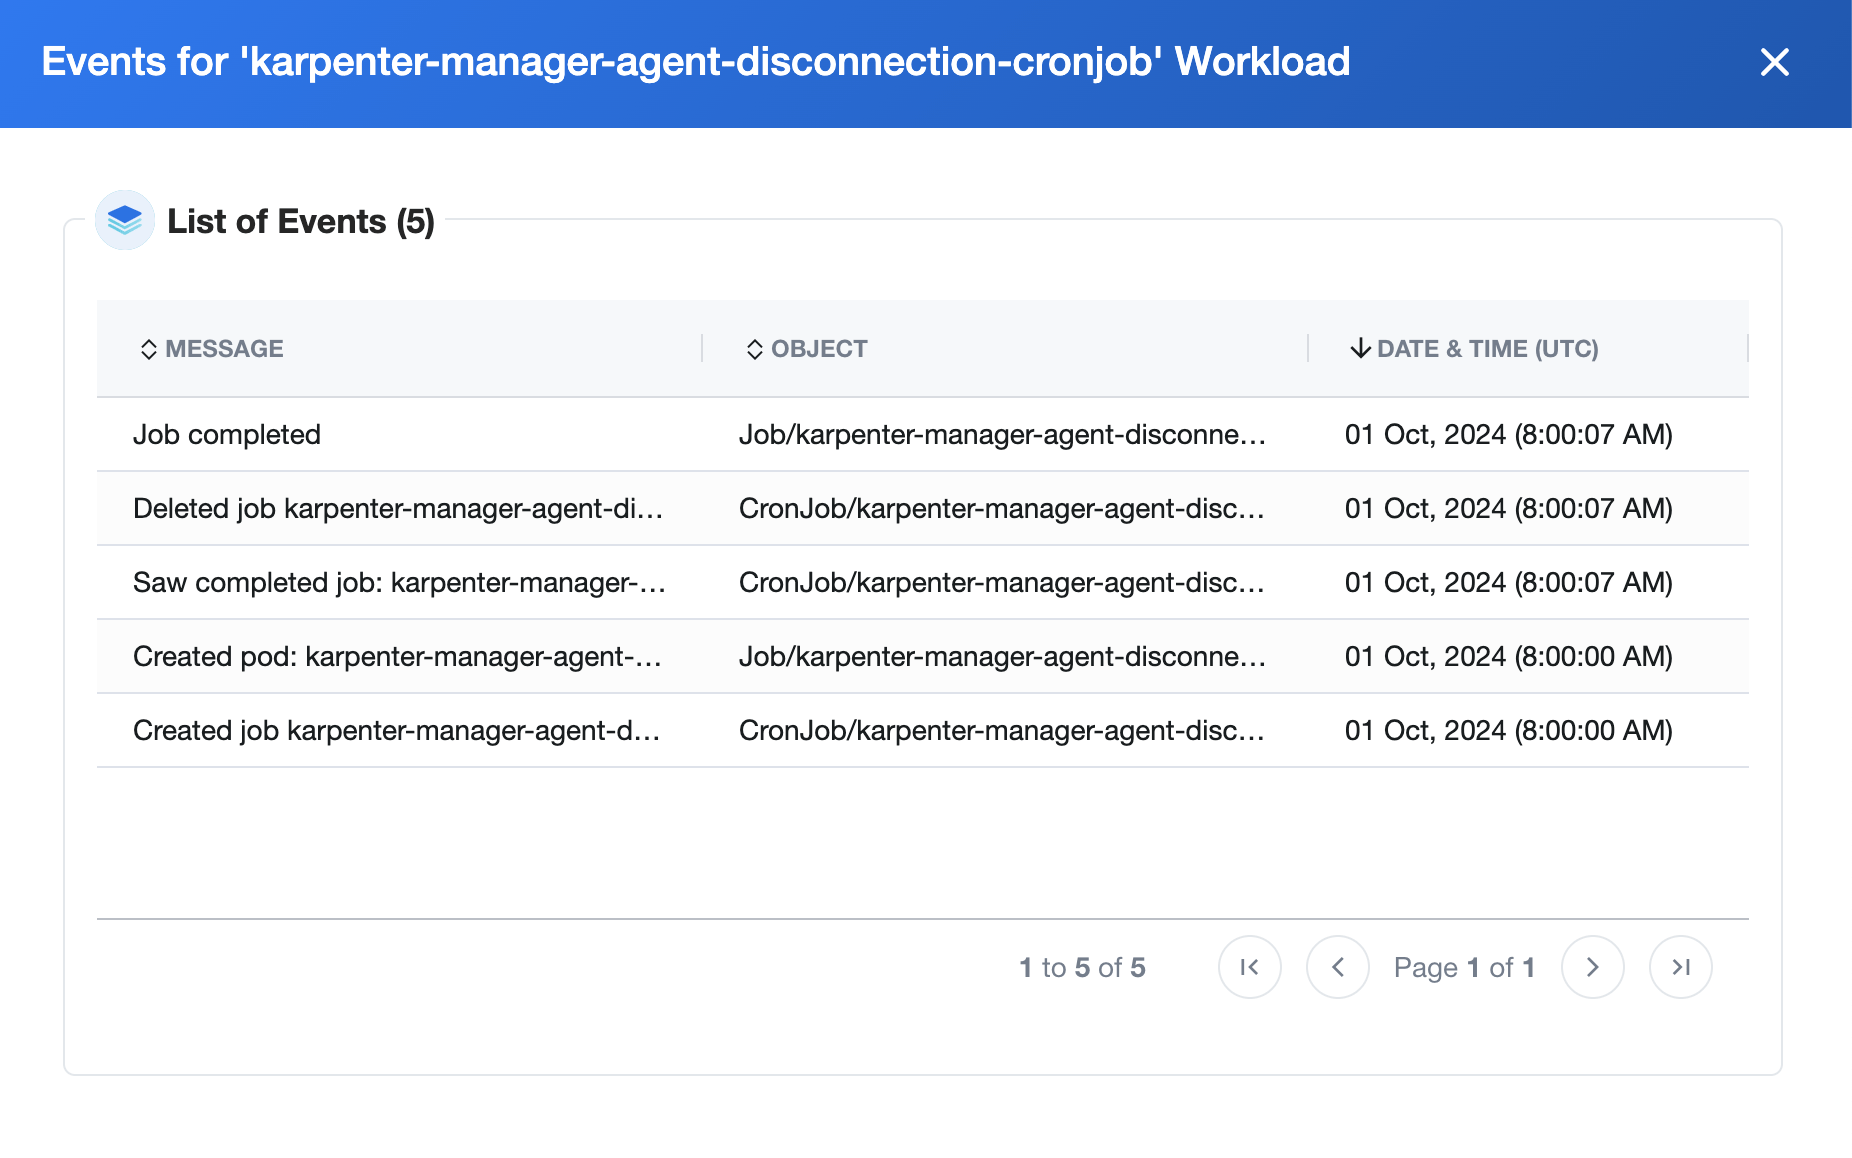
Drill down and troubleshoot
How it works & how to get started
The new Workloads Tab provides seamless access to real-time Kubernetes data—without requiring direct access to your cluster or complex configurations. After a simple setup, the lightweight agent securely fetches real-time data directly from the Kubernetes API and communicates it to the nOps backend via AWS SQS.
Here’s how it works:
- Effortless Installation: Start by running a CloudFormation stack to create the necessary IAM role for the nOps agent. Then, deploy the agent in your cluster with a single Helm command. This gives the agent all the permissions it needs to securely communicate with AWS SQS—without any additional network configuration.
- On-Demand Real-Time Data: When you open the Workloads Tab, the agent receives a request via an SQS queue, fetches the latest Kubernetes workload data in real-time, and sends it back to our backend through a reply SQS queue. Your data is always up-to-date without manual intervention.
- Streamlined Monitoring: The Workloads Tab consolidates all your workloads onto a single page, allowing you to monitor everything in one place—securely, without needing direct cluster access.
With no network configuration required and real-time data available on demand, you can monitor your workloads quickly and efficiently, all from your dashboard.
If you’re already on nOps…
Compute Copilot customers can access this new feature directly in the nOps platform. Have questions about the new dashboards? Need help getting started? Reach out to your Customer Success Manager to learn more.
If you’re new to nOps…
nOps is a complete platform for Kubernetes optimization: allocate container costs, get visibility into 100% of your unified AWS spend, rightsize containers, run on Spot, manage your AWS commitments and more.
nOps was recently ranked #1 with five stars in G2’s cloud cost management category, and we optimize $1.5+ billion in cloud spend for our customers.
Join our customers using nOps to understand your cloud costs and leverage automation with complete confidence by booking a demo with one of our AWS experts.
Last Updated: May 17, 2025, Announcement
Tags
Last Updated: May 17, 2025, Announcement


