Skip to content


In our previous article, we discussed how important cost allocation is to companies. As the late Lord Kelvin once said, “If you cannot measure it, you cannot improve it.” and that is certainly true for cloud costs. To that effect, nOps created a Showback model that allowed you to collect cloud resources into “buckets” of costs to apply their business context.
Showback allows businesses to divide cloud costs into necessary views, such as by department, application, or environment, to better understand where money is being spent. It answers the question, “Are we getting value for the dollar?” as most cloud services are billed by the time interval, and not necessarily the amount of the resource utilized. Whether you are tagging with a complex strategy, deploying into separate regions, or by collections of accounts – you can use nOps to aggregate costs into meaningful groups.
High Level Is No Longer Enough
Over time, reporting needs evolve. Our customers want to gain more insights at a deeper level of granularity from their Showbacks. For example, they might want to know which regions are running infrastructure for Application X or what’s the amortized cost for the EC2 instances in Account 4 for Team Tacos?
Introducing the new, enhanced Showback!
We’ve implemented your Showbacks into our resource cost reporting to allow for an extra level of analysis. With this new feature, you can now see data transfer costs by Environment, or gain visibility into which resources are covered by Saving Plans!
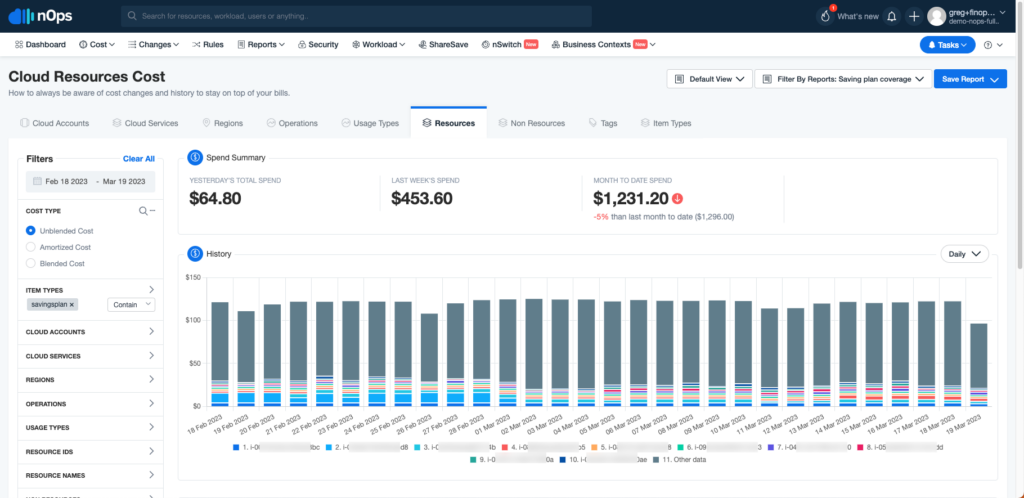
This allows organizations to explore the areas of opportunity to reduce cloud spend. When you can move from the general spend, into the specific resource and its cost, it empowers departments to put together a plan of action. In the Dev environment, Test123 makes up 35% of the spend. Now, let’s look into Resource123 to see if anything can be done.
Giving Everyone In The Organization Access To Cloud Data
Most AWS users struggle with a lack of feedback loop and the ability to comprehend the costs of their workloads, which can be overwhelming when looking through cloud costs. Grouping things into business-relevant groups is crucial to alleviate this issue.
However, it’s not just about grouping resources but also about narrowing the field you’re looking at, as it helps to focus on specific areas of concern. For example, you may be investigating a spike in RDS spending or data transfer costs from S3, and viewing information across all other services can be distracting.
This is where nOps comes in!
nOps helps AWS users with visual cloud cost reports that allow them to add business contexts to every dollar they spend. In addition, users can use filters to quickly explore the accounts, services, and usage types they’re interested in.
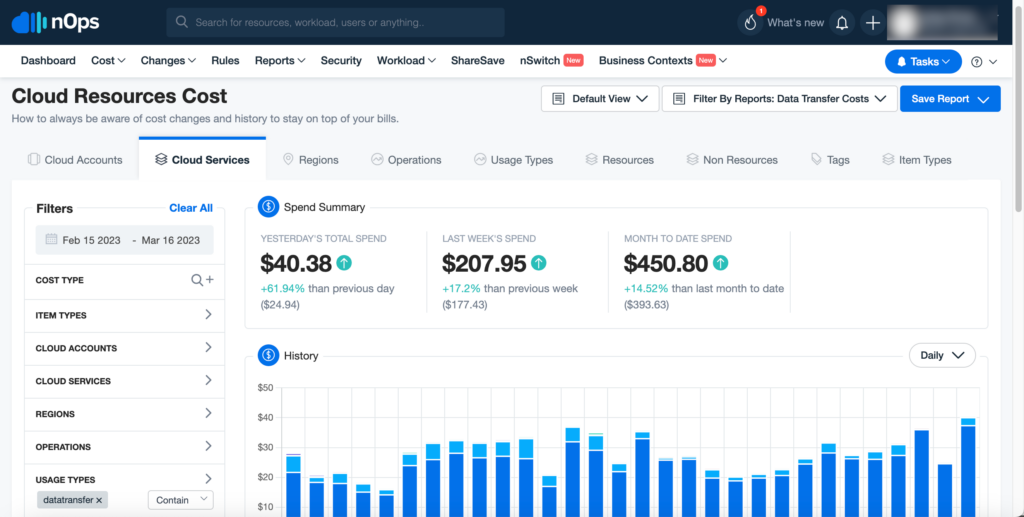
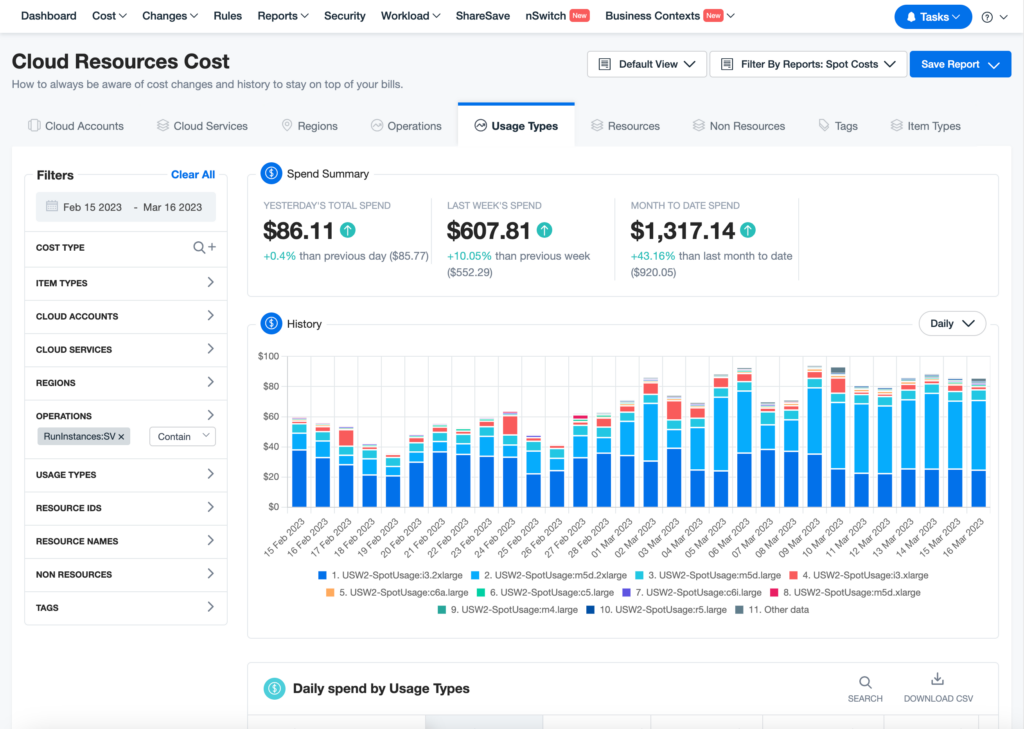
Here is another example where you can quickly focus on Spot Instance costs by instance type.
At nOps, we envision a world where teams take control of their cloud consumption, so they can pay for only what they use – not what they provision. Our Showback functionality helps to add your business context to every dollar of your AWS bill.
Your team focuses on innovation, while nOps runs optimization on auto-pilot to help you track, analyze, and optimize accordingly! Our customers can benefit in two key ways:
- First, pay less for what you use without the financial risk.
- Second, use less by automatically pausing idle resources.
Let us help you save! Sign up for nOps today.