
GPU Usage Monitoring: Track & Optimize GPU Costs on AWS
A single p5.48xlarge, with eight NVIDIA H100s, costs $55.04 an hour On-Demand in us-east-1, or about $40,000 a month. AWS bills that rate for every hour the instance is running, whether the GPUs are training a model or doing nothing. Leave it up over a long weekend between runs and close to $4,000 goes to idle hardware.
GPU usage monitoring tells you which of those hours are doing work. This guide to GPU utilization monitoring covers what to measure, how to collect it on AWS, how to read it, and where GPU spend tends to leak.
GPU Usage Monitoring at a Glance (2026)
GPU usage monitoring is tracking how much of the GPU capacity you pay for is actually in use (compute, memory, and active time) and connecting that usage to the workloads and teams running on it.
GPUs are the most expensive compute on a cloud bill, and they spend a lot of their time underused. A GPU running at 30% costs the same per hour as one running at 100%. The metrics worth watching:
- GPU utilization: the share of time the GPU is running work.
- GPU memory utilization: how much onboard memory a workload actually needs, which tells you whether the instance is the right size.
- Idle time: hours an instance is running with no job on it.
- Cost per GPU-hour and per job: what a training run or a batch of inference requests really costs.
- Attribution: which team, model, or product the GPU usage belongs to.
Why GPU Usage Monitoring Matters More Than Ever
AWS can tell you which GPU instances ran, for how many hours, and what they cost. It can't tell you whether the GPUs inside them were doing work. EC2's default CloudWatch metrics cover CPU, network, and disk, not GPUs, so the bill shows a busy instance and an idle one as the same hourly charge. Until GPU metrics are collected and matched to billing data, the two questions that decide whether GPU spend is justified, how much of the capacity was productive and whose workload it was, have no answer anywhere in AWS.
That blind spot costs more now because inference, which Deloitte expects to make up roughly two-thirds of all AI compute in 2026, runs continuously. A training cluster that's idle between projects leaves a gap in the schedule. An oversized inference fleet runs at that size every hour of every day.
GPUs are the priciest line item in AI/ML workloads
AWS GPU instances run from under a dollar an hour for a single inference GPU to more than $50 an hour for an eight-GPU training node. On-Demand prices in us-east-1 (AWS EC2 pricing):
Instance | GPUs | Typical use | Per hour | Per month (24/7) |
|---|---|---|---|---|
g6.xlarge | 1x NVIDIA L4 | Small-model inference | $0.80 | ~$590 |
g5.xlarge | 1x NVIDIA A10G | Inference, dev work | $1.01 | ~$730 |
g5.24xlarge | 4x NVIDIA A10G | Larger inference, fine-tuning | $8.14 | ~$5,950 |
p4d.24xlarge | 8x NVIDIA A100 | Training | $21.96 | ~$16,030 |
p5.48xlarge | 8x NVIDIA H100 | Large-scale training | $55.04 | ~$40,180 |
One hour of a p5.48xlarge costs as much as 546 hours of a general-purpose m7i.large. A forgotten m7i.large runs about $74 a month, and a forgotten p5.48xlarge about $40,000. CPU and memory dashboards, which is how most fleets are monitored, don't include GPU data at all.
The utilization gap - why GPUs sit idle or underused
GPUs are harder to keep busy than CPUs. A workload typically claims a whole GPU even when it needs a fraction of one. Distributed training needs every GPU in the job ready at once, so some wait on others. A fast GPU can also finish its math before the data pipeline delivers the next batch, which leaves it waiting on data for part of every step.
On top of that, a few habits show up in almost every GPU fleet:
- A training job finishes on Friday and the instance keeps running until someone notices.
- Notebooks and dev instances stay up between experiments because restarting them is a hassle.
- Inference endpoints are sized for peak traffic and run at that size all day.
- A small model runs alone on a multi-GPU instance because that's what was available.
Most organizations aren't set up to catch this. In ClearML's 2025-2026 State of AI Infrastructure at Scale survey of large enterprises, 35% named GPU and compute utilization as their top infrastructure priority, yet 44% said they still assign workloads to GPUs manually or have no utilization strategy at all.
Teams also misjudge how busy their GPUs are. Run:ai (now part of NVIDIA) found that researchers estimated their cluster utilization at 62% on average, while measured utilization across all GPUs in its customers' clusters was closer to 14%. Estimates built from busy periods leave out nights, weekends, and the gaps between jobs, so sizing and commitment decisions should rest on measured utilization history.
Cost consequences of poor GPU visibility
Here's what one p5.48xlarge running all month On-Demand costs at different utilization levels:
Average utilization | Monthly spend on idle capacity | Effective cost per productive hour |
|---|---|---|
80% | ~$8,000 | $68.80 |
50% | ~$20,100 | $110.08 |
30% | ~$28,100 | $183.47 |
10% | ~$36,200 | $550.40 |
Smaller, everyday versions of the same waste:
- A p4d.24xlarge left up over a weekend (Friday evening to Monday morning, about 64 hours) costs roughly $1,400 with nothing running on it.
- A g5.xlarge dev box nobody shut down runs about $730 a month. Five of them across a team is over $3,600 a month.
- An inference endpoint on two g5.24xlarge instances sized for peak costs about $11,900 a month. If traffic only needs both instances a few hours a day, most of that capacity sits unused.
The invoice lists all of this as ordinary instance-hours. Separating productive hours from idle ones takes utilization data, and without it the usual way teams find the gap is a jump in the monthly bill.
Key GPU Metrics to Monitor
'GPU utilization' covers three different things in NVIDIA's metrics: whether any kernel is running, how much of the chip is doing work, and how busy the memory system is. Reading them together is most of what GPU monitoring involves. The rest is knowing which hours were idle, who owned the work, and what a unit of work cost, and the five subsections below take those in turn.
GPU utilization (%) and memory utilization
Start with the coarse signal. GPU utilization (nvidia_smi_utilization_gpu in CloudWatch, DCGM_FI_DEV_GPU_UTIL in the DCGM exporter) is the percentage of time during the sample period that at least one kernel was running on the GPU. It says whether the GPU was doing anything, not how much of it. A small workload running continuously can read close to 100% while most of the chip sits unused.
The finer signals are DCGM's profiling metrics. SM activity (DCGM_FI_PROF_SM_ACTIVE) is the share of time a streaming multiprocessor had at least one warp assigned, averaged across all of them, so it tracks how much of the chip is in use. Tensor activity (DCGM_FI_PROF_PIPE_TENSOR_ACTIVE) shows how hard the tensor cores, which do the matrix math in deep learning, are working. DRAM activity (DCGM_FI_PROF_DRAM_ACTIVE) shows how busy the memory interface is. NVIDIA's documentation notes these are interval averages, and that a high value in one doesn't prove a workload is compute-bound or memory-bound on its own, so compare several together and check them against the application's throughput. The CloudWatch agent doesn't collect them, and the How to Monitor section below covers how to get them.
Memory has two separate measures that are easy to confuse. Memory used against memory total (nvidia_smi_memory_used and nvidia_smi_memory_total, or DCGM_FI_DEV_FB_USED) shows capacity, and it decides whether a workload would fit on a smaller GPU. The metric labeled memory utilization in nvidia-smi and CloudWatch is something else: the share of time memory was being read or written, which is a bandwidth measure. One caution on capacity: inference servers such as vLLM pre-allocate most of the GPU's memory for caching by design, and frameworks like PyTorch hold on to memory they've freed, so memory used near the top of the range is normal there and doesn't mean the model needs that much. Size from what the model needs at its largest context length and batch size.
Power draw (nvidia_smi_power_draw, or DCGM_FI_DEV_POWER_USAGE) works as a cross-check because it follows real work more closely than the utilization percentage does. An H100 SXM is rated for up to 700 W and an A100 SXM for 400 W. A GPU that reads 100% utilization while drawing well under its rated power is running light work.
Read together, the combinations mean different things:
What you see | What it usually means | What to do next |
|---|---|---|
Utilization near 0% and power near its idle level for hours | Nothing is running on the GPU | Find the owner from the instance tags, then stop, schedule, or release the instance |
Utilization high, SM activity low | Light kernels keep the GPU 'busy' while most of the chip is unused | Batch more work per GPU, move to a smaller GPU, or share one GPU across workloads with MIG or time-slicing |
SM activity high, tensor activity low on a deep learning job | The math is running on general-purpose cores instead of tensor cores | Check the job's precision settings, since mixed precision (BF16 or FP16) uses the tensor cores |
DRAM activity high, SM and tensor activity low | The workload is limited by memory bandwidth, which is typical of token generation in LLM inference | Raise batch size or concurrency, and compare GPUs on memory bandwidth as well as price |
Utilization rising and falling in a regular pattern | The GPU is waiting on input data, or on other GPUs, between steps | Training: add data-loading workers and prefetching, and check the network on multi-node jobs |
Peak memory used far below memory total | The workload fits a smaller GPU | Test on the next smaller GPU, and confirm peak memory under real load before switching |
Idle vs active time and duty cycle
Idle time is the number of hours an instance was running with its GPUs at or near zero utilization. Duty cycle is the share of running hours that had real work on them. In CloudWatch, graph nvidia_smi_utilization_gpu for each instance over two weeks at one-hour periods, pick a threshold for idle (5 to 10% works for most fleets), and count the hours below it. A p4d.24xlarge with a 40% duty cycle spent 60% of its $21.96 hourly rate, about $9,600 a month, on nothing.
The shape of the weekly graph usually points to the cause:
- Flat zero on nights and weekends: a dev or test instance left running.
- Busy blocks separated by long flat gaps: a training node kept up between jobs.
- A low, steady line that never spikes: an inference endpoint sized for more traffic than it gets.
- Near zero for days on an instance with no owner tag: an orphaned instance. Check CloudTrail for who launched it before stopping it.
Each pattern has a different fix, covered under Why GPU Costs Run Away.
Instance-level vs per-workload attribution
Instance-level metrics show that a GPU was busy, but not whose work it was. On a node dedicated to one job, the instance's owner tag is enough. It stops being enough when workloads share hardware: a notebook server with GPU nodes, an EKS cluster where pods from different teams land on the same node, or an inference server hosting several models on one GPU.
Three layers of labeling cover those cases. First, tags on every GPU instance for team, project, environment, and service or model name, activated as cost allocation tags in the Billing console so they appear in cost data. Second, on Kubernetes, pod-level GPU metrics, which the DCGM exporter labels with pod and namespace and Container Insights reports per pod. Third, for a GPU hosting several models, request or token counts per model from the serving layer, used to split that GPU's cost in proportion to use. Without the second and third, the cost of a shared GPU lands on whoever owns the node, and the teams driving the usage never see it.
Cost per GPU-hour and cost per training/inference job
Divide the instance price by its GPU count to get cost per GPU-hour (On-Demand, us-east-1):
Instance | GPUs | Instance price per hour | Cost per GPU-hour |
|---|---|---|---|
p5.48xlarge | 8x H100 | $55.04 | $6.88 |
p4d.24xlarge | 8x A100 | $21.96 | $2.74 |
g5.24xlarge | 4x A10G | $8.14 | $2.04 |
g5.xlarge | 1x A10G | $1.01 | $1.01 |
g6.xlarge | 1x L4 | $0.80 | $0.80 |
Cost per job follows from there. An eight-hour fine-tuning run on one p4d.24xlarge costs about $176. For inference, divide the endpoint's hourly cost by the work it served in that hour: a g5.xlarge serving 3,600 requests an hour costs about $0.28 per 1,000 requests, and the same endpoint at 900 requests an hour costs about $1.12 per 1,000 on an unchanged bill. The same formula works per million tokens if you count tokens.
Track the ratio weekly next to total spend. If cost per 1,000 requests rises while spend is flat, traffic dropped or throughput fell (a model change, a smaller batch size), and the GPU is doing less per dollar. If it falls after a change, that change is worth rolling out to other endpoints. Training works the same way with samples or tokens processed per dollar, which also makes runs on different instance types comparable.
Multi-GPU and multi-instance breakdowns
Average utilization across an eight-GPU node can hide idle GPUs. A node averaging 60% could be eight GPUs at 60%, or six at 80% and two at zero, which on a p5.48xlarge is about $13.76 an hour of idle capacity. The CloudWatch agent publishes each metric per GPU, and DCGM labels every series with a GPU index, so look at the minimum across the GPUs on a node, not just the mean. Three patterns are worth recognizing:
- One or two GPUs at zero while the rest are busy: the job was launched with fewer processes than the node has GPUs. Fix the launch configuration or move to a smaller instance.
- All GPUs rising and falling together: they're waiting on input data or on synchronization with each other. Check data loading first, and on multi-node jobs, network throughput.
- One GPU consistently below the others: an uneven split of work or a straggler. In distributed training the slowest GPU sets the pace for all of them, so check that GPU's clocks, temperature, and power for throttling.
At fleet level, report the share of GPU-hours below your idle threshold. Multiplied by the hourly price, it's the fleet's idle spend.
How to Monitor GPU Usage on AWS
EC2's default CloudWatch metrics don't include any GPU data, so any effort to monitor GPU usage in the cloud starts with collecting it. The path depends on where the workload runs: standalone EC2 instances use the CloudWatch agent, and EKS clusters use Container Insights or the DCGM exporter, with different levels of detail from each.
Native options - CloudWatch GPU metrics and the CloudWatch agent
For EC2 GPU monitoring on standalone instances, AWS publishes a packaged setup: the CloudWatch solution for NVIDIA GPU workloads on EC2, which deploys the CloudWatch agent through Systems Manager and creates a prebuilt dashboard. It supports up to 500 GPUs per region. The steps:
- Use an AMI with the NVIDIA driver installed (many AWS Deep Learning AMIs include it), with the SSM agent running and an instance role that lets the CloudWatch agent publish metrics.
- Store the agent configuration in Systems Manager Parameter Store. The key part is an nvidia_gpu block inside metrics_collected, plus an InstanceId dimension so each metric can be tied to an instance.
- Deploy it to the instances with Systems Manager and confirm the metrics appear in the CWAgent namespace. The default configuration collects once a minute.
The agent publishes 17 metrics per GPU by default, all billed as custom metrics, so a p5.48xlarge adds 136. The four that matter most are below, and trimming the measurement list to those cuts the metric count by roughly three quarters.
Metric | Use it to |
|---|---|
nvidia_smi_utilization_gpu | Find idle GPUs and build duty cycle |
nvidia_smi_memory_used and nvidia_smi_memory_total | Check whether the workload would fit a smaller GPU, using the peak over time |
nvidia_smi_power_draw | Cross-check utilization: high utilization at low power means light work |
nvidia_smi_utilization_memory | Spot memory-bandwidth-heavy work (a share-of-time measure, so optional) |
What the agent can't give you is SM, tensor, or DRAM activity, since it reads nvidia-smi fields. On plain EC2 those come from running NVIDIA's DCGM exporter on the instance and scraping it with Prometheus.
EC2 GPU instance families (P, G series) and what each exposes
Every NVIDIA-based EC2 instance reports through the same interfaces. What differs by family is memory per GPU, how many GPUs the instance has, and whether the GPU supports Multi-Instance GPU (MIG), and those decide what you can conclude from the metrics.
Family | GPU | Memory per GPU | GPUs per instance | MIG | Typical use |
|---|---|---|---|---|---|
G4dn | NVIDIA T4 | 16 GB | 1, 4, or 8 | No | Low-cost inference, graphics |
G5 | NVIDIA A10G | 24 GB | 1, 4, or 8 | No | Inference, smaller fine-tuning |
G6 | NVIDIA L4 | 24 GB | 1, 4, or 8 | No | Efficient inference |
G6e | NVIDIA L40S | 48 GB | 1, 4, or 8 | No | Larger-model inference |
P4d / P4de | NVIDIA A100 | 40 GB / 80 GB | 8 | Yes | Training, large inference |
P5 | NVIDIA H100 | 80 GB | 8 | Yes | Large-scale training |
P5en | NVIDIA H200 | 141 GB | 8 | Yes | Very large models |
Use the table for sizing. If a workload's peak memory used stays under 24 GB, it fits a G5 or G6 GPU instead of a P4d's A100, at $1.01 or $0.80 versus $2.74 per GPU-hour. If it needs 24 to 48 GB, G6e is the next step before P-series. Confirm throughput on the smaller GPU before switching.
On MIG-capable GPUs (A100, H100, H200), one GPU can be split into up to seven isolated slices. DCGM reports each slice separately, and Kubernetes can schedule pods to individual slices. On G-series GPUs, MIG isn’t available, so workloads can’t be partitioned into hardware-isolated GPU slices, though software-based sharing such as time-slicing is still possible.
Container/Kubernetes GPU monitoring (EKS, DCGM exporter)
On EKS, GPU capacity goes to waste in two separate places, and they show up in different metrics. A node can have GPUs that no pod has requested, or pods can hold GPUs they barely use. Kubernetes assigns GPUs to pods in whole units (Container Insights documents that a pod's GPU request always equals its limit), so the second case is common.
What you see | What it means | What to do next |
|---|---|---|
node_gpu_reserved_capacity low on a GPU node, or node_gpu_usage_total well below node_gpu_limit | GPUs are sitting on the node unassigned, because scale-down isn't removing the node or pending pods can't fit | Consolidate pods and let the autoscaler remove empty nodes |
Reserved capacity high, pod_gpu_utilization low | Pods hold whole GPUs and use a fraction of them | Move to a smaller GPU, share with MIG or time-slicing, or cut replicas |
To collect the data, install the CloudWatch Observability add-on to turn on Container Insights with enhanced observability. It deploys and manages the NVIDIA DCGM exporter and detects NVIDIA GPUs automatically, as long as the NVIDIA device plugin and container toolkit are installed on the GPU nodes. The enhanced metrics include node_gpu_utilization, node_gpu_memory_utilization, pod_gpu_utilization, and container_gpu_utilization, alongside the GPU limit, usage, and reserved-capacity counters used above. AWS's newer OTel Container Insights configuration of the same add-on keeps the original DCGM metric names and lets you query them with PromQL, with pod and node labels attached. NVIDIA GPU metrics in Container Insights are billed per observation, so check pricing before enabling them across a large fleet.
If you already run Prometheus and Grafana, deploy the DCGM exporter directly instead, which AWS's EKS best-practices guide recommends for custom dashboards. You choose which DCGM fields the exporter emits, and that's how you turn on SM, tensor, and DRAM activity.
Plain EC2 | EKS | |
|---|---|---|
Collection | CloudWatch agent with an nvidia_gpu configuration | CloudWatch Observability add-on, or the DCGM exporter |
Granularity | Per instance and per GPU | Per node, pod, container, and GPU |
SM, tensor, DRAM activity | Only by running the DCGM exporter yourself | Through the DCGM exporter; OTel Container Insights keeps DCGM names |
Shows whether GPUs are assigned to workloads | No | Yes, through reserved-capacity and pod GPU limit metrics |
Extra cost | 17 custom metrics per GPU by default | Container Insights per-observation pricing |
Where native monitoring stops - tying utilization to cost
CloudWatch tells you how busy each GPU was, and the AWS bill tells you what each instance cost. AWS doesn't connect them, which is the gap in GPU cost monitoring on AWS. To answer a question like how much the ML platform team spent on idle H100 time last month, someone has to do the join:
- Turn on the Cost and Usage Report with hourly granularity and resource IDs, so each instance's cost appears by hour.
- Pull each instance's GPU utilization for the same hours from CloudWatch.
- Join on instance ID and hour. Idle cost for the hour is the hourly cost multiplied by the share of the hour the GPUs were idle.
- Group the result by owner tags (the cost allocation tags activated in Billing).
Three complications make this harder than it looks. On shared EKS nodes, a node's cost has to be divided among the pods that used it. Commitments and discounts change the effective hourly rate, so the number to join is amortized cost, not the On-Demand price. And GPU utilization only says whether something was running, so weighting cost by it undercounts waste on lightly loaded GPUs. SM activity is more accurate, but it isn't collected by default on EC2.
Why GPU Costs Run Away
AI/ML GPU cost optimization comes down to five choices: how big an instance to launch, whether to release it between jobs, how to pay for it, which GPU family to run on, and how much work each GPU gets. Each leaves a recognizable mark in utilization data, and each section below covers the choice, what the data shows, and what to change.
Over-provisioned GPU instances for the actual workload
Over-provisioning shows up in monitoring data as peak memory used and SM activity well below what the instance offers, and as host CPUUtilization near idle. It takes three forms. The most expensive is launching more GPUs than a job uses: a single-GPU fine-tune on an eight-GPU p4d.24xlarge, chosen because it's the team's standard training instance, leaves seven A100s idle at about $19 an hour. The second is running on a bigger GPU class than the workload needs, which peak memory used reveals, and a common version of it is serving a model on the same P-series instance type it was trained on. The third is easy to miss: within a family, sizes with the same GPUs vary widely in price because they bundle more vCPUs and RAM. Every G5 size from xlarge to 16xlarge has one A10G, yet a g5.16xlarge costs about four times as much as a g5.xlarge ($4.10 vs. $1.01 an hour, AWS EC2 pricing), and a g5.24xlarge costs 44% more than a g5.12xlarge with the same four GPUs. If a GPU instance's host CPU and memory are mostly idle, a smaller size in the same family will run the workload for less.
Idle GPUs left running between jobs
In monitoring data this is utilization dropping to near zero while the instance keeps running, often starting at the same point each week. It isn't always an oversight. AWS notes that On-Demand GPU availability can change quickly, and that if you stop an instance you might not be able to get the same capacity back, which leads teams to keep GPU instances running longer than needed. On-Demand Capacity Reservations don't fix the cost side either: without a long-term commitment they bill at On-Demand rates whether or not the instances are busy.
The fixes release GPUs without losing access to them:
- Reserve capacity for scheduled work instead of holding it. EC2 Capacity Blocks for ML reserve P5-family instances for 1 to 14 days, or in 7-day increments up to 182 days, booked up to eight weeks ahead. You pay for the reserved window, not the weeks around it.
- Run training as jobs, not long-lived instances. Managed training services such as SageMaker training jobs provision instances when a job starts and release them when it ends, so there's no gap between runs to pay for.
- Let bursty inference scale to zero. Endpoints that handle queued or intermittent requests can use asynchronous inference, which scales down to zero instances when there's nothing in the queue.
- Shut down idle notebooks automatically. Idle-shutdown settings for managed notebooks stop GPU-backed notebook instances after a set period of inactivity.
On-demand pricing when Spot or commitments would fit
Utilization history sorts each workload into one of three groups. GPUs that are busy every hour of the day form a steady baseline and belong under a commitment. Work that can stop and resume, like checkpointed training, belongs on Spot. Everything else stays On-Demand, which should be the smallest share of GPU-hours.
Spot is spare EC2 capacity at up to 90% off On-Demand, with a two-minute warning before AWS reclaims an instance. It fits training jobs that checkpoint regularly and can resume, batch inference, and experimentation. It doesn't fit latency-sensitive endpoints, or large training jobs that can't tolerate losing a node partway through. Spot availability and discounts for GPU instances vary a lot by Availability Zone and change over time, so a job that depends on Spot needs a fallback.
Commitments fit the steady part of GPU usage, usually production inference that runs around the clock. For GPU instances, the type of commitment matters as much as the term. For a p5.48xlarge in us-east-1 (AWS Savings Plans pricing):
Pricing option | Hourly rate | Savings vs On-Demand |
|---|---|---|
On-Demand | $55.04 | - |
Compute Savings Plan, 1 year | $43.34 | ~21% |
Compute Savings Plan, 3 years | $40.42 | ~27% |
EC2 Instance Savings Plan, 1 year | $34.68 | ~37% |
EC2 Instance Savings Plan, 3 years | $23.78 | ~57% |
The flexible Compute Savings Plan, which applies across instance families and regions, saves far less on P5 than the family-specific EC2 Instance Savings Plan. The deeper discount only pays off if you're confident the workload will stay on that instance family for the full term. Size the commitment to the lowest number of GPUs that were busy in any hour of the last 30 days, not to peak. Anything above that baseline is billed whether or not the GPUs are in use.
Wrong instance family for the training vs inference profile
Training and inference stress different parts of a GPU, and each family is built for one more than the other.
Large-scale training needs a lot of GPU memory and fast networking between nodes, because GPUs in a distributed job constantly exchange data. P5 instances have 3,200 Gbps of network bandwidth and P4d 400 Gbps, compared with 100 Gbps on a g5.48xlarge. Multi-node training on G-series instances shows up in monitoring data as utilization that rises and falls in step across every GPU in the job while network throughput sits at its ceiling: the GPUs are waiting on the network. The hourly price is lower but the job takes longer, so compare cost per training run before assuming the cheaper family saves money.
Inference for small and mid-size models usually runs well on G-series GPUs (L4, A10G, L40S) at a fraction of P-series prices. The signal to check is DRAM activity against SM activity. Token generation in LLMs is typically limited by memory bandwidth, and the L4 in G6 instances, though cheaper per hour than the A10G in G5, has roughly half its memory bandwidth. A cheaper GPU that serves fewer requests per hour can cost more per request, so compare options on cost per 1,000 requests, not hourly rate.
The same comparison applies between generations. On a per-GPU basis, an H100 on P5 ($6.88 an hour) costs about 2.5 times an A100 on P4d ($2.74). Moving a job to H100s saves money only if it finishes at least 2.5 times faster, and measured throughput per dollar will show whether it does.
Low concurrency / poor scheduling across GPUs
A GPU can be fully allocated and still underused because it's handed too little work at a time.
In inference, low concurrency shows up as modest SM activity in short bursts while request queues stay near empty, because each request gets the GPU to itself. The biggest lever is batching: processing many requests on the GPU together instead of one at a time. Inference servers such as vLLM do this continuously as requests arrive, and the research behind vLLM reported 2-4x higher throughput than earlier serving systems at the same latency. On the same hardware, doubling throughput halves cost per request, which shows up directly in the cost-per-1,000-requests metric. Raise the server's concurrency limits until latency targets, not idle GPU time, are what holds it back.
In Kubernetes, scheduling can strand GPUs. If a cluster has eight free GPUs spread across four nodes, a job that needs eight GPUs on one node can't start. In Container Insights that looks like pods pending for GPUs while several nodes show free GPUs in node_gpu_reserved_capacity. The GPUs sit idle and bill while the job waits. Packing pods tightly onto as few nodes as possible helps, as does a job queue such as Kueue, which admits a job only when all the resources it needs are available. For light or development workloads, the NVIDIA device plugin's time-slicing lets several pods share one GPU, though without the memory isolation MIG provides.
From GPU Monitoring to Automated GPU Optimization
Five rules cover most of the GPU waste that monitoring finds: an alarm on idle GPUs, a tag requirement at launch, schedules for dev instances, Spot for checkpointed training, and automated commitments for steady usage. This section covers how each works.
Why monitoring alone doesn't lower the bill
What an idle GPU costs depends mostly on how long it takes someone to notice and act. Here's what a p5.48xlarge left idle costs under different detection methods, assuming it's caught halfway through the average cycle:
How idle GPUs get caught | Typical idle time before action | Cost of one idle p5.48xlarge |
|---|---|---|
Monthly cost review | ~15 days | ~$19,800 |
Weekly review | ~3.5 days | ~$4,600 |
Daily report | ~12 hours | ~$660 |
Alarm after 3 idle hours, auto-stop | ~3 hours | ~$165 |
Each step down the table needs something different. A weekly review needs a named owner for the report, a daily report needs every instance tagged to an owner, and the last row needs an alarm wired to an automated action. The next three sections cover those.
Surfacing underutilized GPU instances automatically
An alert is only useful if it reaches someone who can act, so ownership comes first. An AWS Organizations service control policy can deny launching P- and G-series instance types unless the request includes owner and team tags. With that in place, each idle-GPU alarm can notify the instance's owner directly.
The alarm itself is per instance: GPU utilization (nvidia_smi_utilization_gpu) below about 5% for three or more consecutive hours, sent to an SNS topic that invokes a Lambda function. The function reads the owner tag and messages the owner, and can stop the instance if you choose. For training nodes, add power draw as a second condition, since a job briefly waiting on data can dip utilization without being idle.
For the recurring report, rank GPUs by idle dollars, not by utilization percentage. A p5.48xlarge at 50% utilization wastes about $20,000 a month. A g6.xlarge at 10% wastes about $530. Sorted by utilization, the g6 tops the list. Sorted by idle dollars (idle share multiplied by the instance's hourly price), the p5 does, which is where the attention should go.
Closing the loop - scheduling, Spot and commitments without manual effort
Scheduling: For dev and test GPU instances with predictable hours, Instance Scheduler on AWS starts and stops instances on a set schedule, and the weekly utilization graph tells you which hours to use. Running a g5.xlarge from 8am to 8pm on weekdays instead of around the clock cuts its bill from about $730 to about $260 a month. Stopped instances still bill for their attached EBS volumes, so schedules work best on instances with modest storage.
Spot: For training, SageMaker Managed Spot Training runs jobs on Spot capacity at up to 90% off On-Demand, handles interruptions, and resumes from checkpoints saved to S3. You set a maximum wait time for Spot capacity, so jobs don't stall indefinitely. On EKS, autoscalers such as Karpenter can place interruptible, checkpointed jobs on Spot nodes automatically.
Commitments: Steady GPU usage, typically production inference, should be covered by Savings Plans or Reserved Instances, but GPU commitments are large and GPU usage shifts quickly, which makes manual purchasing risky. nOps Commitment Management automates it: it buys commitments in small increments, rebalances every hour against actual usage across EC2, SageMaker, and other services, and charges only a percentage of the savings it delivers.
GPU spend in the same view as the rest of your AWS bill
The GPU instance is the biggest line in a GPU workload's cost, but not the only one, and the rest doesn't appear in GPU dashboards:
- Checkpoints and training data in S3. A 70-billion-parameter model's weights alone are about 140 GB at 16-bit precision, and full training checkpoints that include optimizer state are several times larger. Keeping 100 weight-only snapshots is about 14 TB, roughly $320 a month in S3 Standard, and it grows every month without a lifecycle policy to expire old ones.
- EBS volumes on stopped or forgotten instances. Volumes keep billing after an instance stops, and GPU instances are often launched with large volumes for datasets and model weights.
- Data transfer between Availability Zones. Distributed training or inference traffic that crosses AZs is billed at $0.01 per GB in each direction, which adds up quickly for jobs that exchange large amounts of data.
Apply the same owner and project tags to these resources as to the GPU instances, set an S3 lifecycle rule to expire old checkpoints, delete EBS volumes left behind after instances are terminated, and keep distributed jobs inside one Availability Zone so their traffic doesn't cross AZ boundaries.
How nOps Helps You Track GPU and AI Costs
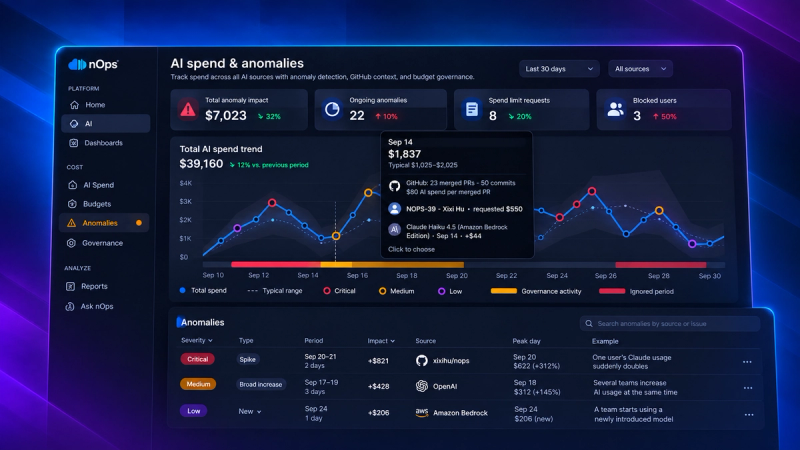
Most of the metrics above only work once spend is actually allocated to a customer, product, or team. Allocating costs is not a single feature bolted onto nOps, it's what the platform is built around. nOps enables customers to attribute every dollar of AI spend to the model, account, team, customer, and feature that drove it, hour by hour, with no unassigned bucket left behind.
- Full AI cost visibility: hourly granularity across a comprehensive set of models and providers with 100% of spend automatically allocated
- Business Unit Economics: define custom units: customers, products, teams — and get cost per unit and margin without a separate allocation project first
- Real-time anomaly detection & forecasting: same-hour alerts when a model, account, or feature spikes past its baseline
Book a free savings analysis to see your own GPU and AI spend mapped out. nOps manages $5B+ in cloud spend and was recently rated #1 in G2's Cloud Cost Management category.
FAQs
What is GPU usage monitoring?
GPU usage monitoring is tracking how much of the GPU capacity you pay for is actually in use (compute activity, memory, and idle time) and connecting that usage to the workloads, teams, and costs behind it.
Why monitor GPU utilization in the cloud?
Cloud GPUs bill for every hour they run, busy or not, and they're the most expensive compute on the bill. Without utilization data you can't tell productive hours from idle ones, size instances correctly, or decide how much capacity to commit to.
How do I monitor GPU usage on AWS EC2?
Install the CloudWatch agent on instances with an NVIDIA driver and add an nvidia_gpu section to its configuration (AWS also offers a packaged CloudWatch solution that deploys this through Systems Manager). The agent publishes GPU utilization, memory, and power metrics to CloudWatch. On EKS, use CloudWatch Container Insights or the NVIDIA DCGM exporter to get GPU metrics by pod. To connect usage to cost, match those metrics against billing data by instance and hour.
How does nOps help optimize GPU costs?
nOps allocates GPU and other AI spend to teams, products, and environments by the hour, flags cost anomalies as they happen, and automates Savings Plan and Reserved Instance management for steady GPU usage, rebalancing commitments hourly. It shows GPU costs alongside the rest of your AWS, Azure, GCP, AI, and SaaS spend.