
Introducing Node Efficiency
Fine-grained visibility into CPU and memory utilization—and waste—across every node in your clusters
With workloads that spike and dip throughout the hour and day, teams often size for peak demand and end up paying for excess capacity. Aggregated metrics hide the hourly peaks, troughs, and unused capacity that tell you exactly where and when to rightsize.
We built a set of features that make it easy to surface per-node and per-nodepool/per-node group usage and waste over selectable time windows, so your team can optimize scaling policies, reclaim wasted capacity, and cut unnecessary cost.
What's New
In the nOps EKS dashboard, you can view both hourly fleet-wide and per-pool CPU/memory usage and waste metrics at a glance.
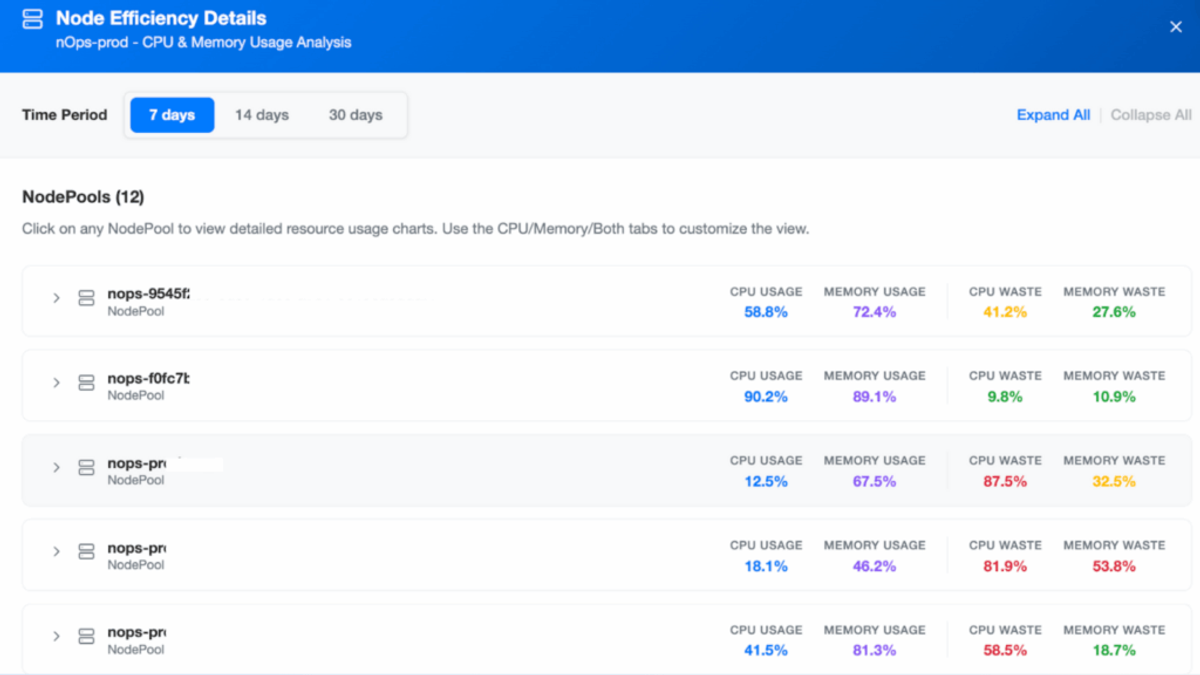
Cluster-level Time-Window Overview
Under the Node Efficiency card on your cluster page, you’ll now see a control to switch between 7-, 14-, and 30-day summaries. Instantly compare overall CPU usage, memory usage, and waste percentages for the entire node fleet—no spreadsheets required.
NodePool-level Usage & Waste Charts
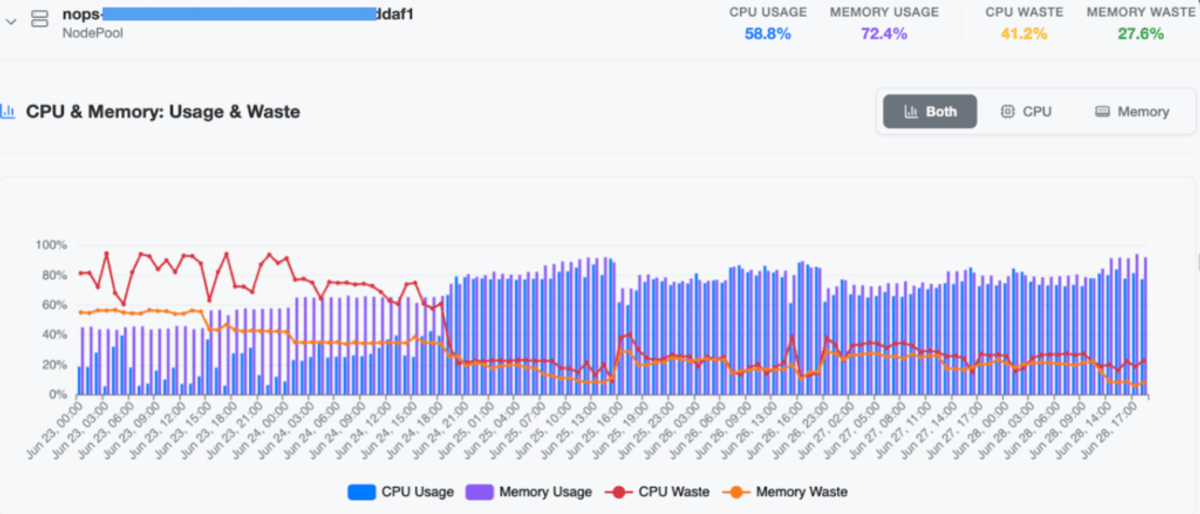
Click any node pool to expand an hourly chart showing:
- CPU Usage (blue bars)
- Memory Usage (purple bars)
- CPU Waste (red line)
- Memory Waste (orange line)
Hover for exact values, spot underutilized pools, and pinpoint when and where to tweak node schedules or adjust auto scaling policies.
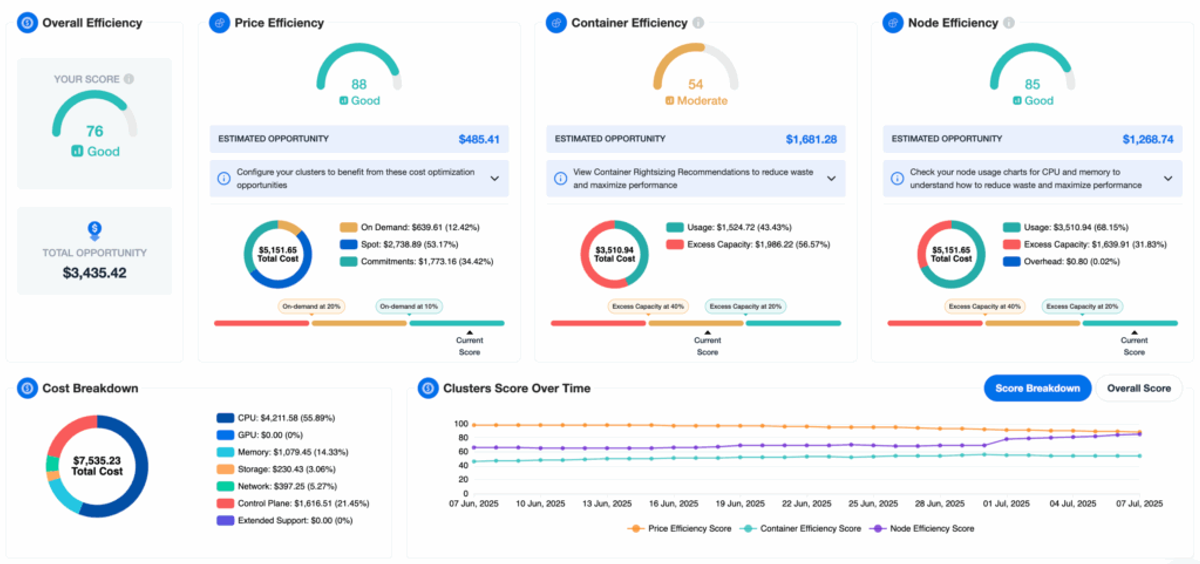
The EKS Insights Dashboard
Node Efficiency is just the latest addition to the EKS Insights Dashboard, delivering:
- Efficiency Benchmarking: A 0–100 Score for containers, nodes, and pricing let’s you instantly know how optimized your clusters are.
- Total Opportunity Savings: A dollar estimate of your untapped cost-saving potential.
- Cost Breakdown: Visibility into spend drivers like CPUs, GPUs, memory, storage, and networking.
- Cluster Score Over Time: Trend analysis to measure the impact of optimization actions.
- Drill-down Filters: View organization-wide metrics or focus on individual clusters for targeted action.
How It Works
Here’s how it works under the hood—and why it’s so lightweight and cost-efficient:
- You install the nOps EKS agent with a single Helm command and it runs entirely in memory on each node, using just a few megabytes of RAM.
- Every minute the agent captures CPU and memory usage at both the container and node level with negligible performance impact.
- Each data point is automatically tagged with Kubernetes metadata—labels, namespaces, and node-pool—for rich context without extra setup.
- Metrics stream in real time to nOps, where they’re aggregated over rolling 7-, 14-, and 30-day windows without any disk or S3 storage.
- nOps continuously compares actual usage against provisioned capacity to calculate waste and power detailed fleet-wide and per-pool charts at minimal cost.
How to Get Started
To start viewing your Node Efficiency, navigate to the EKS dashboard.
If you’re already on nOps…
Have questions about the new feature? Need help getting started? Our dedicated support team is here for you. Simply reach out to your Customer Success Manager or visit our Help Center. If you’re not sure who your CSM is, send our Support Team a message.
If you’re new to nOps…
nOps was recently ranked #1 with five stars in G2’s cloud cost management category, and we optimize $5+ billion in cloud spend for our customers.
Join our customers using nOps to understand your cloud costs and leverage automation with complete confidence by booking a demo with one of our AWS experts.
Demo
AI-Powered Cost Management Platform
Discover how much you can save in just 10 minutes!
Book a Demo