New EKS Dashboard for Compute Copilot
Benchmark and optimize cost efficiency at the container, node and pricing level
Kubernetes cost optimization can be complex — often involving multiple data streams, dashboards, and reports. Teams waste time sifting through data instead of acting on the biggest cost-saving opportunities.
That’s why we built the EKS Insights Dashboard, a unified benchmarking system that measures efficiency across all your EKS clusters. It calculates your efficiency at every level—container, node, pricing, and overall—so you can instantly see how well your clusters are performing and what to optimize first.
What’s New
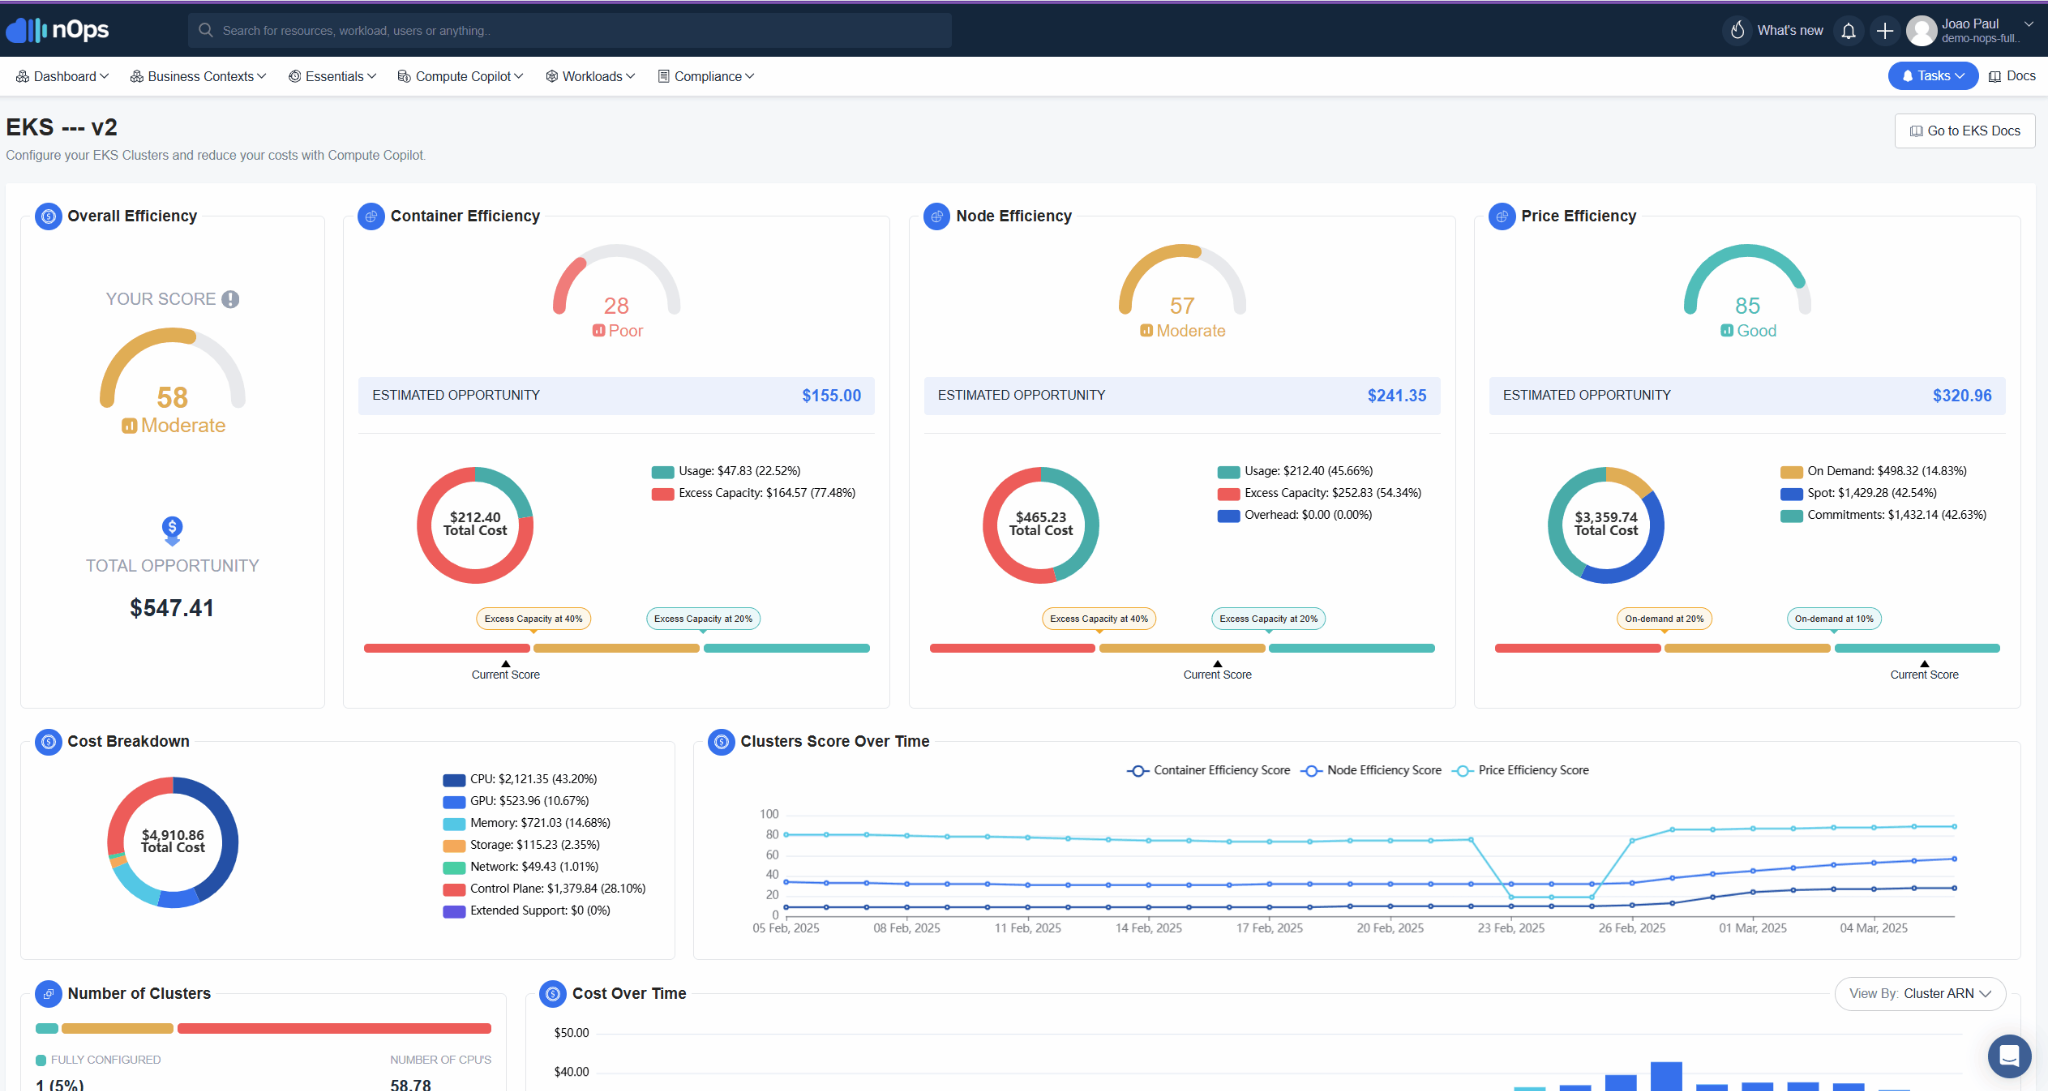
Starting today, the EKS Insights Dashboard is available in nOps Compute Copilot. This dashboard gives you a real-time, organization-wide view of your EKS efficiency and cost-saving opportunities. All dashboard features—including efficiency scores, cost breakdowns, and optimization insights—can be viewed either across your entire organization or filtered by individual cluster(s).
Who is it for?
Engineering Manager | FinOps Practitioner | DevOps Teams |
 Track cluster performance across multiple dimensions: monitor efficiency in real-time across all your clusters, overall or broken down by container, node and price efficiency.  Benchmark against clear performance tiers: understand how optimized you are and how to balance cost & performance.  Identify quick wins: by checking the Total Opportunity Savings estimate, decide where to focus engineering efforts first.  Measure the impact of optimizations: the Cluster Score Over Time helps you report progress and refine strategies to continuously optimize performance and cost. |  Cost transparency: glance at the Cost Breakdown to see if you are accidentally overspending on Extended Support or Networking costs  Optimize pricing strategies: use the Price Efficiency Score to identify if you’re overpaying for On-Demand and whether you can shift toward Spot, Reserved Instances, or Savings Plans.  Pinpoint savings opportunities: with detailed insights into container waste, idle node capacity, and pricing inefficiencies, you can develop targeted actions for saving costs and aligning cloud spend with business goals.  Quantify cost-saving opportunities: the Total Opportunity amount is displayed, helping justify optimization initiatives. |  Eliminate container waste: use the Container Efficiency Score to identify over-provisioned workloads and resize them to reduce unused capacity.  Optimize node utilization: use the Node Efficiency Score to ensure workloads are tightly bin-packed and idle resources are minimized.  Monitor real-time changes: with Cluster Score Over Time, spot negative trends early and confirm that modifications to resource requests, autoscaling policies, etc. are improving efficiency  Ensure pricing efficiency at the workload level: use the Price Efficiency Score to check if workloads are running on the most cost-effective instance types and adjust compute choices accordingly |
Container, Node & Price Efficiency Scores
Efficiency scores make it easy to determine how optimized you are at every level:
- Container Efficiency Score: Find and eliminate wasted container resources. The dashboard highlights unused capacity, showing you exactly how much you’re overspending and where rightsizing will have the biggest impact.
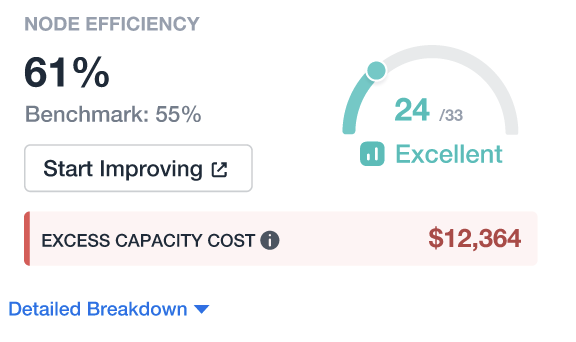
- Node Efficiency Score: Reduce idle capacity and improve bin-packing efficiency. Compute Copilot offers automated optimizations with Karpenter or Cluster Autoscaler, or you can adjust scaling policies manually.
- Price Efficiency Score:Understand if you’re paying more than you should. Compute Copilot evaluates your commitment utilization and helps shift workloads to Spot, Reserved Instances, or Savings Plans for maximum savings.
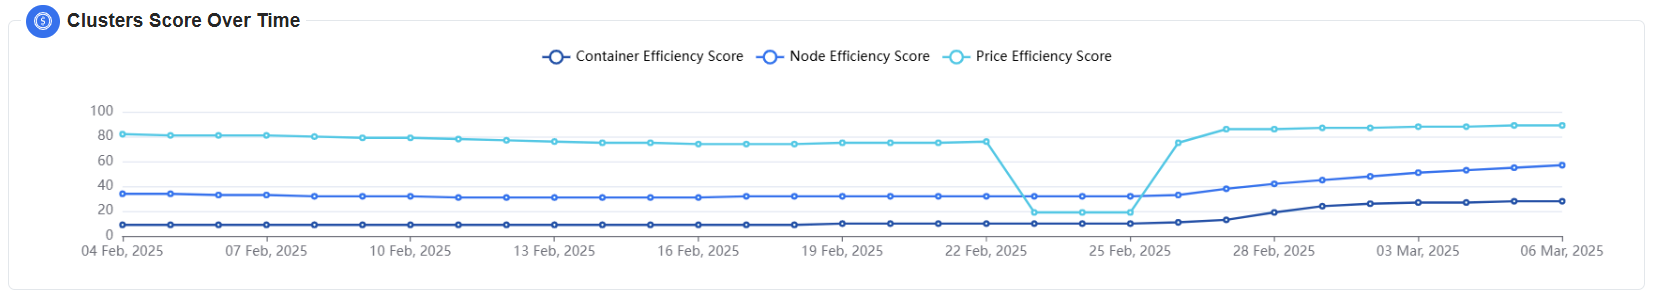
Cluster Score Over Time
See how your efficiency score changes over time. If you take optimization actions — whether manually or with nOps automation — this chart shows whether your cluster performance is improving or if further adjustments are needed.
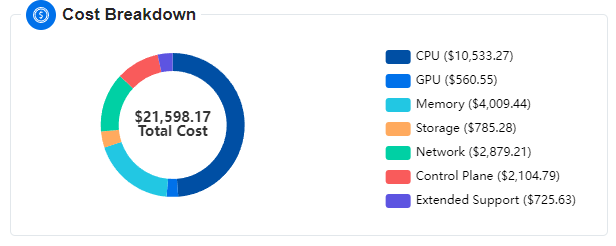
Cost Breakdown
See exactly where your spend is going and pinpoint unintended cost drivers — like extended support fees or networking costs.
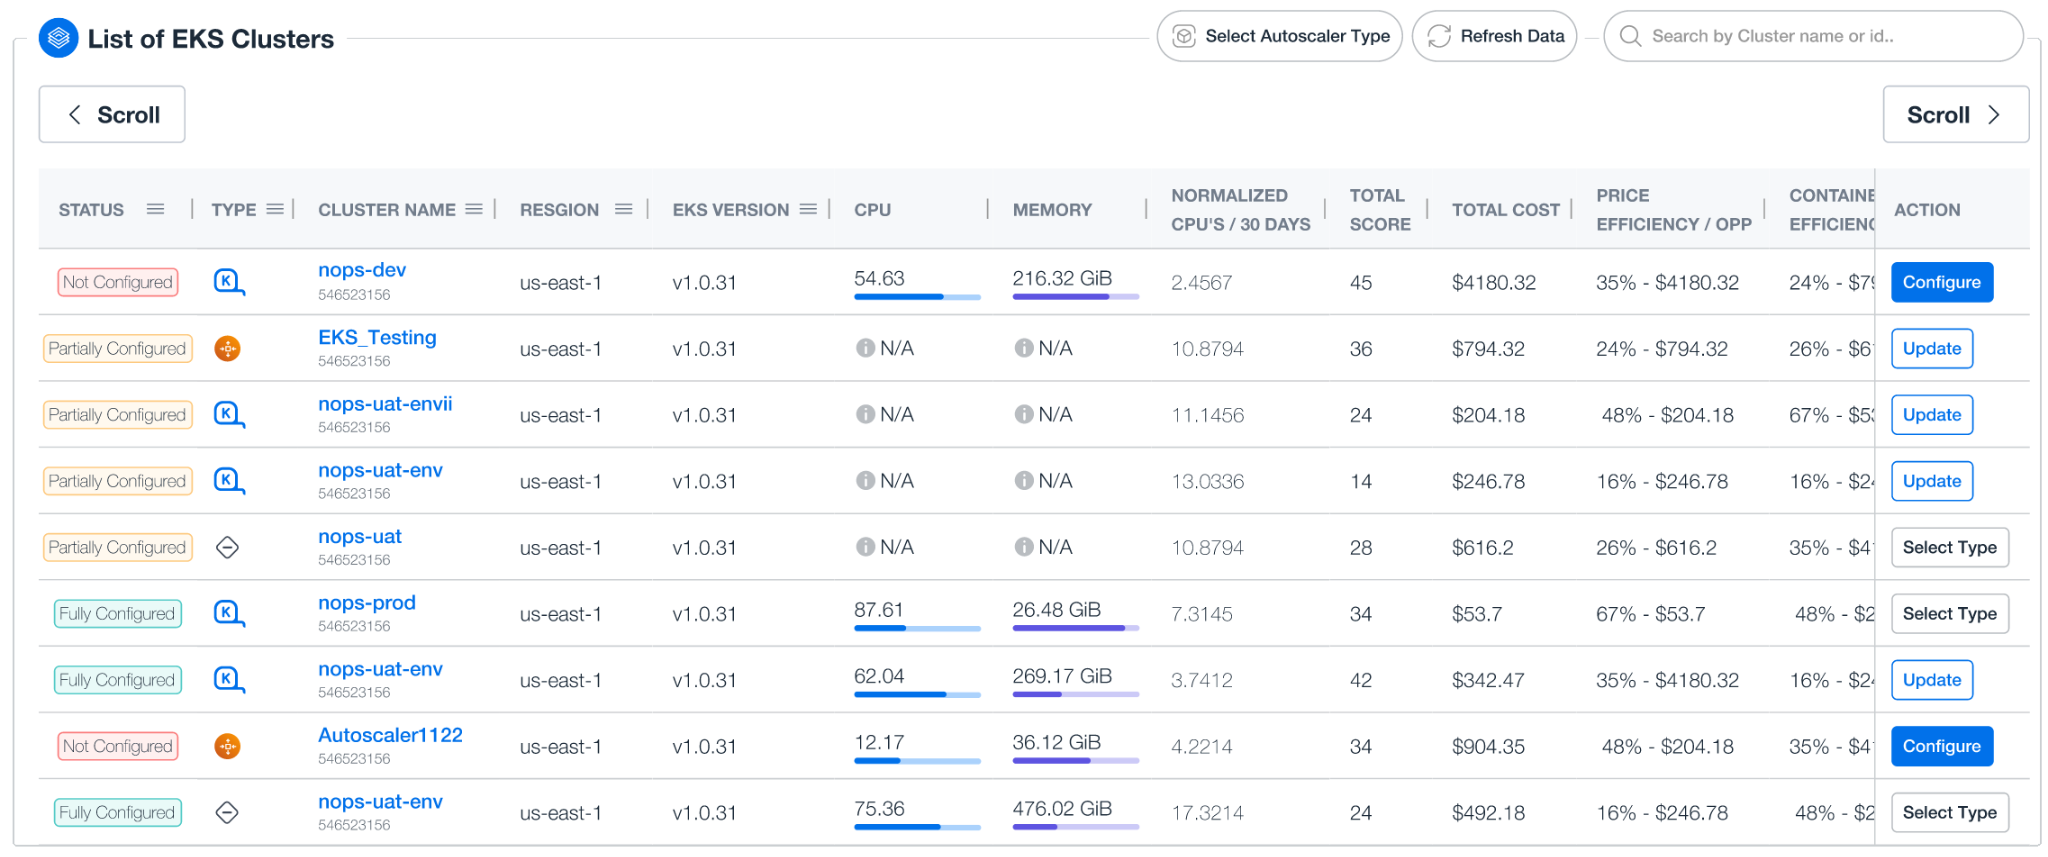
Drill Down Into Clusters
Filter the entire dashboard by individual cluster to quickly shift from overall insights to detailed cluster-level analysis. Instantly see how each cluster is performing, which clusters drive costs, identify container waste, idle nodes, and pricing inefficiencies, and translate these insights directly into optimization actions.
How it Works
The Compute Copilot EKS Insights Dashboard calculates an Overall Efficiency Score by averaging three key metrics: Container Efficiency, Node Efficiency, and Price Efficiency. Each score ranges from 0 to 100, helping teams quickly assess cluster performance and identify areas for optimization.
- Container Efficiency Score: Measures how well container resources are utilized. Calculated as actual usage divided by total allocated resources (usage + waste), with a cap of 80% to allow for operational flexibility.
- Node Efficiency Score: Evaluates how efficiently nodes are packed with workloads. Calculated as node usage divided by total node resources (usage + excess capacity), also capped at 80% to maintain resilience.
- Price Efficiency Score: Determines cost efficiency based on pricing model usage. Calculated as the proportion of total compute costs coming from Spot and commitment-based pricing rather than On-Demand instances.
How to Get Started
To start using the EKS Insights dashboard, navigate to Compute Copilot. Want more details? Check out our detailed documentation.
If you’re already on nOps…
Have questions about the new feature? Need help getting started? Our dedicated support team is here for you. Simply reach out to your Customer Success Manager or visit our Help Center. If you’re not sure who your CSM is, send our Support Team an email.
If you’re new to nOps…
nOps was recently ranked #1 with five stars in G2’s cloud cost management category, and we optimize $2+ billion in cloud spend for our customers.
Join our customers using nOps to understand your cloud costs and leverage automation with complete confidence by booking a demo with one of our AWS experts.