Skip to content


Public cloud spending is projected to be about $1.03 trillion in 2026, according to Forrester’s Public Cloud Market Outlook. To put that number in perspective, if a trillion pennies were stacked, they’d reach to the Moon and back twice.
This momentum is only growing. The FinOps stats below show how organizations are turning cloud spend into real, measurable value—and where many are still bleeding money.
Use the insights to benchmark your approach against what leading teams are doing today — let’s dive in.
What is FinOps?
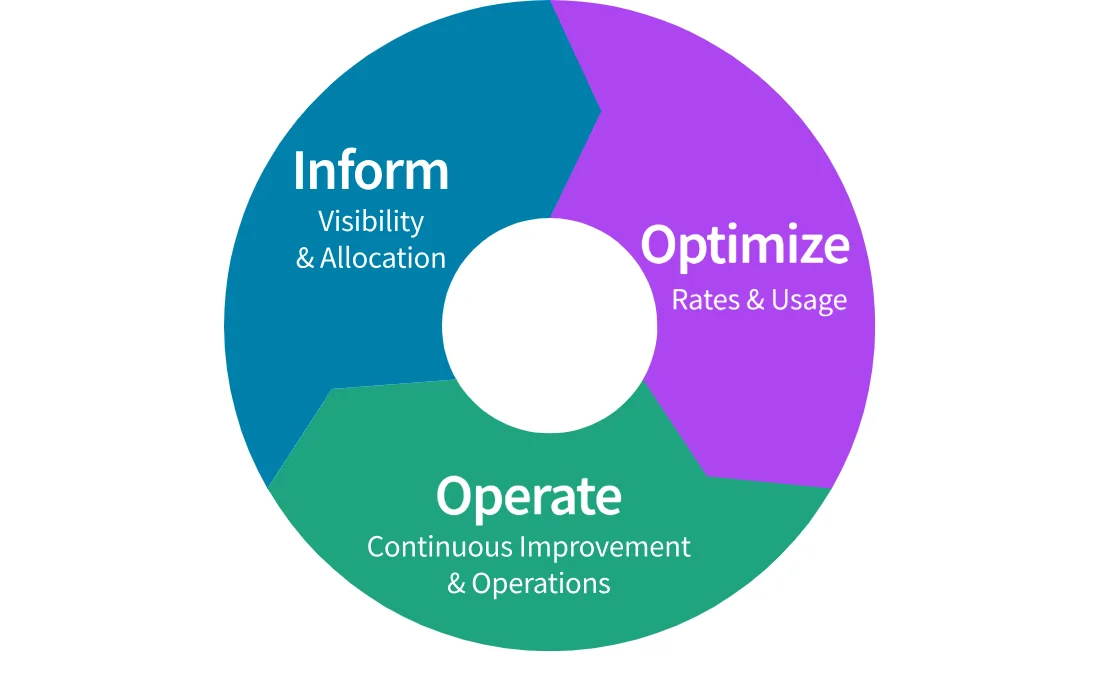
FinOps, short for Cloud Financial Operations, is a way for organizations to manage cloud spending with the same rigor they apply to any other major business investment. Instead of treating cloud cost as a finance-only problem, cloud FinOps makes it a day-to-day, cross-team practice where engineering, finance, and product share visibility and accountability.
At its core, FinOps helps teams answer three ongoing questions: what are we spending, why are we spending it, and what value are we getting back?
The State of FinOps in 2026
Before diving into our list of eye-opening cloud cost stats, let’s take a brief look at some of the biggest trends driving cloud cost complexity and overspending.
AI Spend is Skyrocketing
AI spending is going vertical, led by Microsoft, Amazon, Google, and Meta, who are scaling AI infrastructure and usage at a pace that’s remaking cloud demand. The key implication for everyone else isn’t just bigger bills—it’s that AI turns cloud into a far more volatile, performance-sensitive cost environment, where inefficient architecture, ungoverned usage, and idle capacity compound fast. In other words, as AI becomes the default growth engine from hyperscalers down to startups, cloud optimization stops being a “nice-to-have” savings play and becomes the only way to scale AI without bleeding margin.
FinOps is expanding beyond public cloud (Cloud+)
FinOps is pushing past public cloud into a broader “Cloud+” discipline. Concretely, that expansion is showing up in SaaS portfolios, software licensing, Kubernetes/container platforms, and increasingly private cloud and data-center spend—basically anywhere technology costs are growing fast and getting harder to attribute to business value. Once FinOps crosses into those areas, cost allocation becomes the foundation: if you can’t reliably tie spend to a product, team, or customer outcome, you can’t manage unit economics or make smart trade-offs.
FinOps teams are stretched thin — investment is climbing
As FinOps expands into Cloud+ and absorbs the shockwave of AI-driven spend, the workload grows faster than most organizations’ ability to staff for it. That pressure is pushing companies to invest in better tooling, automation, and upskilling. The practical takeaway is simple: 2026 rewards teams that scale FinOps through systems and automation, because manual cost management can’t keep up with the new shape and speed of cloud spend.
Optimization still #1
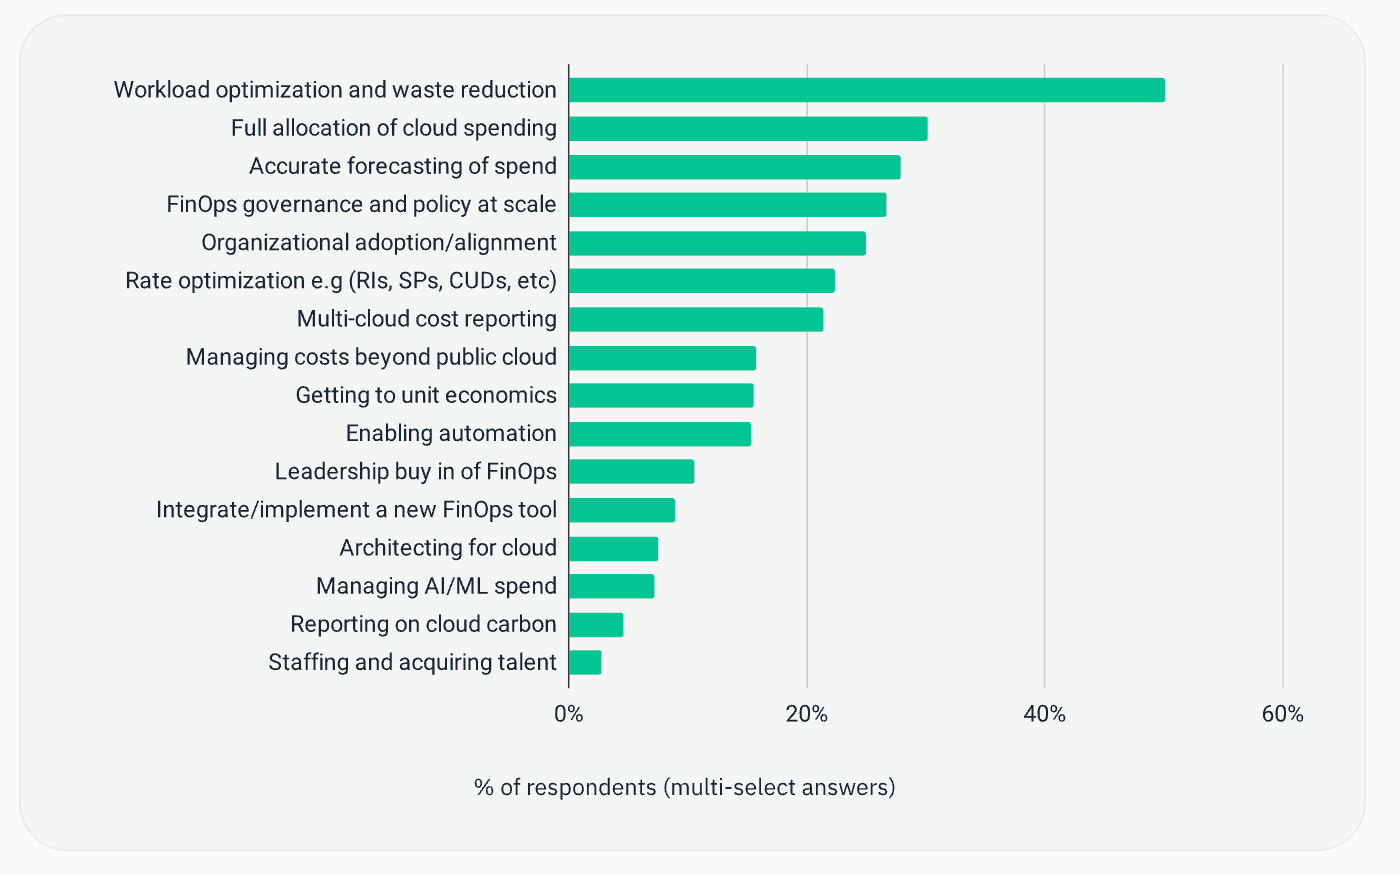
Optimization is still the #1 priority for FinOps practitioners, according to the most recent FinOps survey — with workload optimization and waste reduction ranked at the top of current practitioner focus. The 2026-specific reason is the climate cloud budgets are living in right now: boards are still in “efficient growth” mode after the cost-reset years, cloud is one of the biggest controllable opex lines left, and every finance leader wants proof that spend is disciplined before approving the next wave of capacity.
25+ Eye-Opening FinOps Statistics
Let’s take a look at some revealing FinOps statistics you should know right now.
Cloud Visibility Statistics
44% of organizations still report limited visibility into their cloud expenditure — despite the adoption of cloud-native and third-party tools. (Crayon via TechRadar).
As understanding your cloud investments get more complex with the rise of multi cloud costs, hybrid cloud environments, Kubernetes, AI, and SaaS, visibility is a huge challenge for cloud management. Many teams are looking for FinOps tools that can provide visibility for these various cloud services in one single pane of glass.
89% say that lack of cloud cost visibility has an impact on their ability to carry out their role (CloudZero).
Just under half report a significant impact, while only 11% said it has no impact at all. It’s not surprising — as visibility is the absolutely key, foundational step for starting your cloud cost management journey.
Only 43% of organizations track cloud costs at the unit level. In other words, most can’t see cost per product/customer/feature clearly. (Gartner May 2025 via TechRadar).
The implication? Most companies still can’t translate cloud spend into business language. Without the ability to break down spend by cost center, teams can’t tell whether growth is efficient or which products are actually profitable in the cloud—so optimization and budgeting stay guessy, and ROI oncloud resources gets harder to prove.
FinOps Statistics
A vast majority of tech executives (96%) agree that FinOps is important to their cloud strategy (NetApp).
That NetApp stat is basically the “FinOps is mainstream” signal: when nearly all tech execs say FinOps matters, it’s no longer an optional best practice—it’s a strategic expectation. But even though the debate has shifted from “can you do FinOps” to “how well can you do FinOps”, are teams meeting their goals for FinOps practices? Maybe not, according to our next stat, which reveals…
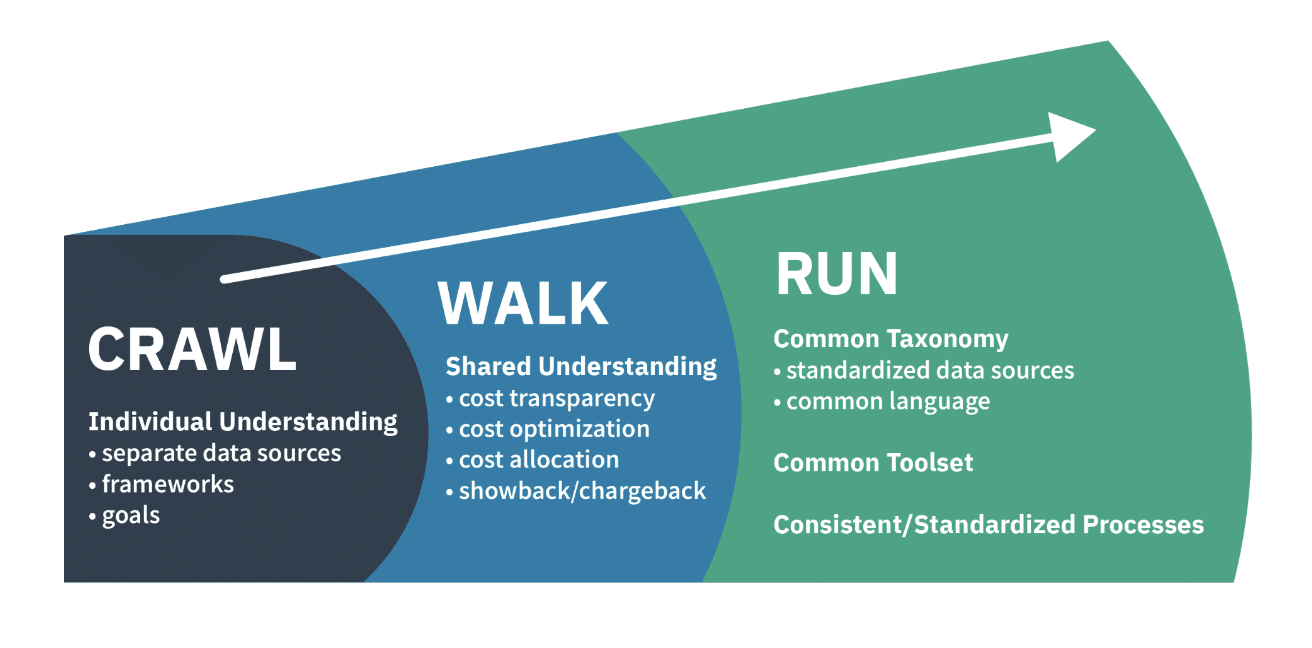
Only 14.2% of respondents are at “Run” maturity (i.e., mature/advanced) (FinOps Foundation), with 51.4% at “Walk”.
That maturity gap is the reality check: even though FinOps is now a strategic priority, only a small slice of organizations are truly operating it at an advanced level. The implication is that most teams are still building the basics when it comes to managing cloud costs—so there’s a huge competitive edge for companies that reach “Run” maturity first.
59% of organizations are expanding use of their FinOps teams to regain control over spending in 2025. In fact, the number of respondents that use, or plan to use, a FinOps team increased by eight percentage points year over year (Flexera).
“To stay on budget and accurately forecast for future needs, organizations need to fine-tune how to track and manage their cloud spend and use with FinOps now—or risk a significantly wasted investment,” said Jay Litkey, SVP of FinOps at Flexera.
FinOps tools can bear a considerable cost (around 3% to 5% of the cloud bill at the high end), according to Deloitte.
While FinOps tools can help you implement better cloud financial management and save overall, tool sprawl quickly becomes its own tax. That’s why more teams are gravitating toward end-to-end platforms that cover the full FinOps loop in one place.
Waste reduction is the top FinOps priority by a mile. 50% of practitioners rank “workload optimization & waste reduction” as their #1 current priority (FinOps Foundation — State of FinOps Survey).
While optimizing cloud resources and overall cost is still #1, the next priorities include cost allocation, accurate forecasting, adoption of FinOps practice and FinOps practitioners, as well as discount optimization.

Cloud Optimization and Waste Statistics
Only 2% of CIOs report spending less on cloud computing than they projected (CIO).
The implication is blunt: overspend on cloud technologies is the norm, not the exception, so forecasting and cost control can’t be treated as “nice-to-haves” but key priorities in your cloud adoption strategy.
42% percent of CIOs and CTOs in the US and UK reported resource utilization as the top cloud challenge today. (Zesty).
According to cost data, most cloud waste comes from resources you’re paying for but not fully using — like oversized instances, idle databases, underused Kubernetes nodes, forgotten dev/test environments, or capacity left running “just in case.” So if you improve utilization (rightsize, turn off idle stuff, autoscale properly, match capacity to real demand), you usually unlock the largest savings the quickest, without changing your product or slowing teams down. In short: use what you buy, stop buying what you don’t use.
55% of developers ignore cost management (Harness).
This stat may be shocking to finance teams, but unsurprising to engineers. Inadequate cloud cost optimization doesn’t just hurt the budget; it also sparks friction across teams when everyone has to scramble after the fact to explain surprise charges and figure out who owned the waste. When “shadow” usage feels like a constant tax, it’s no wonder that a majority of developers say cloud cost management isn’t the most rewarding topic to prioritize.
Only 19% of respondents reported that they have been able to make the most of discounted cloud purchase options (NetApp).
The basic problem is commitment: cloud providers give the best prices when you promise to use a certain amount over time, but many companies aren’t confident enough in what they’ll be running months from now to lock that in. So they either commit too little and miss savings, or commit too much and get stuck paying for capacity they don’t need.
Kubernetes Cost Statistics
Kubernetes has skyrocketed in popularity, with microservices and containers becoming the default way modern teams ship and scale software. And as Kubernetes adoption rises, so does the share of associated costs flowing through clusters—meaning containers are now a core cost surface.
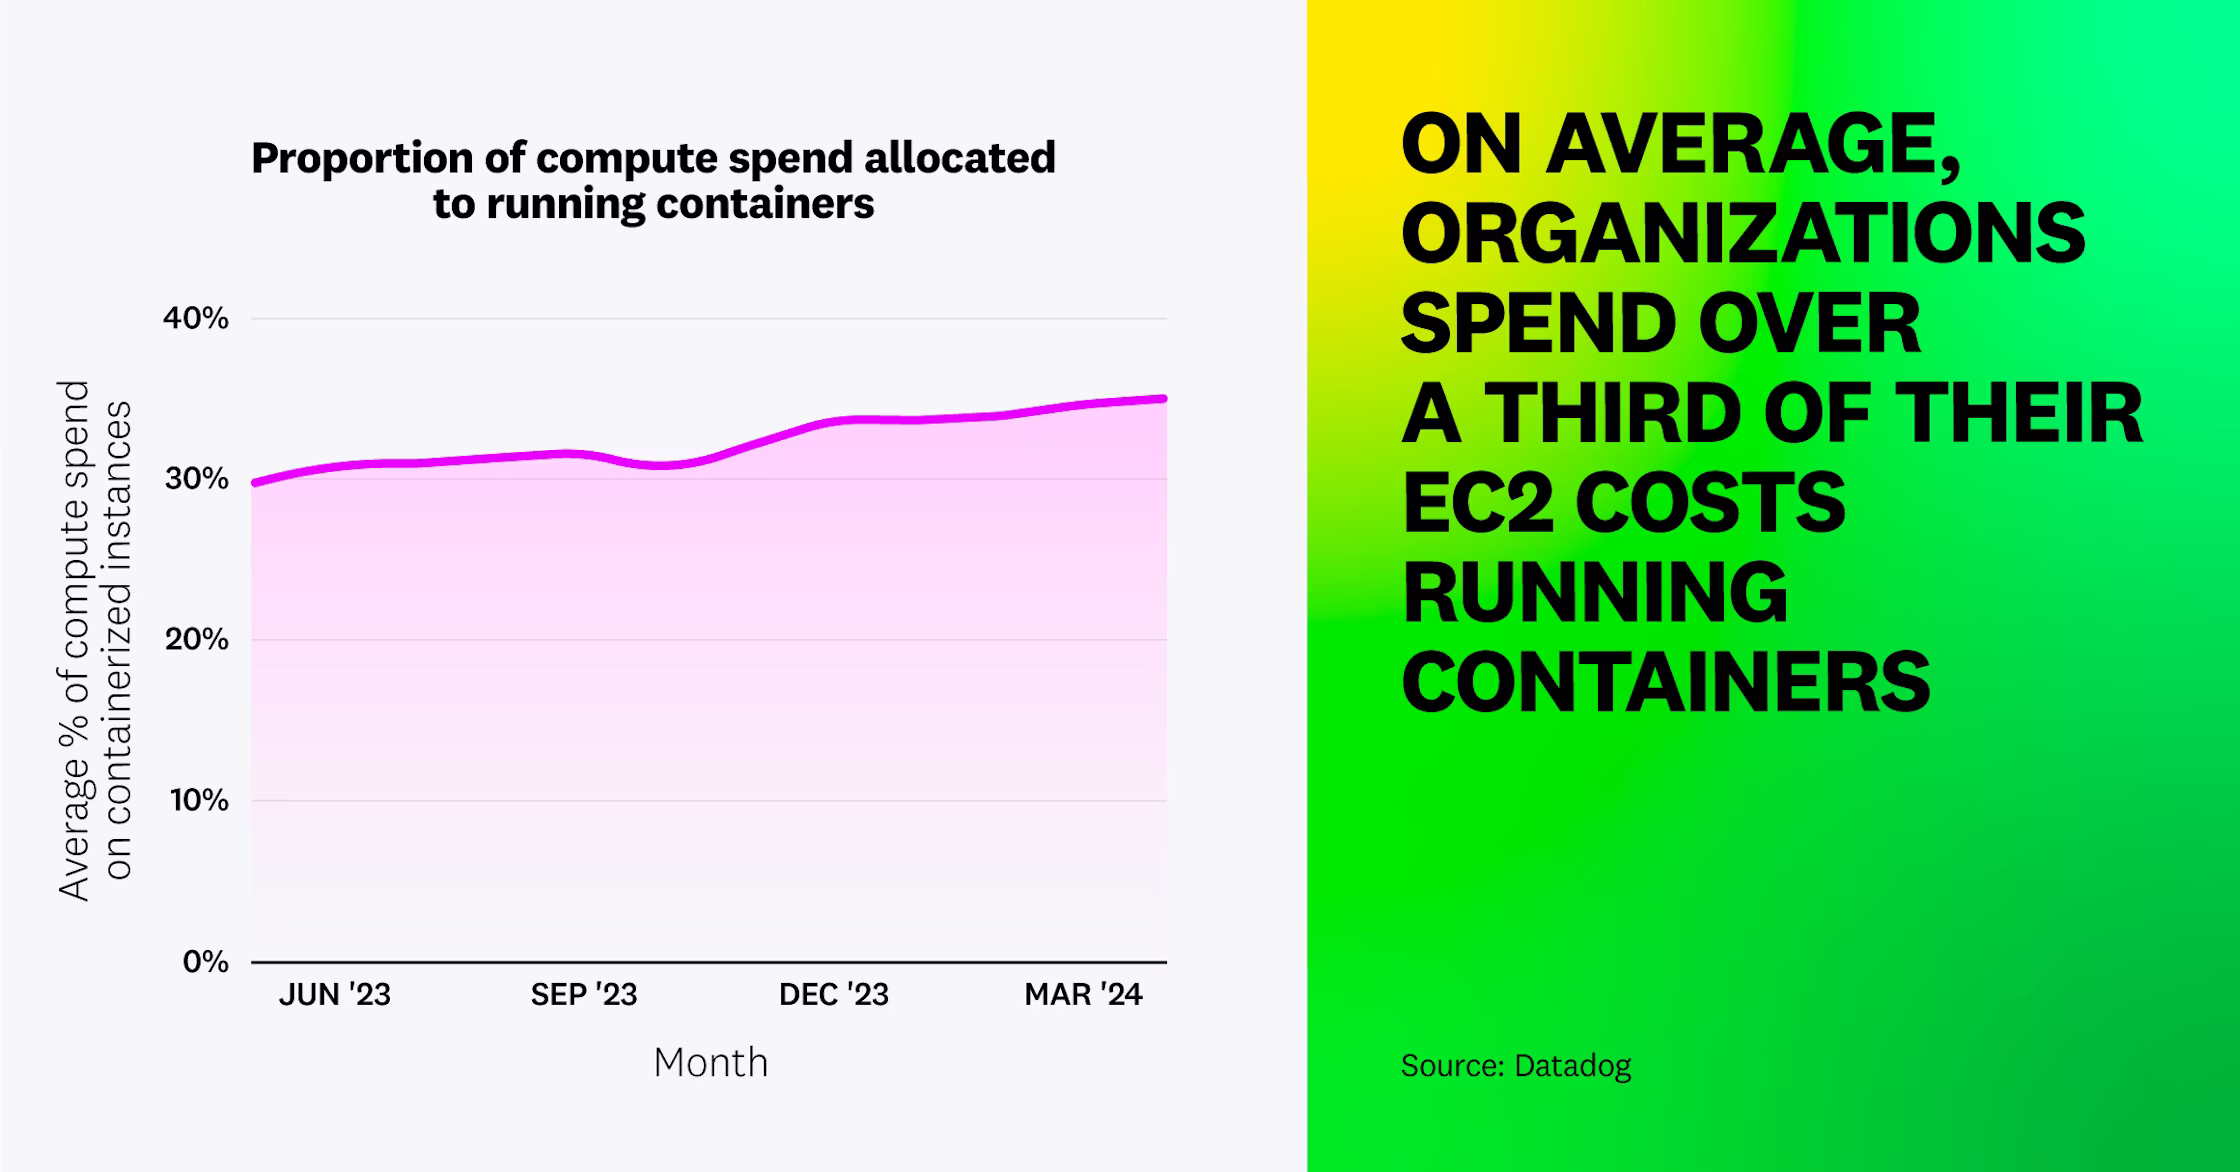
Container costs comprise one third of EC2 spend (Datadog).
Roughly 35% of organizations’ EC2 compute spending now goes to containers, up from about 30% the year prior.
98% agree that Kubernetes is becoming a major driver of cloud spend, but 91% remain unable to effectively optimize their Kubernetes clusters, signaling a critical blind spot as container adoption grows (CloudBolt).
It’s a visibility-to-action problem: nearly everyone knows Kubernetes is expensive, but very few can translate that awareness into concrete, repeatable savings inside clusters. As such, EKS optimization tools are becoming indispensable.
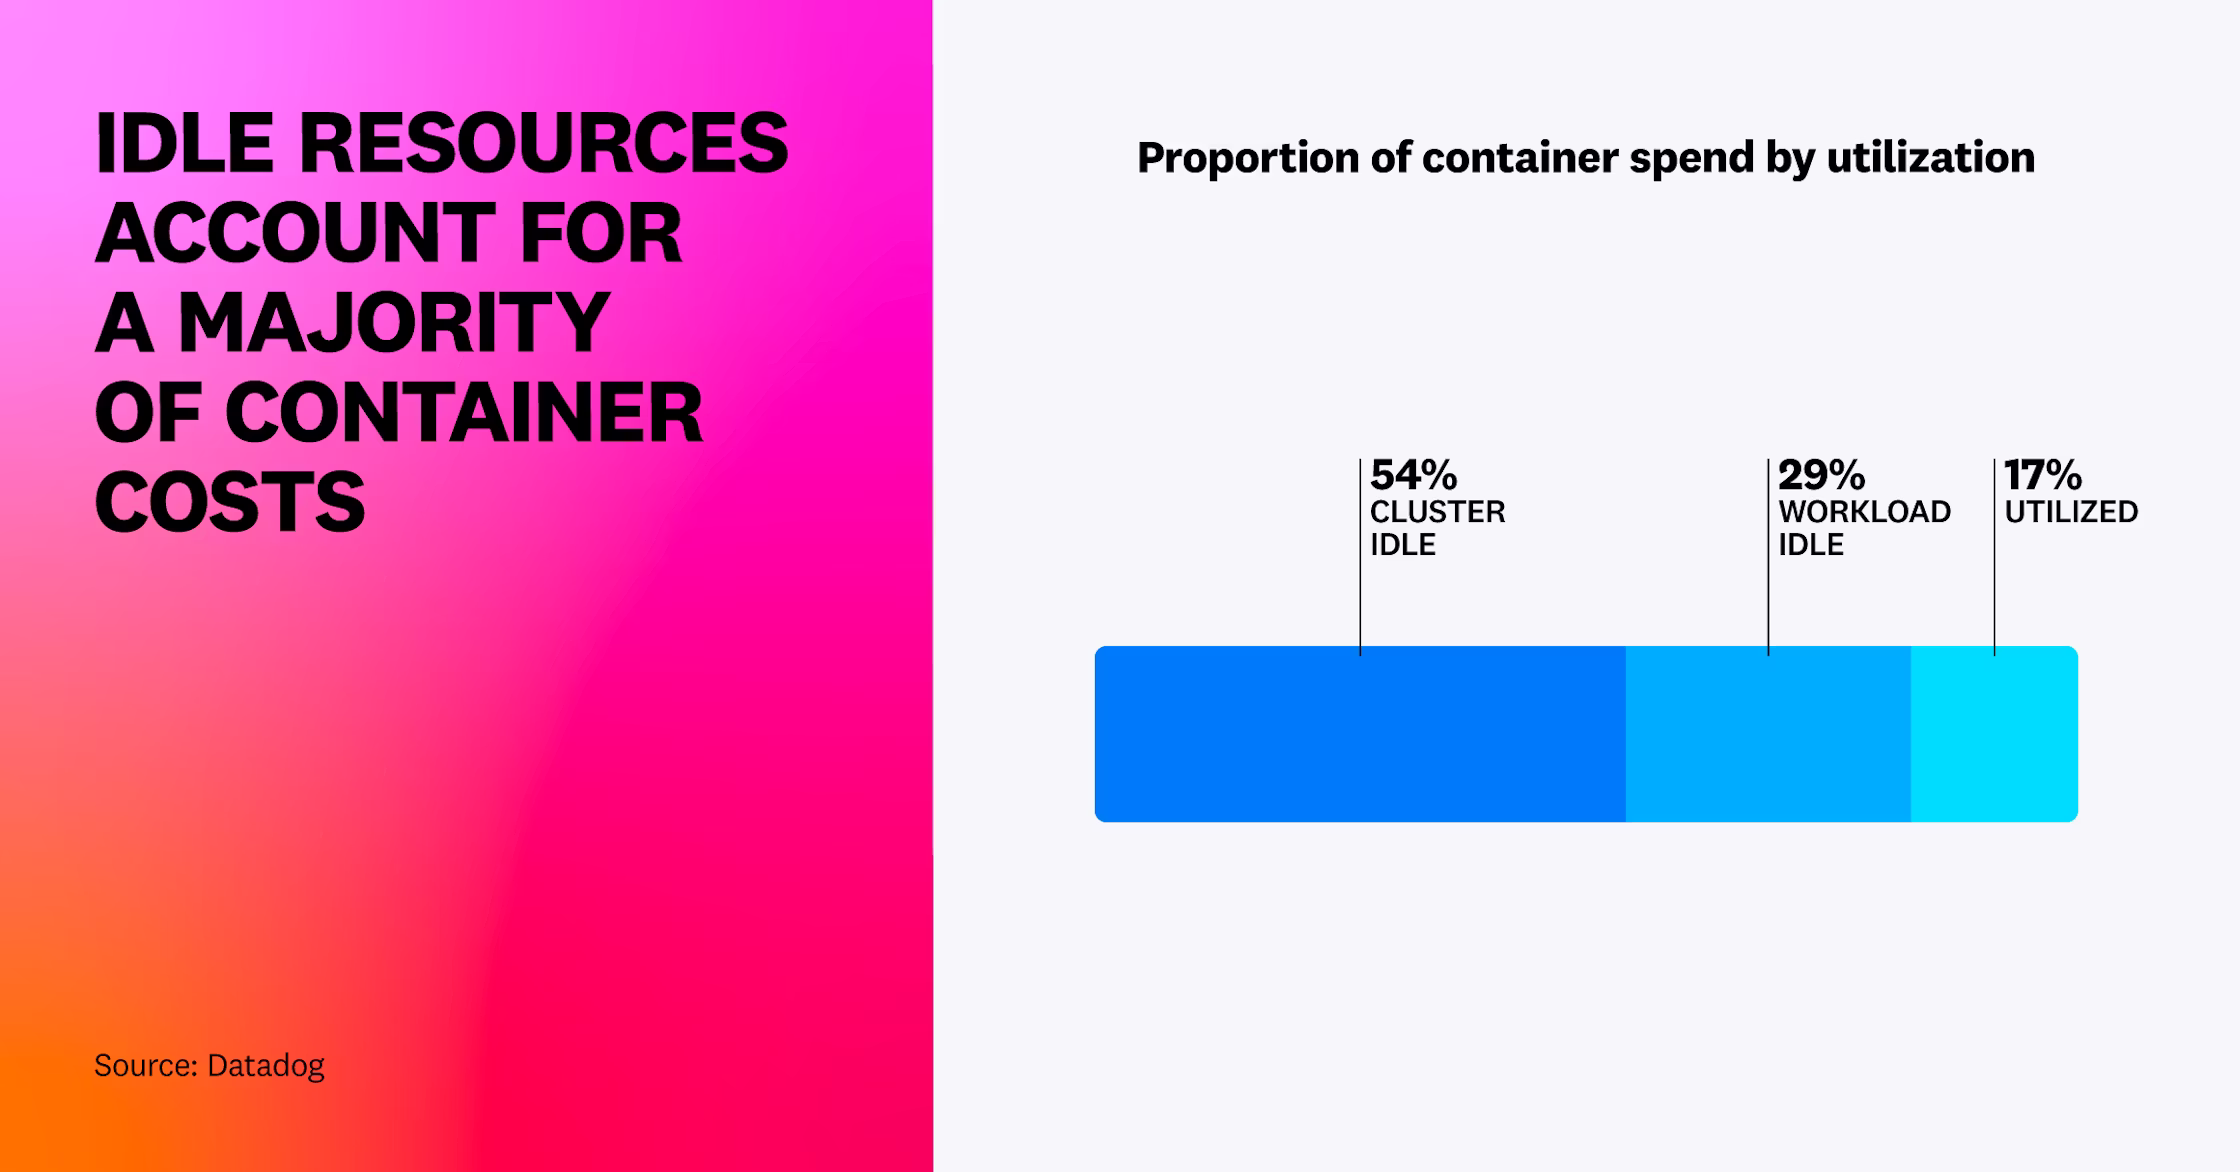
More than 80 percent of container spend is wasted on idle resources (Datadog).
This means there’s a huge opportunity for cost reduction by fixing overprovisioned clusters and inflated CPU/memory requests. These Kubernetes cost savings directly translate to improved cloud unit economics.
Kubernetes spend is rising fast: 68% of orgs said their Kubernetes-related costs increased in the last 12 months, and among those with increases, about half saw spend jump >20% year-over-year (CNCF).
The takeaway is that Kubernetes cost growth is now a default trend unless teams actively manage it.
Most teams still run K8s resource management manually: In a 1,317-practitioner survey, 56.5% said manual tools (kubectl/dashboards) are their primary way of setting requests/limits, vs. 32.2% using autoscalers (HPA/VPA) (Kube Today).
Manual tuning doesn’t scale — it’s slow, inconsistent, and usually leaves “padding” everywhere to avoid outages. That’s why so many clusters end up over-reserved by default, and why automation is increasingly the only realistic path to sustained Kubernetes efficiency.
AI Spending Statistics
89% of IT leaders plan to increase cloud budgets in 2025, citing AI workloads as the main reason (Wanclouds).
AI is forcing a budget reset—leaders should assume higher baseline cloud spend going forward and focus on making every new AI dollar accountable to a specific outcome.
AI isn’t just driving more overall spending, but also more cost inefficiency — 82% acknowledge that AI initiatives are increasing cloud complexity, with 45% strongly agreeing (Tech Monitor).
Teams can use optimization strategies such as model cost recommendations to automatically pick the most performant LLMs for lower costs.
Only 63% of orgs track AI spend in 2025, up from 31% the year before — meaning over a third still can’t even see AI costs clearly (CloudCostChefs).
AI cost governance is lagging adoption, which means the next competitive edge is basic visibility and ownership—if you can measure AI cost-to-serve, you can manage it.
68% of organizations will be taking on more cloud spending for GenAI over the next few years (Gartner).
That means it’s increasingly vital for your cloud cost management solution to cover AI visibility and optimization.
Cloud SaaS Spending Statistics
In 2025 the average company now uses 100+ SaaS apps (101–106 depending on dataset), the highest level ever recorded and 9% more than last year (Okta).
Every new SaaS layer adds another set of permissions, data flows, overlapping features, and renewal cycles, so the cost problem compounds along with the workflow mess. The takeaway is that SaaS scale now creates the same kind of complexity curve cloud did a few years ago: more tools doesn’t automatically mean more capability, but it does guarantee a harder-to-govern stack.
Companies use only about half of the SaaS licenses they buy — implying ~50% of SaaS license spend is wasted / unused (Zylo).
This is the license version of cloud idle spend: seats quietly pile up as teams grow, shift roles, or churn tools, and the waste hides inside “business as usual” renewals. As a result, companies fall behind in managing their SaaS spend.
Organizations are typically aware of only ~40% of the SaaS apps actually in use. That means ~60% of the portfolio is effectively “in the dark” (Gartner). If most companies can only see 40% of what’s in use, the biggest SaaS spend driver is invisibility, not price. The takeaway is that before anyone can optimize SaaS, they first have to surface the real footprint—otherwise every cost-control effort is working off a partial map.
The Future of FinOps
Global spending on public cloud services is expected to hit USD 805 billion in 2024 and is on track to double by 2028 (IDC).
Automation is the next FinOps unlock. If you want one place to manage, govern, and continuously optimize cloud spend as it gets more complex—AWS, Kubernetes, and now AI—nOps is built for exactly that. We automate the FinOps loop end to end, turning visibility into action so waste doesn’t have room to creep back in.
Our mission is simple: make FinOps easy to scale. Teams use nOps to cut cloud costs by 50% or more on autopilot, while improving forecasting, allocation, and commitment efficiency without adding tool sprawl.
Curious what that looks like in your environment? Book a demo call with one of our FinOps Experts to find out how much you can save today.
nOps manages $2 billion in cloud spend for our customers and is rated 5 stars on G2.