 Skip to content


Azure Cost Monitoring: Complete Guide to Track & Optimize Spend (2026)
Azure Cost Monitoring: Metrics, Tools, and Best Practices
Here’s a question that came up on r/devops back in February: “Do you actually monitor your Azure costs regularly?” Not which tool is best, not how to set up dashboards — just… do you even look? The answers were telling. Some teams had budgets, alerts, and regular audits. Others had basically nothing beyond the monthly invoice.
That’s a problem, because the money you don’t track is the money you waste. Flexera’s 2026 State of the Cloud Report pegged wasted cloud spend at 29% this year — up for the first time in half a decade. AI workloads and an ever-growing Azure service catalog are making costs harder to predict, not easier.
This guide breaks down Azure cost monitoring from the ground up: what it means, the metrics that matter, and native tools vs third-party platforms.
What Is Azure Cost Monitoring?
Why Azure Cost Monitoring Matters
Let’s talk about four reasons this matters for both the people building infrastructure and the people paying for it.
You need visibility into a fast-scaling footprint. Azure environments sprawl. New subscriptions pop up for projects. Dev/test environments linger way past their shelf life. Managed services accumulate in the background. Without monitoring, nobody has a reliable picture of total spend, let alone spend broken down by team or workload.
Budget control has to be proactive, not reactive. Looking at a bill spike often means sporadically dropping everything to find out what happened. Budget-based monitoring flips that — you set thresholds so alerts fire at 50%, 75%, 90% of expected spend. You get a warning, not sporadic cost-cutting fire drills.
Anomalies need to be caught fast. Azure’s cost anomaly alert system flags unusual spending patterns automatically using machine learning. Misconfigured autoscaling, forgotten PoC deployments, storage costs creeping upward — these things get caught. But there’s a gap. Native alerts tell you that something changed, not why. Knowing why is where teams actually save money.
Engineering and finance teams need to get on the same page. When both teams look at the same dashboards, conversations shift from “the bill is too high” to “here’s what we’re spending on X and here’s the tradeoff.” That shared understanding is the backbone of any real FinOps practice.
Key Cost Metrics to Track in Azure
Actual Cost
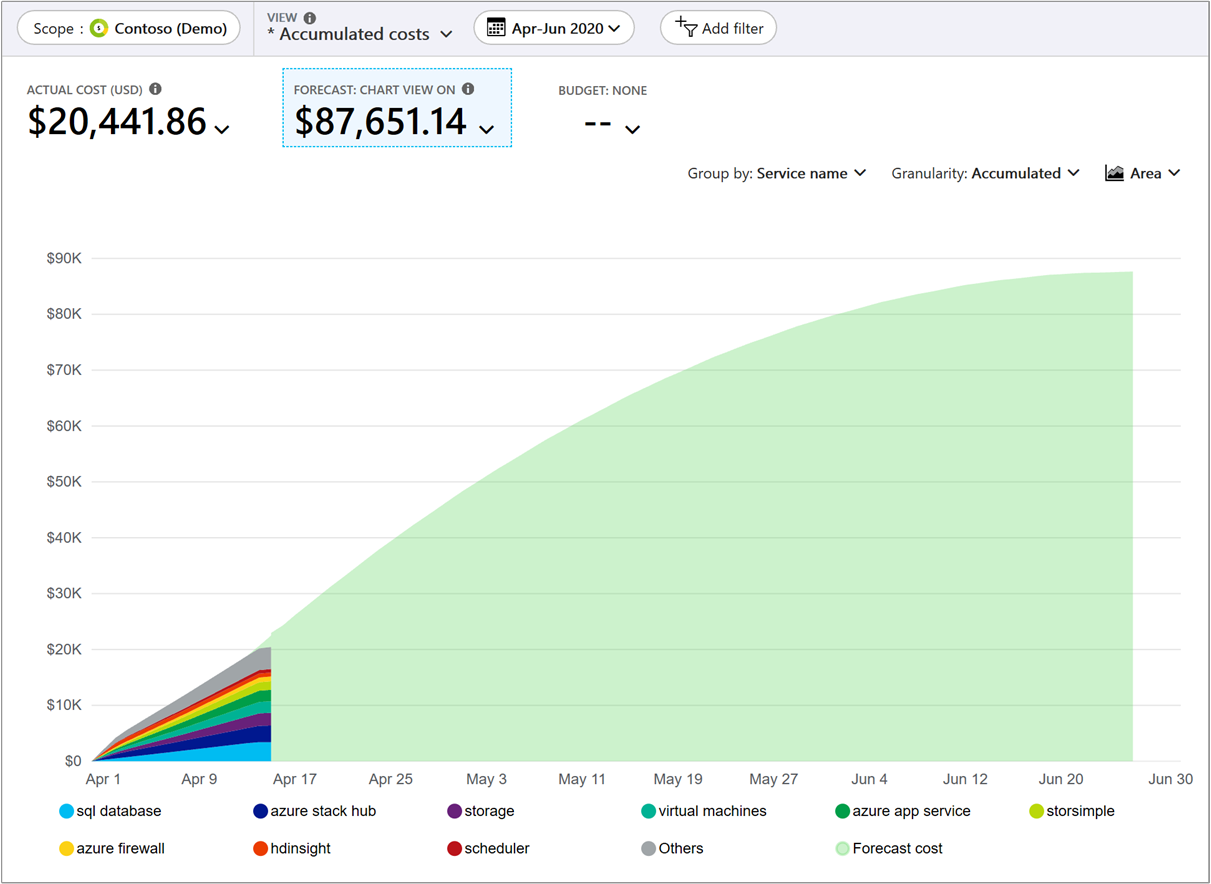
Forecasted Cost
Budget vs. Actual
Cost by Resource and Service
Cost by Tag (Team, Product, Environment)
Idle and Unused Resource Spend
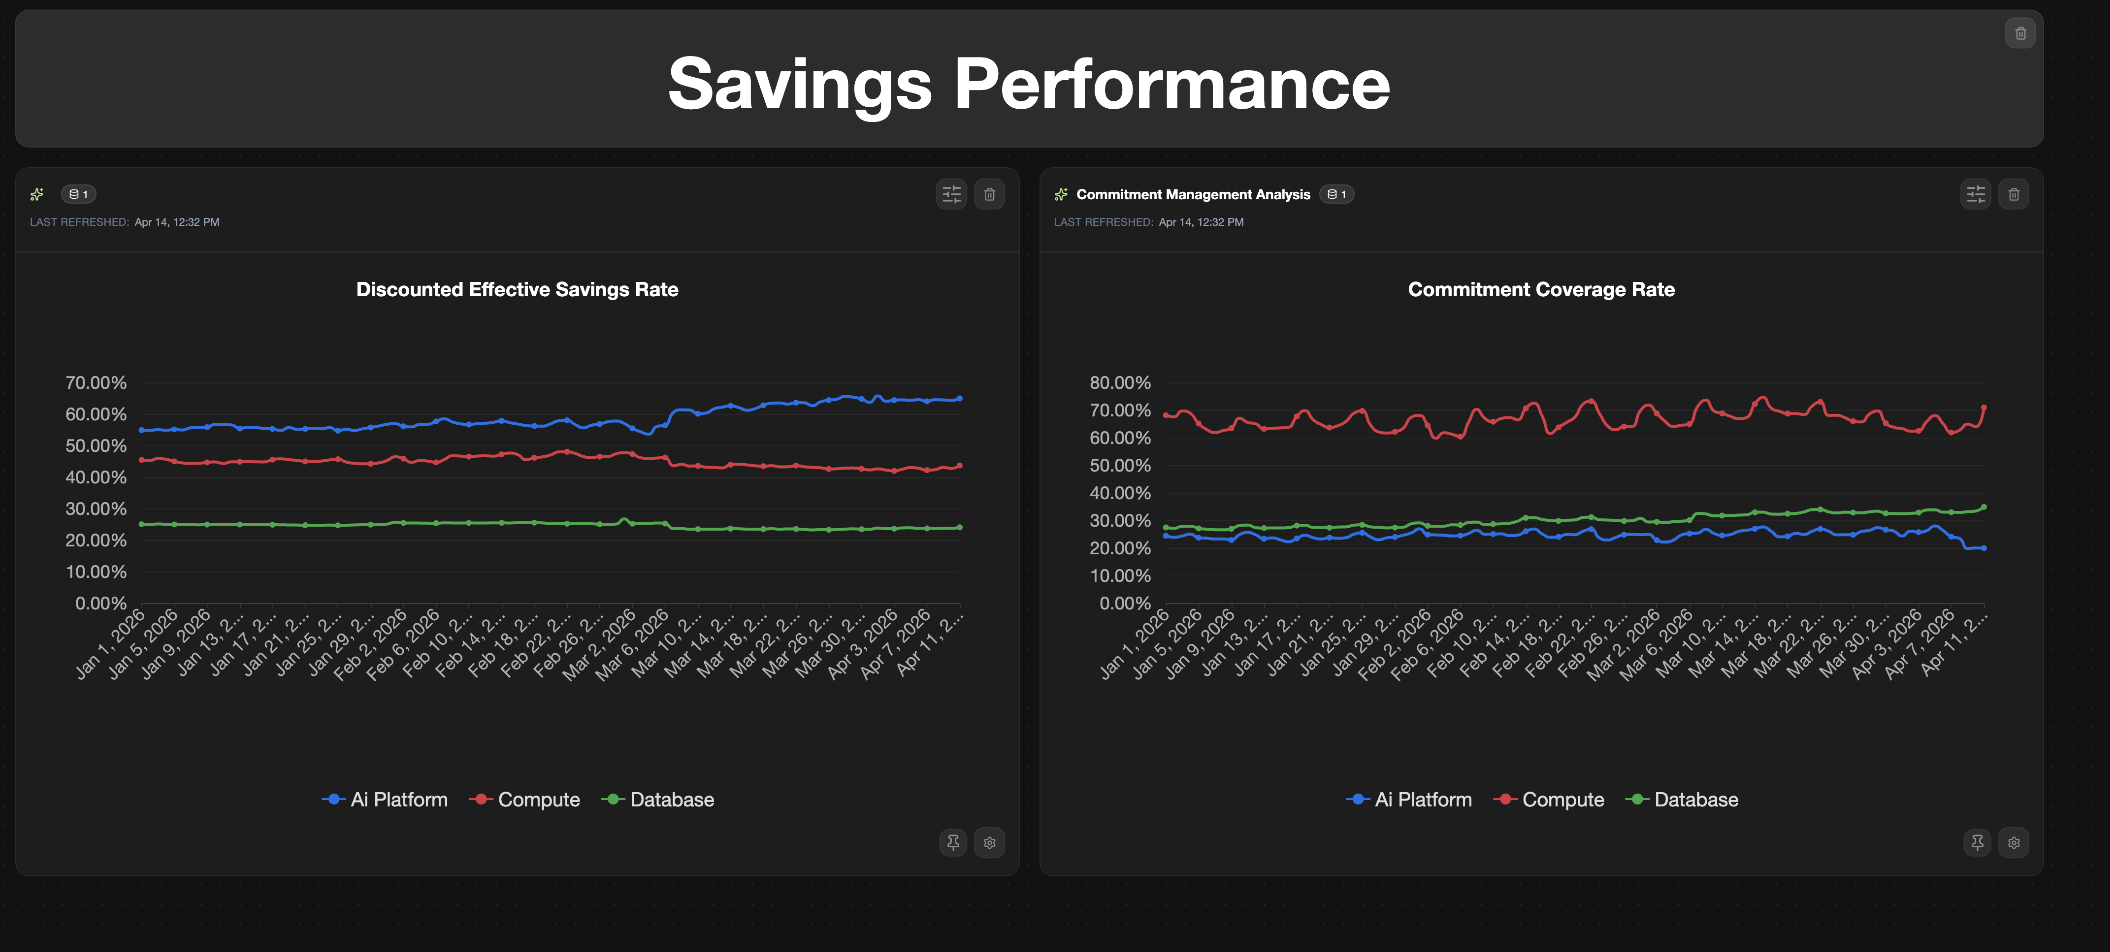
Commitment Coverage
How Azure Cost Monitoring Works
Four mechanisms work together under the hood.
- Billing data collection: Azure captures billing data at the meter level for every resource and feeds it into Azure Cost Management, typically with an 8–24 hour delay. For Enterprise Agreement (EA) and Microsoft Customer Agreement (MCA) customers, that data can include negotiated rates, commitment discounts, and amortized cost views.
- Usage tracking: Separate from billing, Azure tracks how much of your provisioned capacity you are actually consuming — CPU, memory, storage I/O, and network throughput. This is what helps teams spot the gap between what they are paying for and what they are using, with Azure Monitor and Azure Advisor surfacing that log analytics data at different levels of detail.
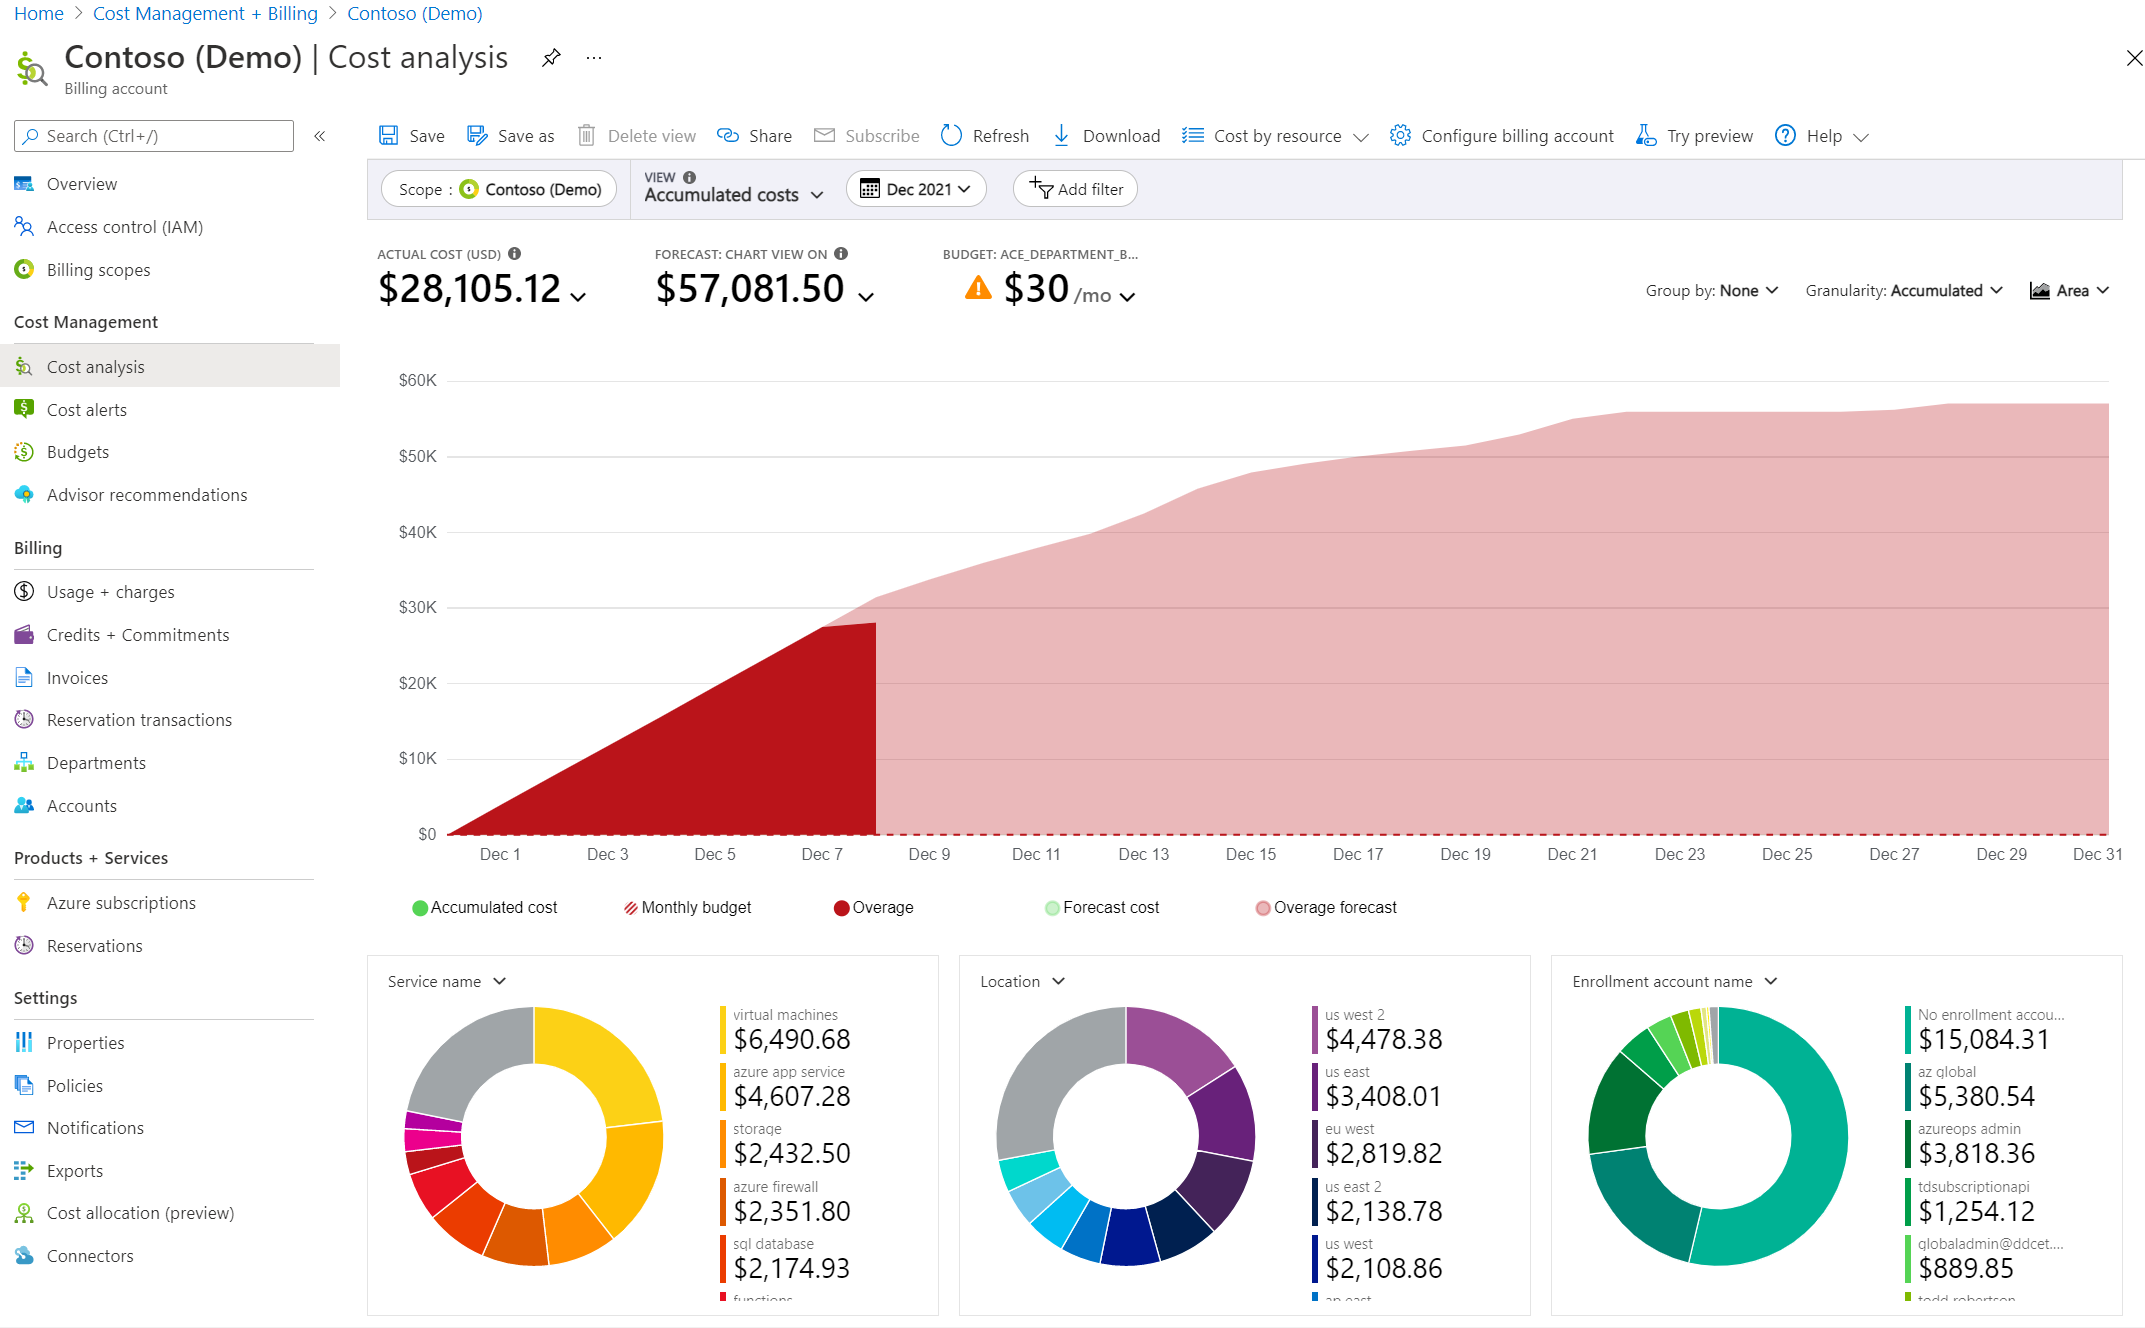
- Dashboards and reporting: Azure Cost Management provides built-in cost analysis views for daily spend trends, service-level breakdowns, and amortized cost reporting. Teams can create custom views, pin them to dashboards, and schedule exports, though recurring stakeholder reporting often still requires manual spreadsheet and screenshot work.
- Alerts and anomaly detection: Cost alerts fire when spend crosses thresholds you define, while anomaly alerts use machine learning to detect unusual cost patterns automatically.
Native Azure Tools for Cost Monitoring
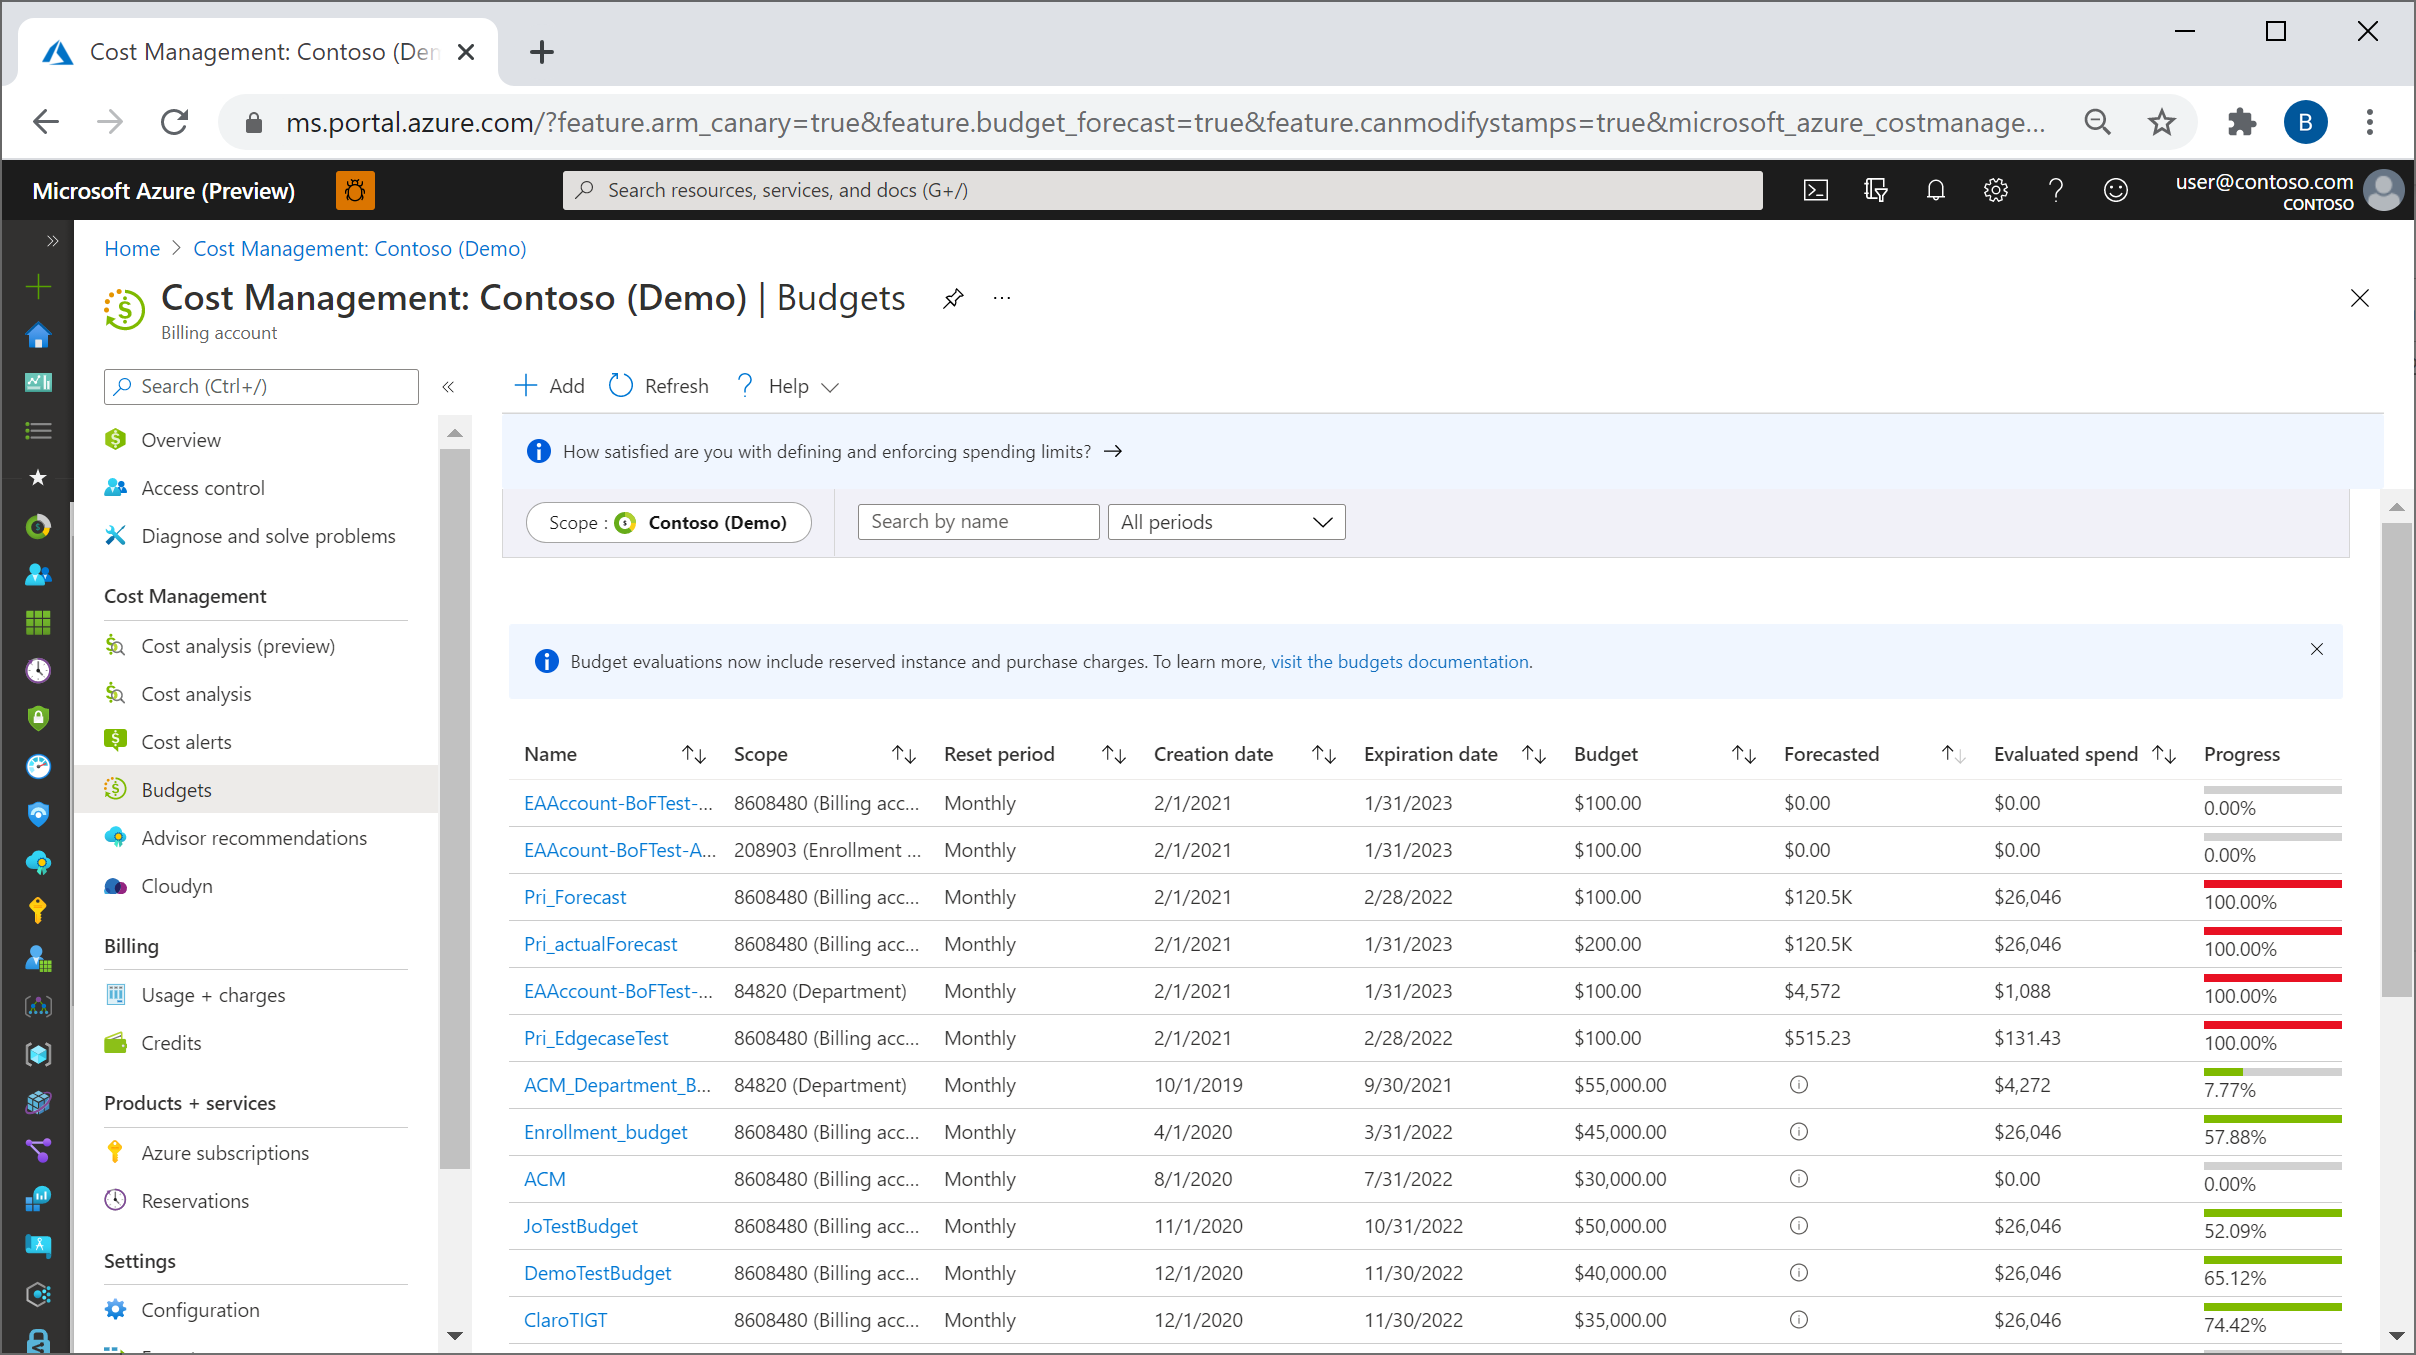
Azure Cost Management + Billing
This is the most basic Azure cost monitoring tool. Cost analysis views let you filter by subscription, resource group, service, tag — pretty much any dimension. Forecasting shows where you’re headed relative to budget. Cost alerts ping you when spending crosses a line. Cost allocation rules can split shared costs across teams, even for untagged resources. For organizations with minimal Azure spend, this free tool is often sufficient.
Azure Budgets
You create a budget at the subscription or resource group level — monthly, quarterly, or annual. Set a dollar figure, then configure alerts at 50%, 75%, 90%, 100%. Those alerts can send emails, trigger Action Groups, or kick off Logic Apps (like auto-shutting non-prod VMs when you hit 90%). Simple mechanics, but surprisingly effective as a first line of defense.
Azure Advisor
Common Azure Cost Monitoring Challenges
The native tools are solid for getting started. But they hit walls as your environment grows.
Tagging falls apart without enforcement. Tag-based cost allocation is only as good as your tag coverage. In practice, teams tag inconsistently — different naming conventions, missing tags on resources created in a rush, legacy resources with no tags at all. Azure Policy can enforce tagging at creation time, which helps. However, retrofitting tags on thousands of existing resources can be extremely time-consuming without automation.
Multi-subscription environments get messy fast. Enterprise Azure setups can span dozens — sometimes hundreds — of subscriptions across multiple billing accounts. Getting a unified, business-oriented view requires Management Groups or external tooling. We saw this firsthand in a recent customer conversation where an Azure subscription had been moved between billing accounts three times, and tracking costs across those moves required manual digging through billing scopes.
No cross-cloud visibility. If you’re only using native Azure tools but also running AWS, GCP, AI, Kubernetes or SaaS spend, you end up with separate dashboards, separate budget processes, and no consolidated view of total cloud spend.
Reporting takes too much manual effort. Often dashboards look good for ad-hoc analysis — drill down, filter, pivot. But producing a report for finance or leadership can often take hours each week spent on formatting, toggling and interpreting.
Tools for Advanced Azure Cost Monitoring
Native tools handle visibility and basic alerting. But as you scale up and your FinOps practice matures, you’ll hit the ceiling on what they can do — especially around automation, support across multiple cloud providers, and acting on cloud cost optimization recommendations without manual work.
nOps
nOps is a AI-powered platform that offers autonomous rate optimization for Azure, AWS, and GCP. It stands out for its savings-first pricing model and automated commitment management.
Key features:
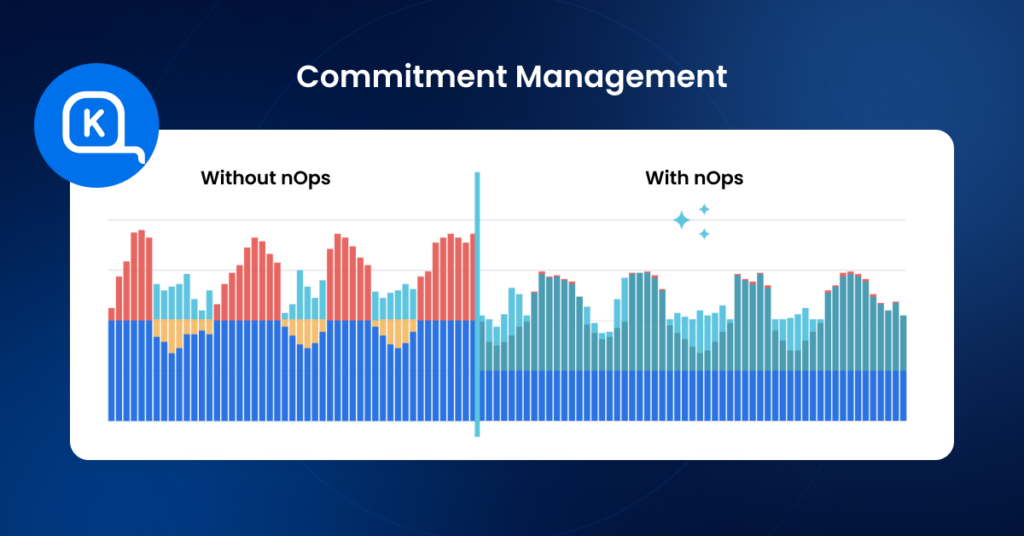
1. Autonomous rate optimization: Automatically manages Azure Savings Plans and RIs with 100% utilization guarantee, eliminating manual commitment purchasing decisions
2. Multi-cloud visibility: Unified dashboards for Azure, AWS, and GCP with business context grouping by product, team, feature, or customer
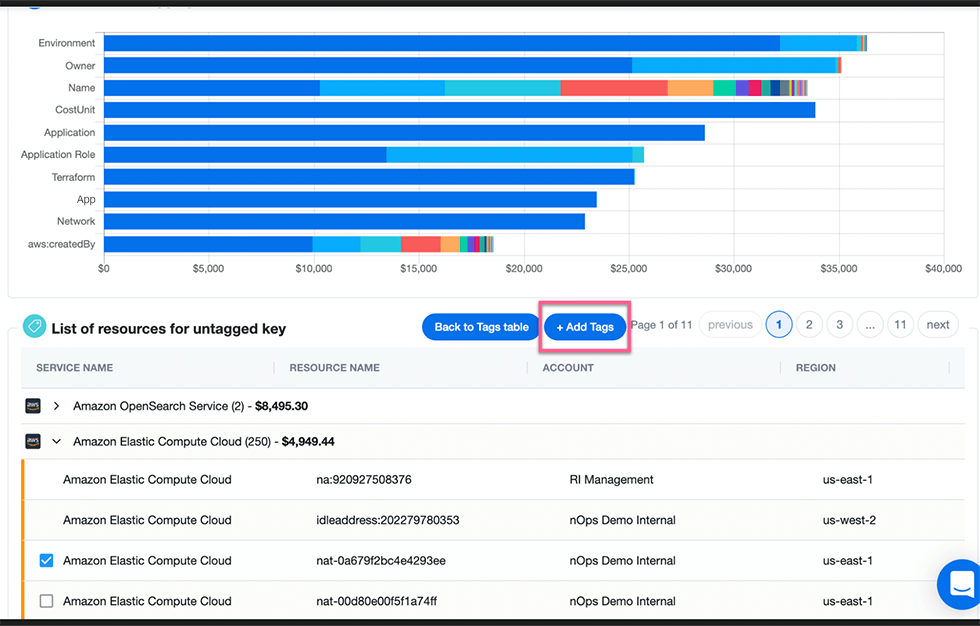
3. Cost allocation without extensive tagging: Maps cloud spend to business units using code-level analysis rather than requiring comprehensive resource tagging
Azure optimization capabilities:
Here at nOps, we provide Azure rate optimization through adaptive commitment management. We continuously analyze usage patterns and incrementally adjust Savings Plans to track demand—avoiding the risk of over-committing on annual purchases. For organizations with unpredictable workloads, this approach delivers significant savings without long-term financial risk.
Best use cases:
Organizations with multi-cloud environments seeking unified Azure cost visibility
Teams that want automated commitment management without operational overhead
Companies seeking a risk-free pricing model (nOps only charges after delivering measurable savings)
Pricing: Flat fee for cost visibility. Savings-first pricing for commitment management (share of savings delivered). No upfront cost or long-term commitment required.
The Bottom Line:
You get automated commitment management that adapts to your actual usage patterns
You eliminate the manual overhead of tracking, rebalancing, and forecasting commitments
You pay nothing upfront — our savings-first model means we only earn when you save
Book a demo to get a free savings analysis of your AWS/Azure/GCP spend.
CloudZero
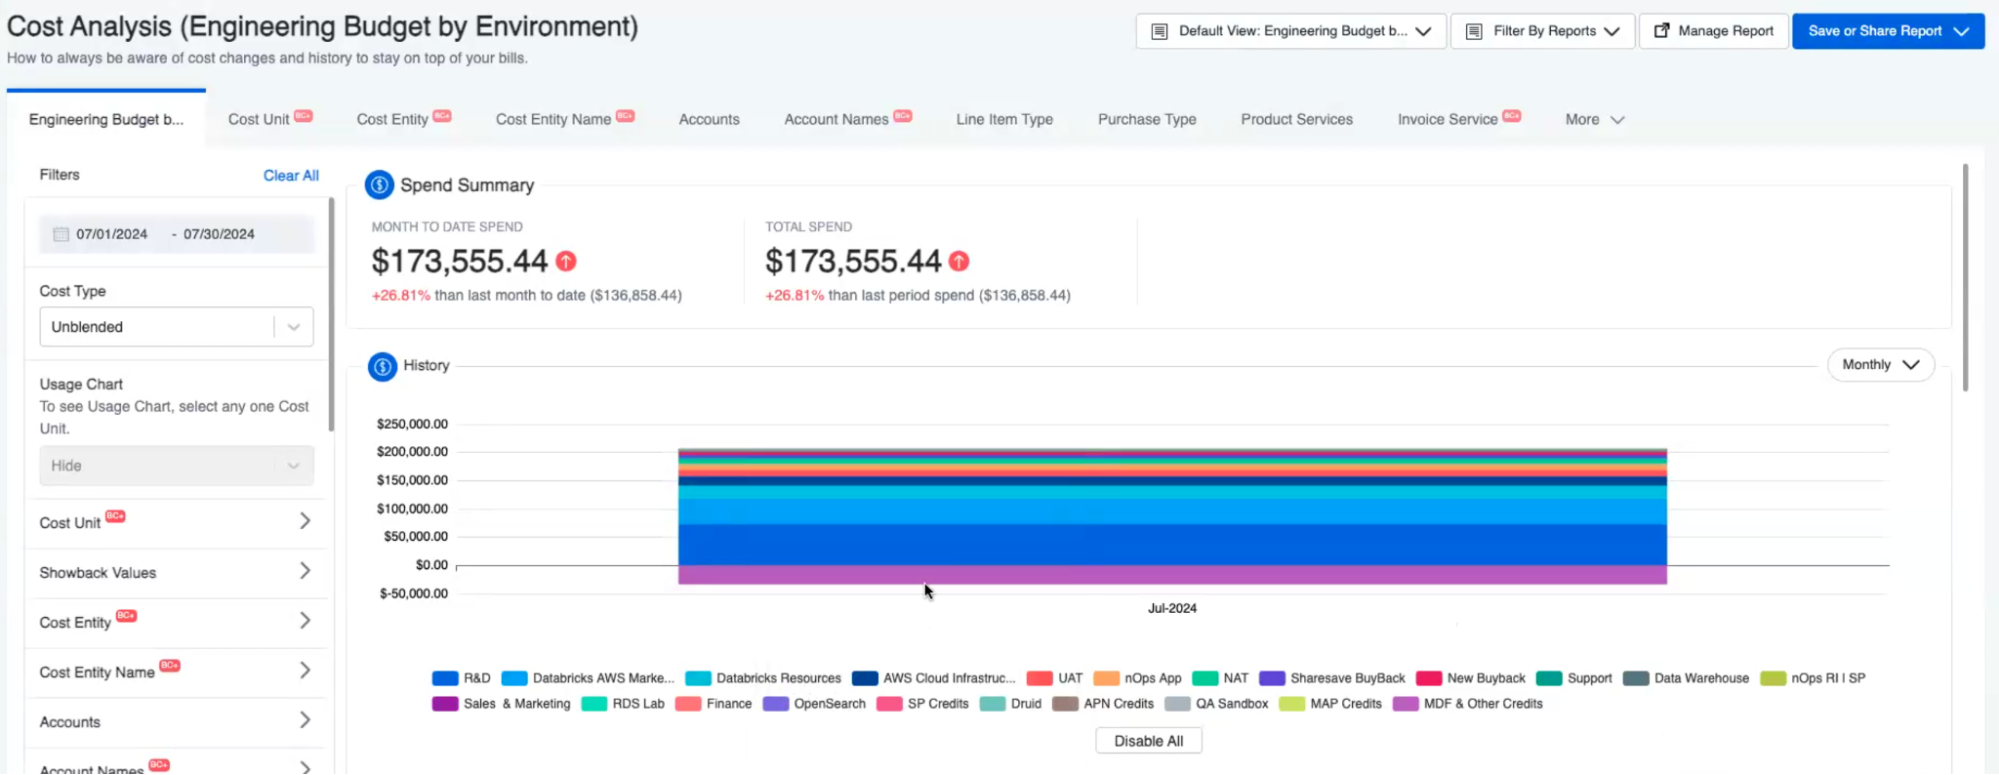
CloudZero focuses on engineering cost intelligence — mapping cloud spend to business dimensions like products, features, teams, and individual customers rather than just infrastructure categories.
Key features:
1. Unit cost analytics: Translates raw Azure, AWS, and GCP spend into cost-per-customer, cost-per-feature, and cost-per-deployment metrics that engineering and product teams can actually act on
2. Tag-independent allocation: Maps spend to business units using telemetry and code-level analysis, reducing dependence on comprehensive resource tagging
3. Anomaly detection with engineering context: Alerts surface cost changes tied to specific deployments, features, or customers — not just generic “spend went up” notifications
Best use cases:
SaaS companies that need to get unified visibiity with less emphasis on automated cost optimization
Pricing: Based on percentage of spend.
Cloudability (Apptio/IBM)
Cloudability, now part of IBM’s Apptio suite, is built for enterprise-scale FinOps programs — the kind with dedicated FinOps teams, complex chargeback models, and governance requirements across hundreds of accounts.
Key features:
1. Full cost allocation with container support: Allocates 100% of cloud spend — including shared Kubernetes clusters and AI/ML workloads — back to business units for chargeback and showback
2. Commitment optimization recommendations: Analyzes Reserved Instance and Savings Plan coverage across AWS, Azure, and GCP, and recommends purchase strategies based on historical usage patterns
3. FinOps maturity and benchmarking: Provides organizational benchmarking against industry peers and tracks FinOps practice maturity over time
Best use cases:
Large enterprises with dedicated FinOps teams and complex multi-account, multi-cloud environments that need primarily effective Azure cost monitoring without necessarily automation to implement cost saving measures
Pricing: Subscription-based, percentage of spend managed. Contact Apptio for enterprise pricing.
Azure Cost Optimization is better with nOps
Across the tools in this guide, commitment optimization remains one of the largest savings levers in Azure. nOps focuses on maximizing that lever automatically — increasing your effective savings rate without adding operational overhead. And, we only get paid after delivering you measurable savings.
In 2026, “good enough” means you’re likely leaving money on the table. We’ve talked to companies that can save millions on their cloud bills by switching to nOps from competitors.
There’s no risk to book a free savings analysis to find out if nOps can help you get more value out of your cloud investments.
nOps manages $4B+ in cloud spend and was recently rated #1 in G2’s Cloud Cost Management category.
