 Skip to content


AI Cost Visibility: The Ultimate Guide
Generative AI workloads bring cost challenges traditional cloud monitoring wasn’t built for. Token-based pricing, GPU saturation, and multi-tenant architectures can make it extremely challenging to align costs with features, teams, or customers.
This guide explores how to build visibility into every layer of your AI stack—from API calls and token usage to GPU utilization and storage I/O. Learn why AI workloads demand a different approach to cost management, what metrics to track, and how to design systems that allocate costs accurately and respond to spikes before they escalate.
Part 1: The Importance of Cost Visibility in AI
Most cloud cost monitoring tools weren’t built for AI’s unique demands. In a traditional cloud setup, the math is simple: CPU hours, storage, and network traffic flow neatly into billing systems. But AI workloads introduce entirely new dimensions—tokens, GPU utilization, provisioned throughput units (PTUs), and vector database I/O—each with wildly different pricing models. Add multi-tenant deployments where multiple teams or features share the same GPU clusters, and it becomes nearly impossible to align costs with specific business units or use cases using legacy tools.
This gap leaves FinOps teams in reactive mode. They discover cost overruns days—or weeks—after they’ve occurred, often without a clear picture of which model, feature, or customer triggered the spike. For AI-driven SaaS products, that lack of granularity is especially risky. A single unoptimized prompt or an over-provisioned training run can balloon costs before alerts ever fire.
The need for granular, real-time insights into tokens, compute, and storage costs
AI cost management requires visibility at the finest granularity—down to individual API calls and token usage. Unlike traditional workloads where you might manage a fleet of identical VMs, AI systems are volatile by nature. A feature launch or prompt tweak can send token traffic soaring by an order of magnitude. Without tracking input and output tokens per endpoint or tagging model calls by feature, teams are flying blind.

| Cost Dimension | Why It Matters | Key Metrics to Track |
| Token Consumption | API calls are billed per token; inefficient prompts inflate costs | Input/output tokens per call, per feature |
| GPU/TPU Utilization | Expensive accelerators often sit idle without workload alignment | Instance hours, saturation %, power draw |
| Provisioned Throughput | Unused reserved capacity is sunk cost | Utilization ratio, hourly effective rates |
| Storage & I/O | Vector DB and dataset storage drive hidden costs | Read/write volume, egress fees, tier usage |
| Model Invocation Latency | Slow or failing endpoints can lead to retries and fallback to pricier models | P50/P95/P99 latency, error rates |
| Multi-Tenant Allocation | Without proper tagging, shared resources create chargeback blindspots | Requests tagged with tenant_id, cost by team/use case |
Part 2: Key Metrics for AI Cost Visibility
Let’s dive into five critical AI cost metrics.
1. Token Consumption by Endpoint or Feature
| Metric | Why It Matters | Example |
| Input/Output Tokens per Call | Token-heavy prompts inflate costs rapidly | A chatbot prompt rewrite reduced tokens per call by 35%, cutting monthly API spend by $12K |
2. GPU/TPU Utilization and Saturation Metrics
AI workloads burn through GPU hours—but many clusters sit idle for hours, wasting expensive reserved capacity. Tracking GPU saturation (active vs. provisioned time) helps avoid paying for unused hardware. Include metrics like GPU memory usage, power draw, and instance hours to assess efficiency.
Tip: Correlate GPU utilization with business hours and workloads. If GPU clusters show low utilization during off-peak times, consider scheduling shutdowns or shifting batch jobs to cheaper Spot instances.
3. Model Invocation Latency and Error Rates
Latency and error metrics often get overlooked in cost discussions, but they’re critical. Slow or failing endpoints trigger retries, increasing token use and compute costs. Monitoring P50/P95/P99 latencies and error rates per endpoint lets teams identify underperforming models or infrastructure bottlenecks before costs balloon.
Tip: Set graduated alert thresholds (green/yellow/red) based on latency and error trends. Tie them to automatic scaling or fallback logic to lower financial impact.
4. Cost Segmentation by Deployment Tier
Mixing production, staging, and development workloads in the same cluster is a recipe for cost attribution nightmares. Segmentation—via environment tags (env=prod, env=dev) and separate inference profiles—enables clear chargeback and showback reporting.
Tip: Enforce tagging policies at the infrastructure level to prevent untracked workloads from slipping into production clusters and eating up reserved capacity.
5. Provisioned Throughput and Reserved Capacity Utilization
| Reserved Resource | Risk of Waste | Optimization Strategy |
| GPU Block Reservation | Idle during non-peak hours | Scale down at night; use Spot for burst loads |
| PTU Subscription | Overprovisioned for current demand | Rightsize after 90-day trend analysis |
Part 3: Instrumenting AI Workflows for Visibility
1. Centralized Telemetry Pipelines: Making Costs Observable
Every API call, GPU workload, and vector database query needs a telemetry breadcrumb to track its cost impact and determine the cause of billing spikes.
Start with the API gateway: ensure every model call carries metadata tags like feature_id, tenant_id, and model_version. Pair this with distributed tracing (e.g., OpenTelemetry) to follow token requests through backend systems and infrastructure layers. For GPU-heavy workloads, integrate with Kubernetes or Slurm to collect pod-level metrics: GPU memory utilization, job duration, and power draw.
Key capabilities of centralized telemetry:
- Request-level tracing for token consumption
- Workload-level monitoring for GPU/TPU saturation and idle time
- Environment segmentation to separate prod, staging, and dev costs
- Multi-tenant attribution for SaaS scenarios with shared clusters
Real-world tip: in Kubernetes, enforce telemetry injection with mutating webhooks and validate tagging compliance at deploy time using OPA/Gatekeeper.
2. Application-level tagging and metadata strategies for multi-tenant environments
| Tag Category | Tag Key | Purpose | Example Values |
| Project Metadata | project_name | Identifies the AI project or application. | GenAI_Chatbot, ImageGen_API |
| project_owner | Tracks ownership for accountability. | data_science_team, ml_ops_team | |
| Environment | environment | Distinguishes environments for cost segmentation. | prod, staging, dev, sandbox |
| Workload Type | workload | Differentiates types of AI workloads. | model_training, batch_inference, real_time_inference |
| Resource Type | resource | Classifies resource types to monitor cost drivers. | GPU_node, TPU_cluster, API_gateway, Vector_DB |
| Tenant/Customer | tenant_id | Allocates costs to specific customers in multi-tenant systems. | acme_corp, widget_inc |
| customer_tier | Highlights customer priority levels for resource usage. | enterprise, SMB, free_trial | |
| Feature | feature_name | Maps costs to specific product features or APIs. | summarization_api, code_completion |
| Cost Center | cost_center | Enables showback/chargeback reporting by organizational unit. | marketing_AI, R&D_AI, customer_support_AI |
| Criticality | criticality | Flags workloads for prioritization in optimization or throttling. | high, medium, low |
| Shutdown Eligibility | shutdown_eligible | Marks resources safe for scheduled shutdowns. | true, false |
| Compliance | data_sensitivity | Tracks regulatory requirements for data processed by AI workloads. | pii, non_pii |
| compliance_tag | Notes compliance frameworks tied to workloads. | gdpr, hipaa, none |

3. Batch Job Instrumentation: Capturing the Hidden Costs
Batch jobs—whether for fine-tuning models, ETL pipelines, or large-scale inference—are often invisible in traditional monitoring setups. Yet they’re notorious for burning GPU hours during idle periods or over-provisioned runs.
To close this visibility gap, instrument batch workflows to surface cost drivers and inefficiencies:
- Job Duration vs. Active Compute Time: Track the ratio of total job runtime to active GPU or CPU usage. Long idle periods often indicate inefficient scheduling or resource over-provisioning.
- GPU Hour Consumption: Break down GPU time by job and task. For example, fine-tuning runs often include lengthy data preprocessing phases that don’t require high-end accelerators but still occupy them.
- Dataset I/O Metrics: Monitor read/write operations to vector databases and object storage. Heavy I/O during batch jobs can trigger unexpected egress charges, especially when data is spread across regions or clouds.
Real-world tip: In Airflow, annotate DAGs with metadata like cost_center and job_priority for downstream cost attribution. In Kubeflow, use Prometheus metrics to capture GPU/memory utilization per pipeline step and expose these in centralized dashboards.
Additionally, consider implementing cost-aware orchestration policies:
- Throttle non-critical batch jobs during peak hours to free GPUs for real-time workloads.
- Schedule low-priority jobs on Spot instances where feasible to lower costs without sacrificing SLA-critical pipelines.
- Use admission controls to block untagged or unscheduled batch workloads that could monopolize resources unexpectedly.
4. Infrastructure-Level Enforcement: Guardrails for Cost Awareness
Instrumenting workflows isn’t enough if rogue workloads can bypass policies. Build cost-awareness into the infrastructure itself:
- Admission Controllers: Block untagged pods or resources during deployment to enforce tagging standards and avoid cost attribution gaps.
- IAM Tag Enforcement Policies: Require cost center, environment, and workload tags on all resource creation to ensure full traceability for chargeback and showback reporting.
- Budget Threshold Alerts: Automatically flag untracked resources or idle GPU clusters consuming reserved capacity, enabling teams to intervene before costs escalate.
- Cost Center Labeling: Align resources with organizational units, teams, or features to drive accountability and support granular chargeback models.
Part 4: Dashboards and Alerts for AI Costs
Dashboards and alerting systems for GenAI cost management must go beyond surface-level metrics. In a multi-tenant AI environment, token usage and GPU workloads shift dynamically based on feature rollouts, model updates, and customer demand patterns. To maintain visibility, FinOps teams need dashboards capable of ingesting and correlating telemetry from API gateways, inference endpoints, and backend systems. This means tracking input and output token counts per request, associating them with metadata such as feature_id, tenant_id, and model_version, and aggregating the data across workloads and environments for granular reporting.
GPU saturation metrics—active utilization versus provisioned capacity—should be plotted alongside token consumption to surface inefficiencies like over-provisioned clusters or idle reserved instances. Storage I/O telemetry, particularly for vector databases and cached datasets, adds another layer of context to cost attribution. These dashboards must also segment data by environment (development, staging, production) and support multi-tenant chargeback models by enforcing tagging compliance at resource creation.
Alerting systems likewise require an upgrade for GenAI workloads. Static budget thresholds fail in environments where usage volatility is normal. Instead, organizations should deploy graduated alert levels with context-aware triggers: green for baseline operations, yellow for anomalous patterns (e.g., token consumption exceeding a historical rolling average by 2σ), and red for critical conditions like runaway training jobs or untagged resources consuming GPU hours. Alerts should integrate with orchestration layers (e.g., Kubernetes admission controllers or serverless functions) to support automated mitigations like throttling, dynamic scaling, or preemptive workload termination.
Part 5: Challenges and Considerations
AI Cost Optimization with nOps
Below, we break down the top challenges engineering and FinOps teams face when managing large-scale generative AI deployments.
1. Fragmented and Evolving Pricing Models Generative AI services combine token-based pricing for API calls, GPU hour billing for training and inference, storage costs for datasets and vector indexes, and data egress fees—all wrapped in dynamic, provider-specific SKUs that change without notice. This heterogeneity makes it nearly impossible to establish a unified cost model. For instance, a single prompt may incur input token charges, output token charges, GPU time for inference, and additional vector database query costs. FinOps teams must develop sophisticated cost decomposition pipelines to break down these elements per feature or tenant, and reassemble them for total cost of ownership (TCO) reporting. Without this, organizations face a dangerous lag between usage spikes and financial recognition in billing systems. These challenges are exactly why AI model provider recommendations are critical—they enable teams to evaluate alternate models based on cost, performance, and usage patterns before committing to high-cost providers.
Multi-Tenant Cost Attribution Gaps In multi-tenant architectures where multiple features or customers share GPU clusters, isolating costs per tenant becomes a thorny problem. Traditional tagging strategies break down when workloads are highly dynamic, ephemeral, or containerized. Even when tags are applied, missing or inconsistent metadata creates “dark spend” that’s difficult to attribute. Tools like Kubernetes admission controllers or AWS Bedrock inference profiles can enforce tagging at deployment, but retroactive attribution often requires merging telemetry from API gateways, vector databases, and GPU orchestration layers. For SaaS platforms, these gaps undermine the ability to charge back costs fairly and can result in massive cross-subsidization between customers.
Real-Time vs. Batch Processing Visibility AI systems mix real-time inference APIs and batch processing workflows (e.g., nightly retraining or batch ETL for embeddings), but most monitoring tools treat these workloads uniformly. Batch jobs are particularly problematic because they often run in the background, consuming reserved GPU blocks during idle hours and inflating costs unnoticed. Without job-level instrumentation and cost-aware scheduling, teams can’t distinguish between productive compute and deadweight GPU utilization. Techniques like annotating Airflow DAGs or Kubeflow pipelines with cost metadata are critical to closing this visibility gap and enabling actionable insights.
Volatile GPU Supply and Pricing The scarcity of high-end GPUs like NVIDIA A100s and H100s introduces volatility not only in availability but also in pricing—especially when relying on spot or burstable instances. Engineering teams often overprovision to hedge against capacity shortages, leading to idle resources and runaway costs. At the same time, cloud providers’ new GPU commitment programs (e.g., PTUs or scale tiers) offer discounts but lock teams into rigid usage patterns. Navigating these tradeoffs requires fine-grained forecasting based on workload profiles, along with orchestration strategies that blend reserved, on-demand, and spot capacity for resilience without waste.
Immature Engineering Practices for AI Workloads Unlike traditional software systems, AI workloads are highly stateful, resource-intensive, and prone to inefficiencies that engineers may not immediately recognize. For example, prompt chaining experiments can multiply token costs tenfold, or a minor data preprocessing bug can rerun large training pipelines unnecessarily. Without rigorous cost observability baked into CI/CD pipelines and a culture of cost-aware engineering, these issues persist undetected until they surface as billing anomalies weeks later. Enforcing real-time telemetry injection, validating tagging at deploy time, and integrating cost gates into workflow orchestration are essential to raising operational maturity.
Governance and Policy Enforcement at Scale Establishing governance guardrails across diverse AI teams is a nontrivial task. Rogue workloads—such as ad-hoc model fine-tuning or unapproved dataset ingestion—can bypass tagging and spike GPU utilization. IAM tag enforcement, budget threshold alerts, and admission controllers help, but organizations often struggle to balance agility with control. Scaling these policies globally across multi-cloud and hybrid environments adds further complexity, especially when teams use a mix of managed AI services (like Bedrock or Vertex AI) and self-hosted open-source stacks.
Disjointed Business and Technical Metrics Aligning AI costs with business value is notoriously difficult. Token consumption, GPU saturation, and API throughput are technical metrics, while business stakeholders care about KPIs like customer conversions or revenue per feature. The absence of unified dashboards that correlate these layers leaves FinOps teams unable to quantify cost-to-value relationships or justify optimizations. Solutions require integrating observability data from API calls, vector DB queries, and infrastructure telemetry into business intelligence platforms to create a single pane of glass for technical and financial decision-making.
Data Movement and Egress Costs in AI Pipelines Large-scale AI workloads often involve moving terabytes of training data and model artifacts across regions or clouds—incurring substantial egress fees. When teams chain together multiple cloud providers or mix on-prem and cloud systems, these costs explode. For instance, vector database queries may require frequent back-and-forth transfers between compute nodes and storage, creating hidden costs that only surface during billing. Engineering for data locality and leveraging in-region storage with intelligent tiering can mitigate this, but requires careful architectural planning.
AI Cost Optimization with nOps
Without proper testing, guardrails, deployment processes, or correct configuration of your AI tool or agent, costs can go haywire fast — burning through your entire budget. One of our customers was running a simple test, and due to a misconfiguration, daily spend jumped from $100 to $17,000 overnight.
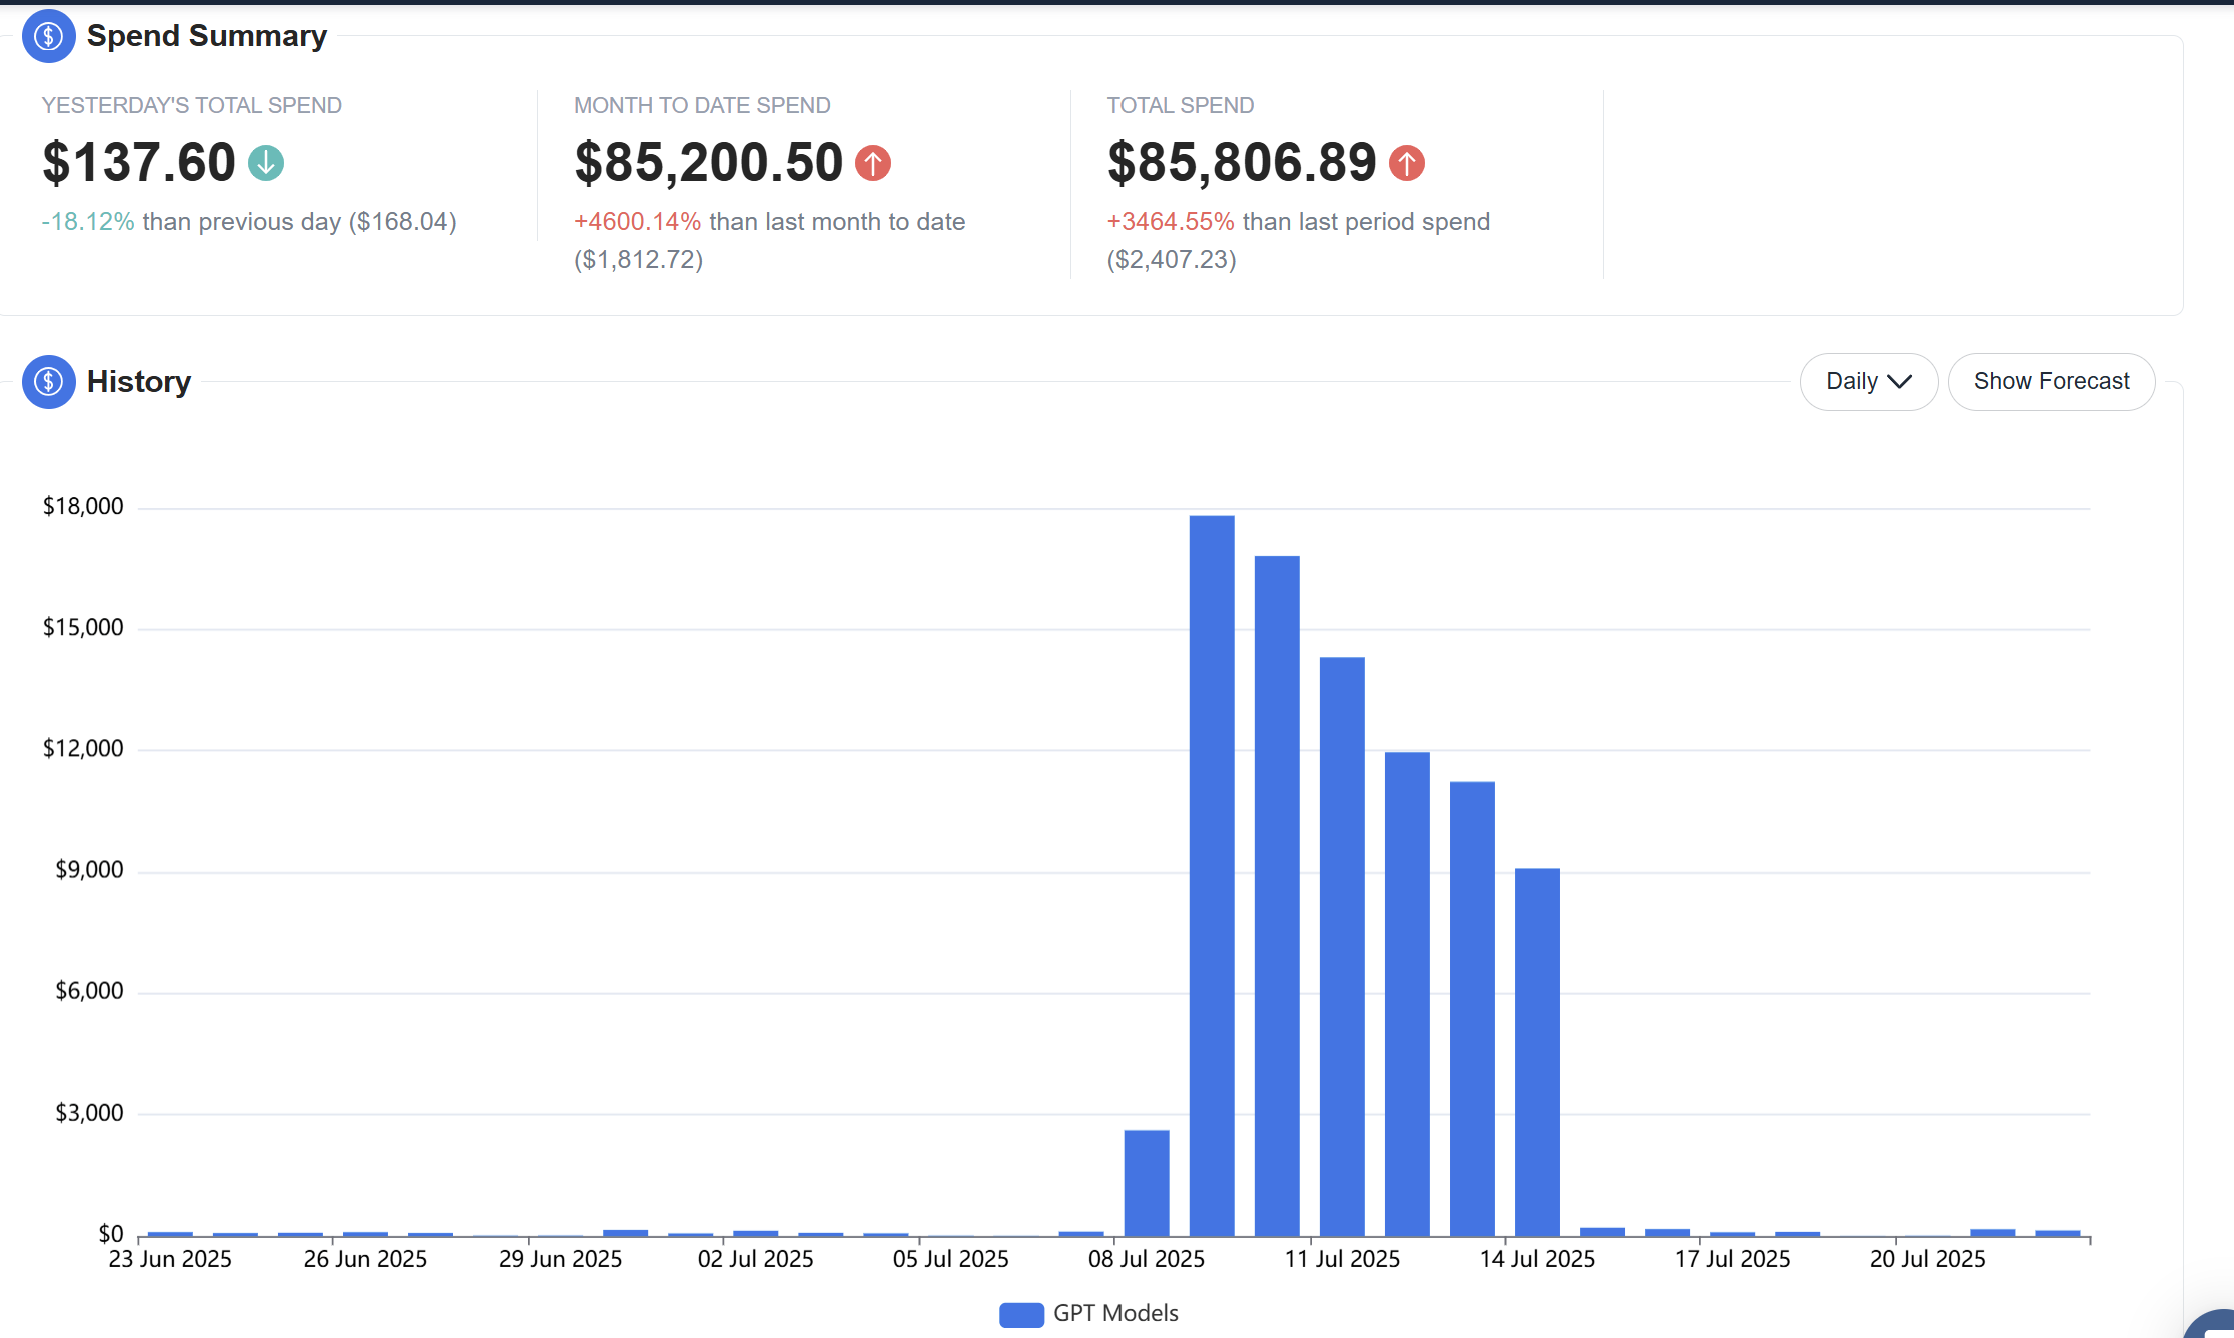
They turned to nOps for full-stack visibility and optimization across all GenAI pipelines — from GPU usage and token spend to model performance and cost-saving recommendations. nOps helped them catch anomalies, identify cheaper model alternatives, and save all in one platform with FinOps guardrails on top.
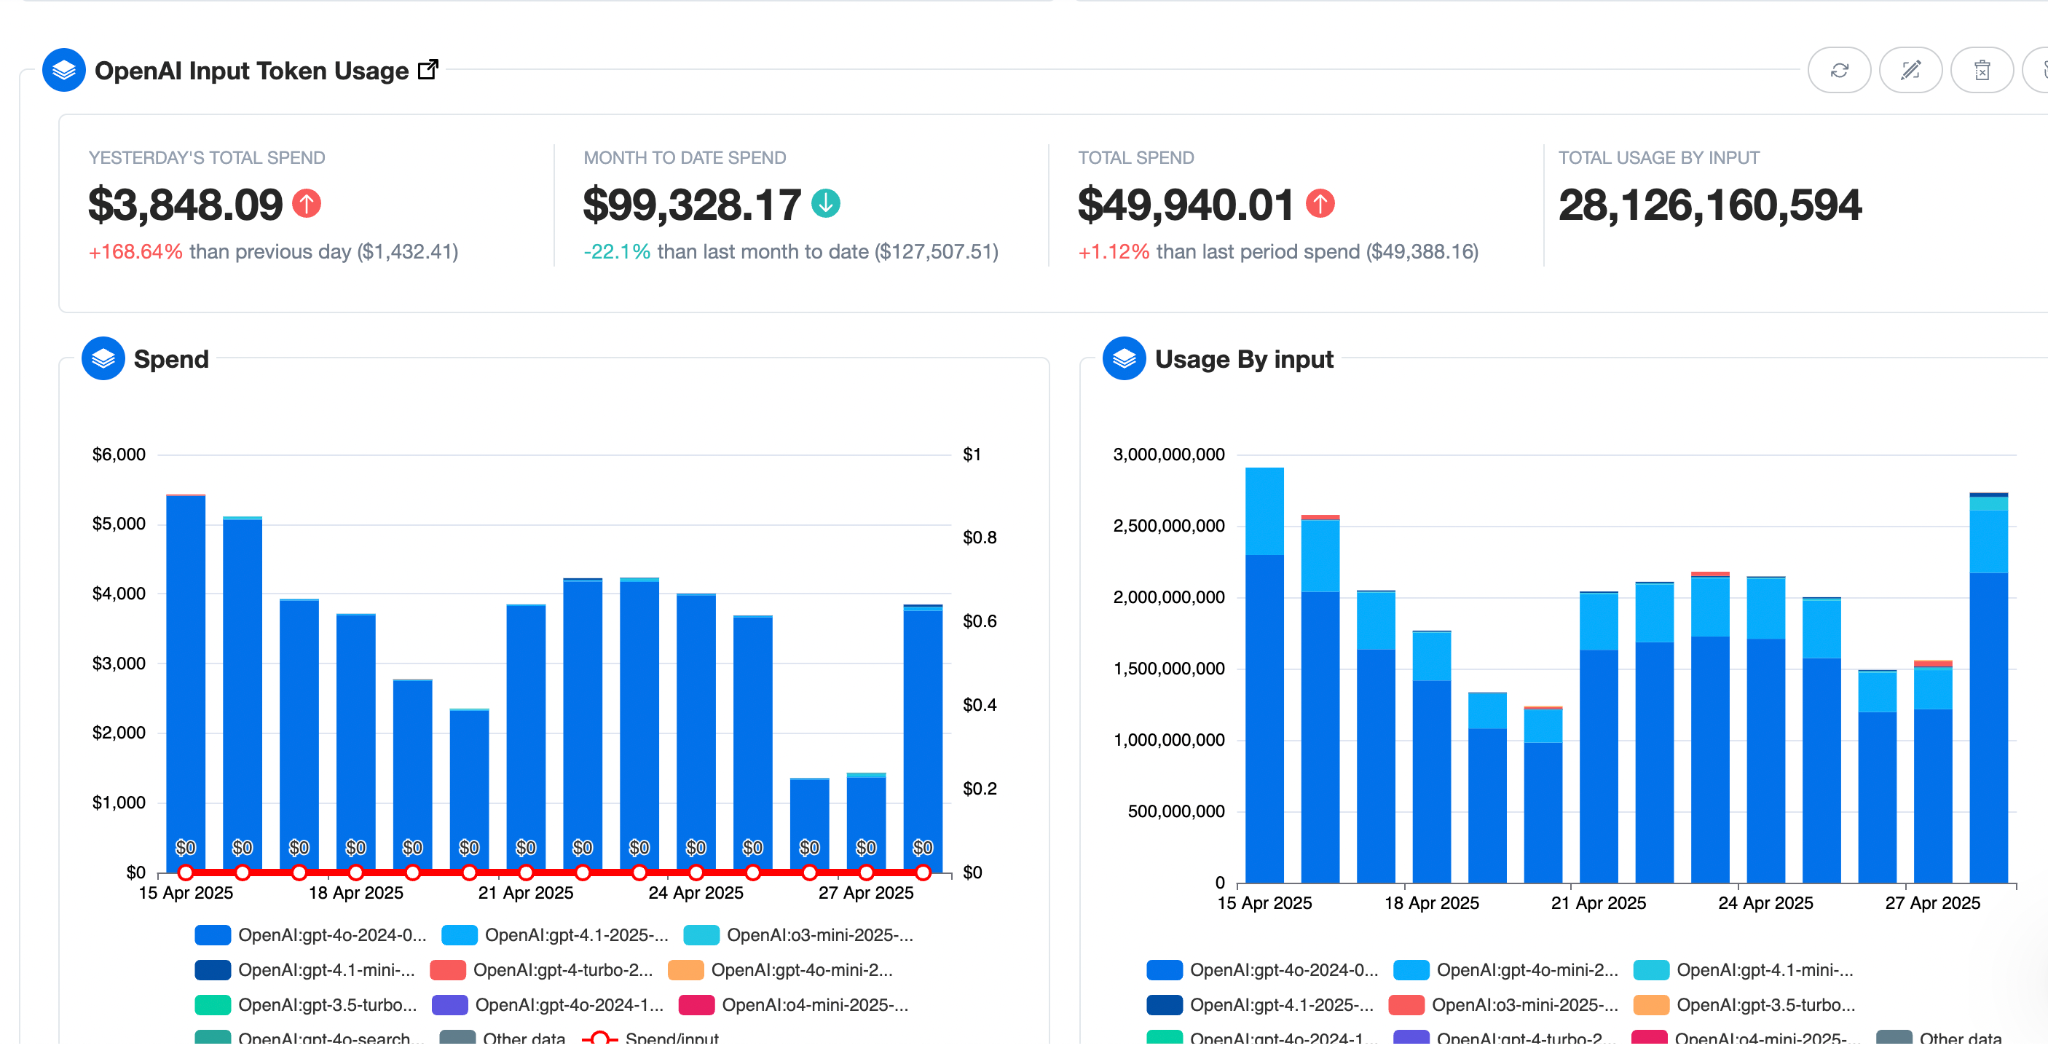
- One-click integrations – pull spend and usage from multicloud, SaaS and GenAI into a single pane of glass, with drill-downs by account, namespace or model.
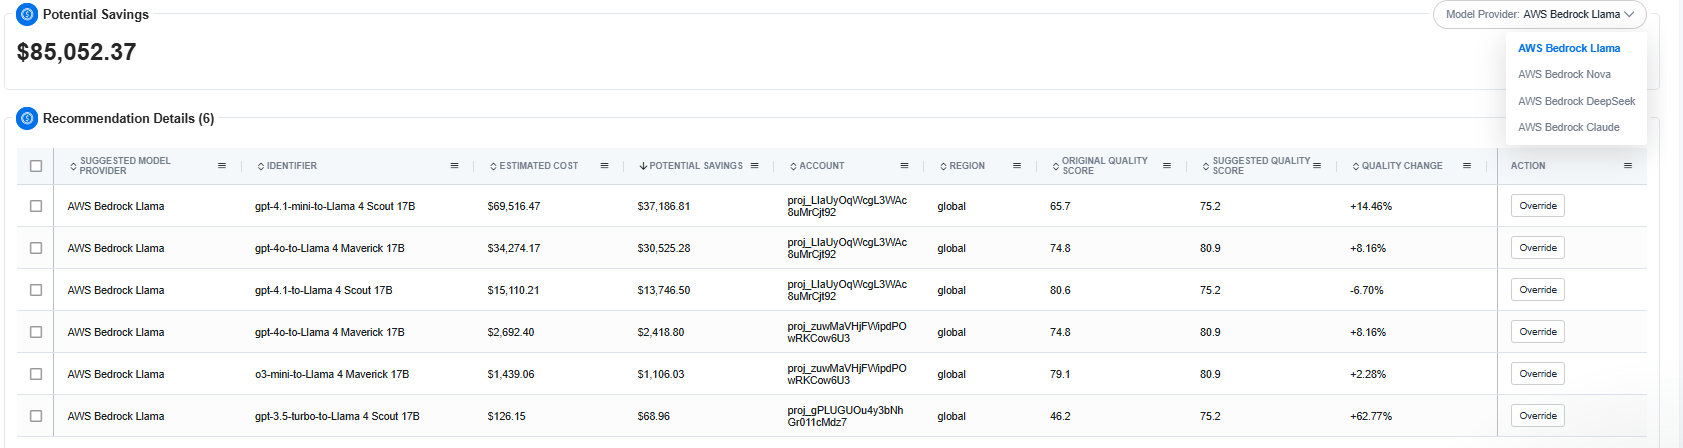
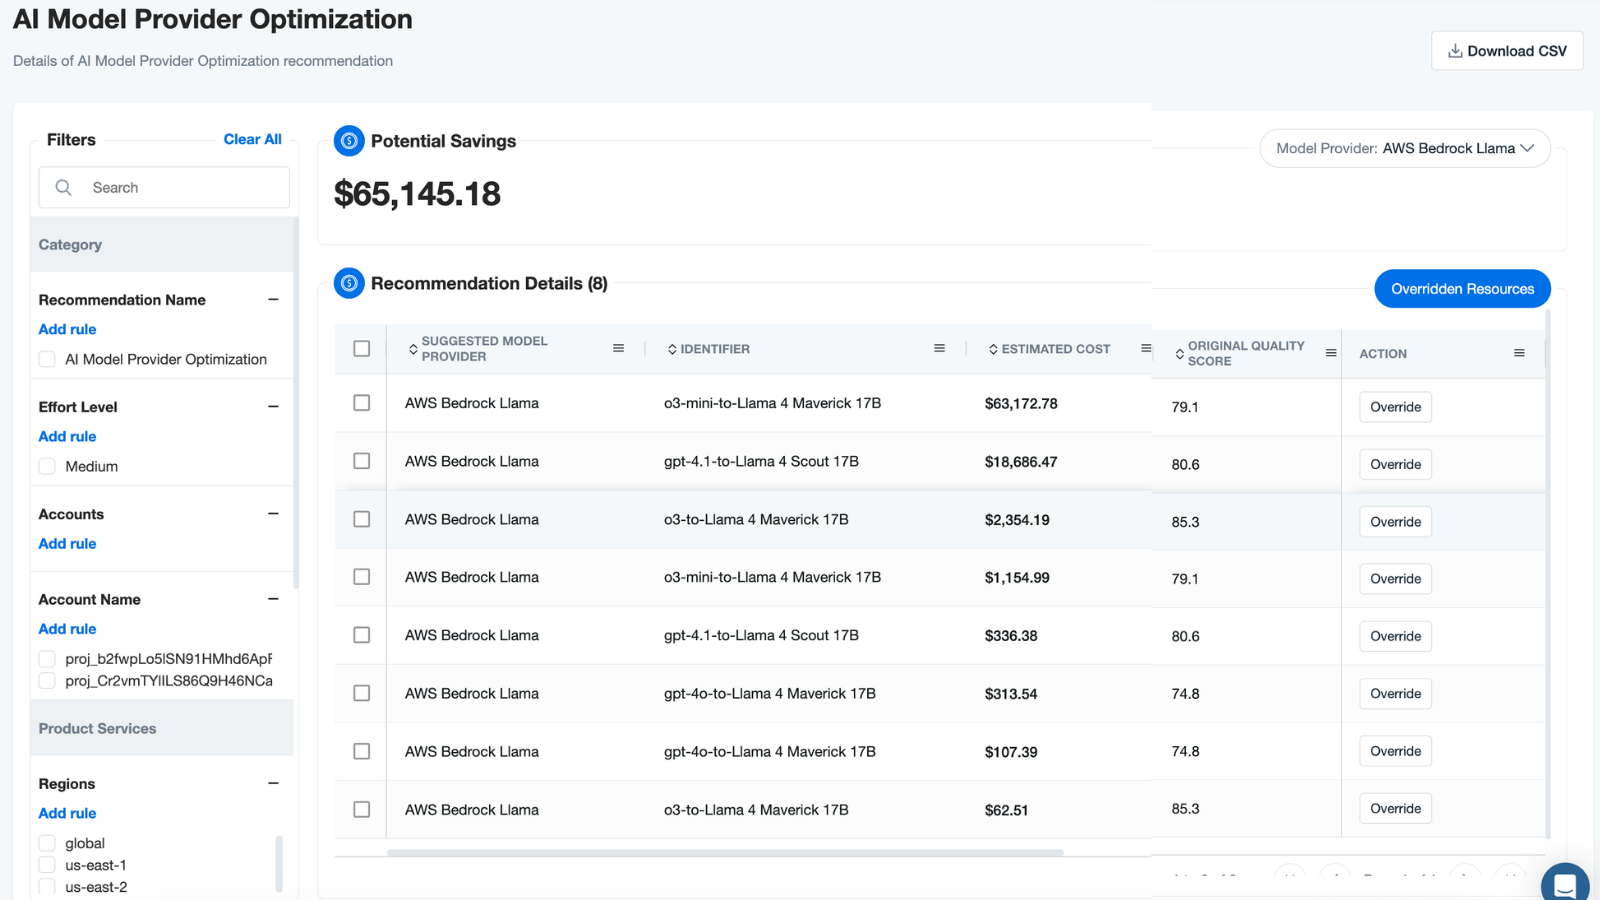
- Model switch recommendations – compare token cost, latency, and accuracy to suggest lower-cost models or routing strategies without degrading SLAs.
- Budgets & proactive anomaly alerts – set thresholds on spend, get Slack/email alerts the moment they’re breached.
- Forecasting & reporting – ML-based spend forecasts and exportable chargeback/showback reports for finance.
- Granular cost allocation – split shared services down to team, feature, or environment.
- Discount & pricing optimisation – detect under-used Savings Plans/RIs and highlight cheaper provider or PTU pricing models.
nOps manages $2 billion in AWS spend and is rated 5 stars on G2. Book a demo to find out how to get visibility and control over your GenAI costs today!
Last Updated: February 9, 2026, AI
Last Updated: February 9, 2026, AI
