 Skip to content


15+ AWS Monitoring Tools You Should Know in 2026
Monitoring modern cloud environments is harder than ever. Between Kubernetes clusters, serverless workloads, distributed databases, SaaS integrations, and AI pipelines, data streams come in countless formats and dashboards. Without a unified view, signals get siloed, blind spots emerge, and critical issues slip through the cracks.
The right monitoring tools can change that. They bring together logs, metrics, and traces across your infrastructure, correlate them with business context, and surface the insights engineers need to detect problems early, resolve incidents faster, and maintain reliability at scale.
In this guide, we’ll break down what cloud monitoring tools are and the key features to look for. Then, we’ll review the top 15 monitoring tools in 2025 to help you choose the best fit for your team.
What is an AWS Monitoring Tool?
An AWS monitoring tool is software that tracks the health and performance of your cloud infrastructure and applications. These tools collect signals like CPU and memory usage, network latency, error rates, and request volumes, then surface them in dashboards and alerts so engineers can spot problems early.
The goal is simple: make sure everything is running as expected — and when it isn’t, provide the visibility needed to troubleshoot quickly. Some monitoring tools are built directly into AWS (like CloudWatch), while others are third-party platforms that integrate across AWS, multicloud, and hybrid environments.
Monitoring vs. Observability Tools
Monitoring and observability are closely related but not the same. Monitoring answers whether systems are healthy; observability explains why issues happen. Together, they give teams both real-time detection and deep troubleshooting.
| Aspect | Monitoring | Observability |
|---|---|---|
| Primary Focus | Tracks known metrics (CPU, memory, latency, errors) | Explores unknown issues across logs, metrics, and traces |
| Key Question | Is the system working as expected? | Why is the system behaving this way? |
| Use Case | Alerting, uptime checks, SLA compliance | Root cause analysis, performance optimization |
| Data Scope | Predefined metrics and dashboards | Flexible queries across logs, metrics, and traces |
| Tools | AWS CloudWatch, Nagios | Datadog, New Relic, OpenTelemetry-based platforms |
Features of AWS Monitoring Tools
Effective monitoring tools share a core set of capabilities that help engineering teams stay ahead of issues and keep systems reliable. Common features include:
Metrics Collection – Capture system and application signals such as CPU, memory, disk usage, request latency, and error rates.
Dashboards & Visualization – Present data in clear, customizable dashboards for quick status checks and trend analysis.
Alerting & Notifications – Trigger alerts when thresholds are crossed or anomalies are detected, with integrations into tools like Slack or PagerDuty.
Log Management – Aggregate and search logs to correlate events with system health.
Tracing – Track individual requests through distributed systems to spot bottlenecks and errors.
Integrations – Connect with AWS services, third-party platforms, and CI/CD pipelines for a unified view.
Anomaly Detection – Use baselines or ML-powered analysis to automatically flag unusual behavior beyond static thresholds.
15 Best AWS Monitoring Tools in 2025
Let’s dive into the list of top AWS monitoring solutions.
1. nOps
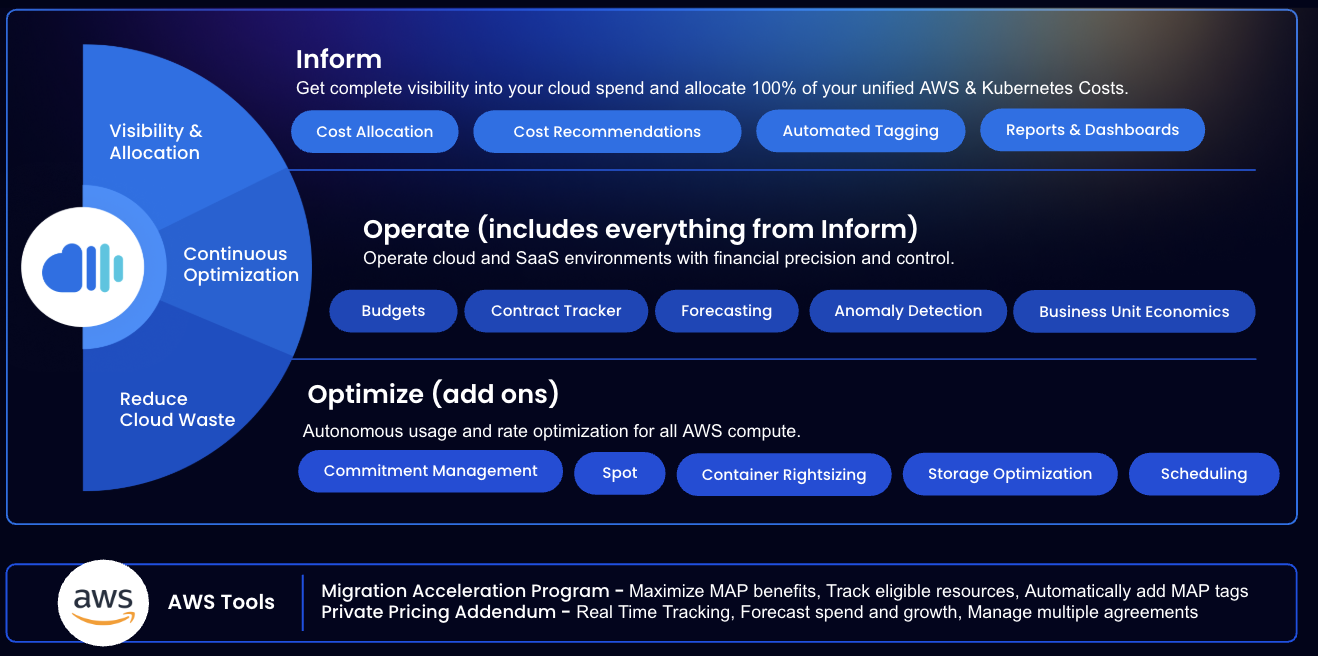
nOps is an AI-powered monitoring and FinOps platform that gives teams visibility into cloud infrastructure, Kubernetes workloads, and AI pipelines while tying those signals directly to cost and efficiency. Beyond visibility, nOps helps automatically optimize infrastructure at every layer — from container rightsizing, to node and cluster scaling, to selecting the most cost-efficient pricing options. It’s best for engineering and FinOps teams that need more than observability dashboards: a platform that monitors performance, shows the cost impact, and automates savings in real time.
Pros
Combines infrastructure monitoring with FinOps insights in one platform.
Provides deep Kubernetes and AI workload visibility, including container rightsizing and benchmarking.
Connects operational metrics to AWS costs, Reserved Instances, and Spot usage.
Automation engine can optimize resources dynamically (rightsizing, scaling, Spot selection).
Unified dashboards for engineering, finance, and business units.
Cons
More advanced than a simple monitoring tool — may be overkill for very small teams with minimal AWS/Kubernetes usage.
Focused on AWS; less coverage for other clouds compared to multi-cloud observability suites.
nOps was recently ranked #1 with five stars in G2’s cloud cost management category, and we optimize $2+ billion in cloud spend for our customers.
Try it out with your own AWS account by booking a demo with one of our AWS experts.
#2: AWS CloudWatch
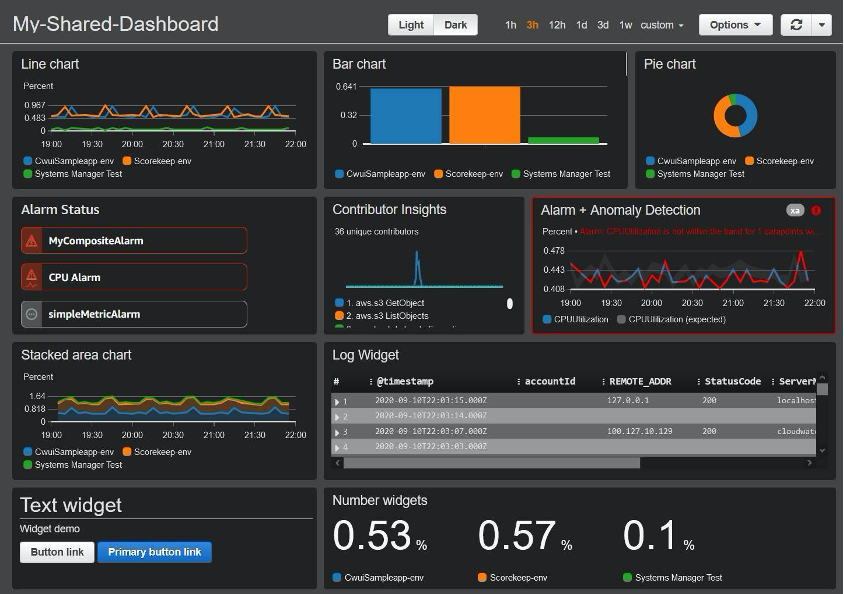
CloudWatch is AWS’s native monitoring service, designed to track metrics, logs, and events across AWS resources. It provides basic dashboards, alarms, and log analytics to help teams monitor infrastructure and applications without leaving the AWS ecosystem. While powerful for AWS workloads, CloudWatch can feel limited for Kubernetes, multicloud, or advanced observability use cases. It’s best for teams running primarily in AWS that want a built-in monitoring option with straightforward integration.
Pros
Native to AWS with seamless integration across all AWS services.
Centralized metrics, logs, and alarms in one place.
Works well for basic infrastructure and application monitoring.
Pay-as-you-go pricing model with no upfront setup.
Cons
Limited functionality for Kubernetes, AI workloads, or multicloud environments.
Dashboards and query language can be less intuitive compared to third-party platforms.
Advanced features like anomaly detection and cross-account visibility add extra cost.
#3: Datadog
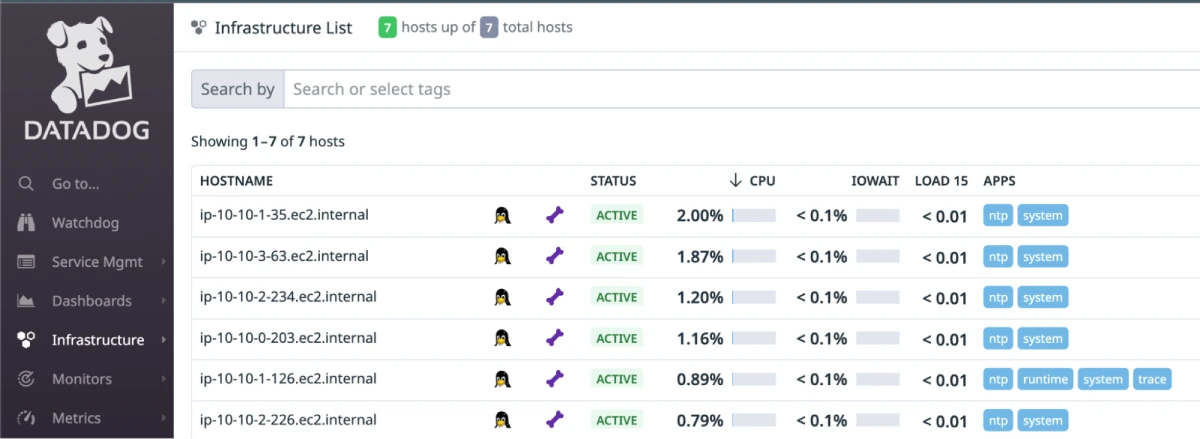
Datadog is one of the most widely used observability platforms, offering monitoring, logging, and tracing in a single SaaS solution. It’s designed for cloud-native environments and integrates with thousands of services, making it a go-to choice for organizations that need end-to-end visibility across infrastructure, applications, and business metrics. Datadog is best for teams that want a comprehensive monitoring suite with strong visualization, anomaly detection, and AI-assisted insights — though its breadth often comes with higher costs.
Pros
Full-stack monitoring: infrastructure, APM, logs, traces, and security.
Huge ecosystem of integrations with AWS, Kubernetes, SaaS, and third-party services.
Powerful dashboards and visualization options.
AI-driven anomaly detection and alerting.
Strong enterprise adoption and maturity.
Cons
Can become expensive at scale due to usage-based pricing.
High data volume can create dashboard and alert fatigue.
Setup and ongoing management can be complex for smaller teams.
#4: New Relic
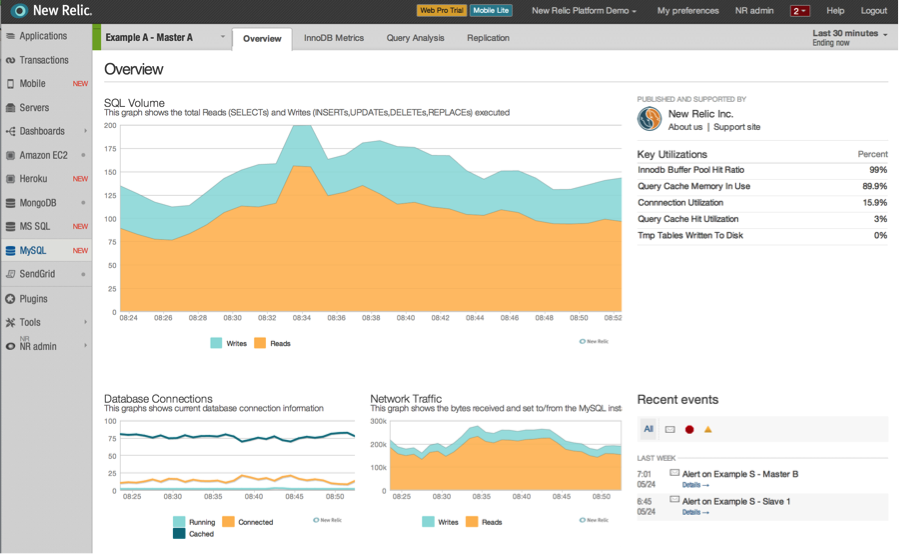
New Relic is a mature observability platform best known for its Application Performance Monitoring (APM) capabilities. It provides full-stack visibility into infrastructure, applications, logs, and user experience, making it a strong option for organizations that need detailed application-level insights alongside infrastructure monitoring. New Relic is best for teams that want to track performance down to individual transactions and tie those metrics back to customer experience, though its pricing and feature complexity can be a barrier for smaller organizations.
Pros
Strong APM with detailed transaction tracing and code-level visibility.
Unified observability across infrastructure, applications, logs, and browser/mobile monitoring.
Flexible dashboards and reporting.
Good support for Kubernetes and cloud-native environments.
Longstanding presence and trust in the enterprise monitoring market.
Cons
Pricing can be complex and expensive for large-scale use.
Steeper learning curve compared to lighter-weight monitoring tools.
Some advanced features may require paid add-ons or enterprise tiers.
#5: Grafana
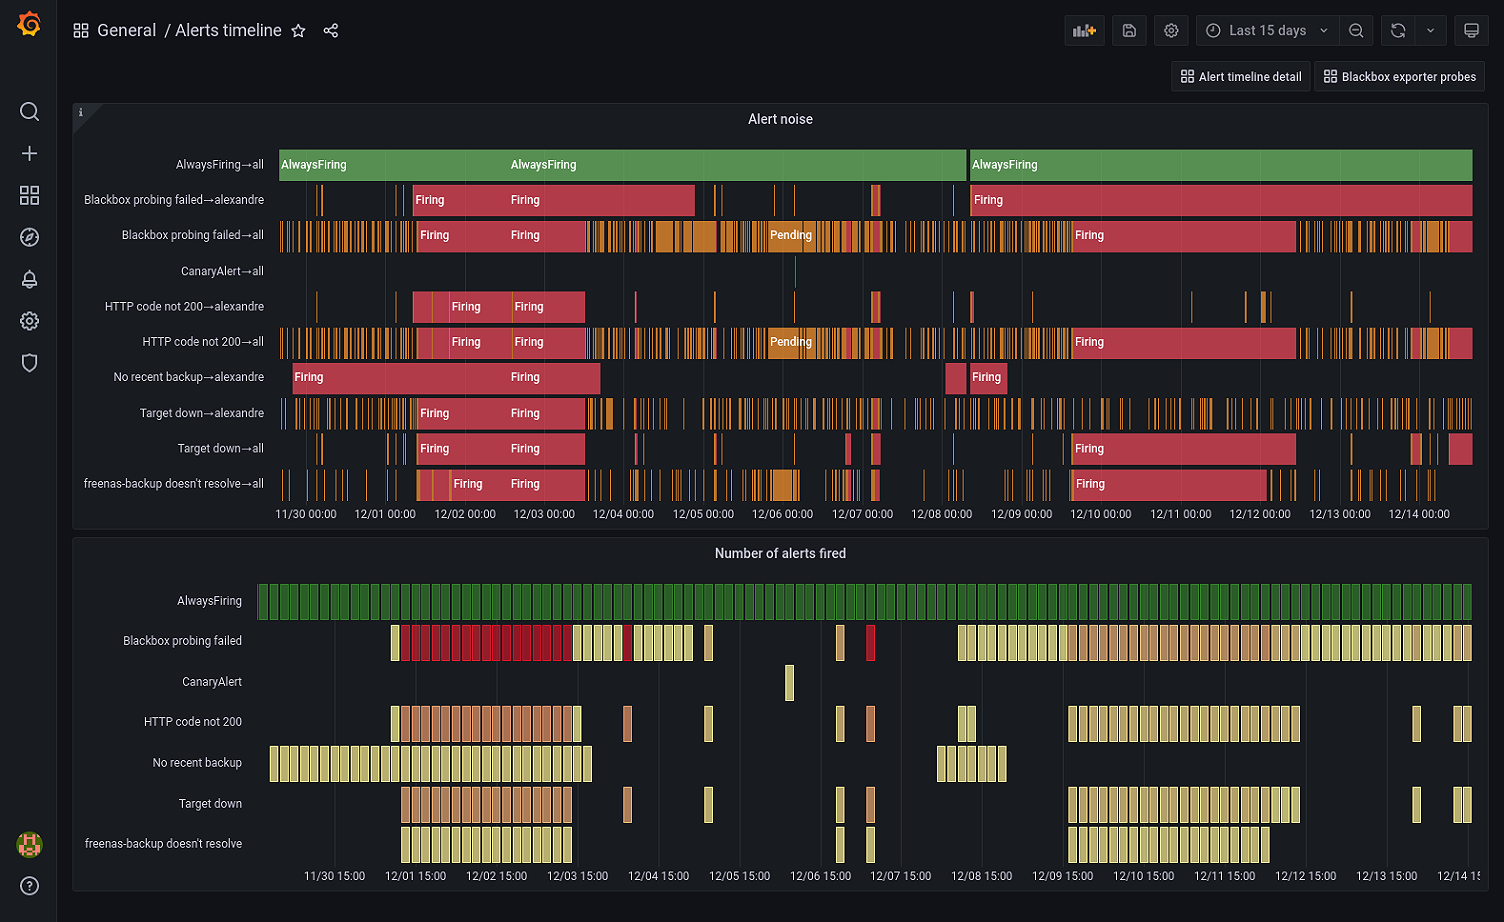
Grafana is the leading open-source platform for turning monitoring data into rich, interactive dashboards. Instead of collecting its own metrics, Grafana plugs into backends like Prometheus, CloudWatch, and Elastic — making it the “front end” for many monitoring stacks. Teams use it to unify data from multiple sources and build custom views that range from simple infrastructure status boards to complex, business-focused observability panels. Grafana is best for organizations that want flexible visualization on top of their existing monitoring data, or prefer the managed experience of Grafana Cloud.
Pros
Best-in-class visualization with highly customizable dashboards.
Supports dozens of data sources, from Prometheus to AWS CloudWatch.
Strong open-source community plus commercial cloud offering.
Ideal complement to metrics-first tools like Prometheus.
Cons
Doesn’t collect data itself — requires external backends.
Steeper learning curve for advanced dashboard customization.
Enterprise support and hosted services add cost.
#6: Apptio Prometheus
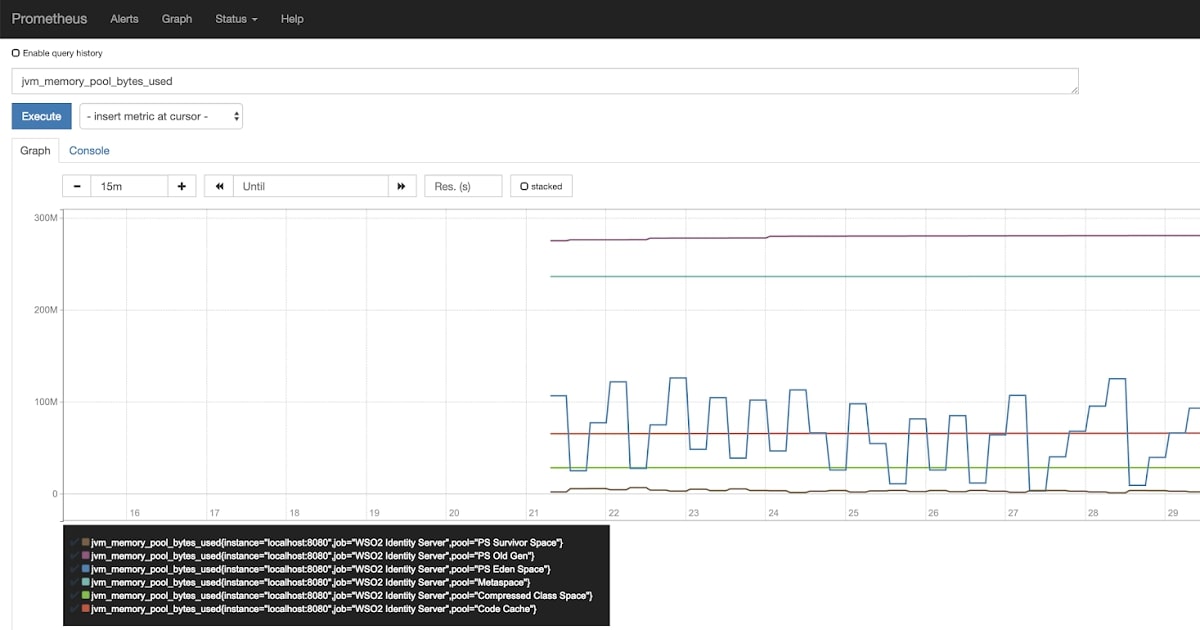
Prometheus is the open-source standard for metrics collection and alerting, especially in Kubernetes environments. It’s designed around a time-series database and a powerful query language (PromQL), making it the backbone of many modern monitoring stacks. Prometheus excels at scraping metrics from applications and services, storing them efficiently, and triggering alerts when conditions are met. It’s best for engineering teams running containerized workloads that want a reliable, open-source way to monitor system health and performance at scale.
Pros
De facto choice for Kubernetes monitoring.
Lightweight, efficient time-series database.
Powerful query language (PromQL) for flexible analysis.
Strong integration with Grafana for visualization.
Vibrant open-source ecosystem and CNCF support.
Cons
No built-in long-term storage — needs external systems for history.
Limited native visualization (relies on Grafana or others).
Requires operational expertise to manage at scale.
#7: Dynatrace
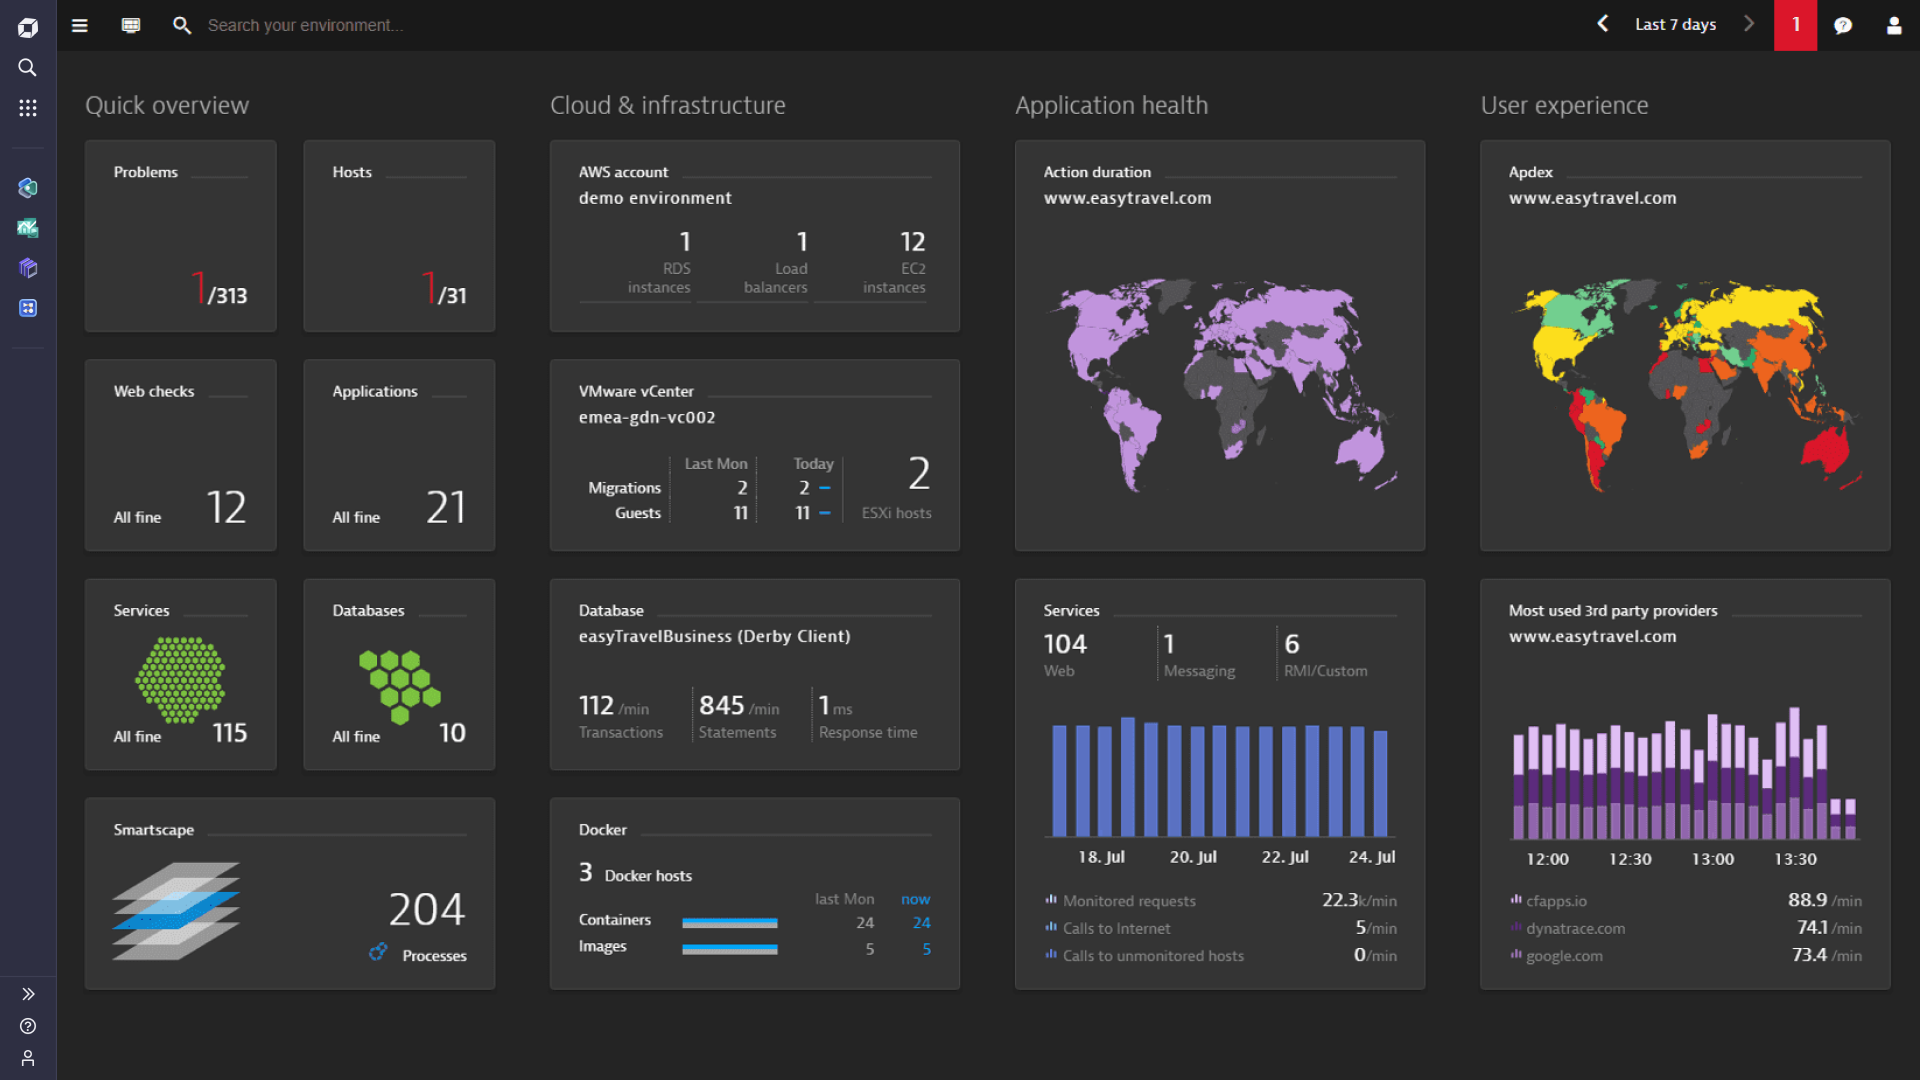
Dynatrace is an enterprise-grade observability and monitoring platform that emphasizes automation and AI-driven insights. Unlike traditional tools that rely heavily on manual dashboards and alert tuning, Dynatrace uses its Davis AI engine to automatically discover dependencies, detect anomalies, and surface root causes across complex environments. It’s best for large organizations running hybrid or multicloud infrastructure that need monitoring at scale with minimal manual configuration.
Pros
AI-powered Davis engine automates anomaly detection and root cause analysis.
Strong support for hybrid and multicloud environments.
Auto-discovery maps application and service dependencies.
Unified platform for infrastructure, APM, logs, and security monitoring.
Enterprise-ready with scalability and governance features.
Cons
Higher cost compared to lighter-weight tools.
Complexity can exceed the needs of smaller teams.
Proprietary approach means less flexibility than open-source stacks.
#8: Splunk Observability
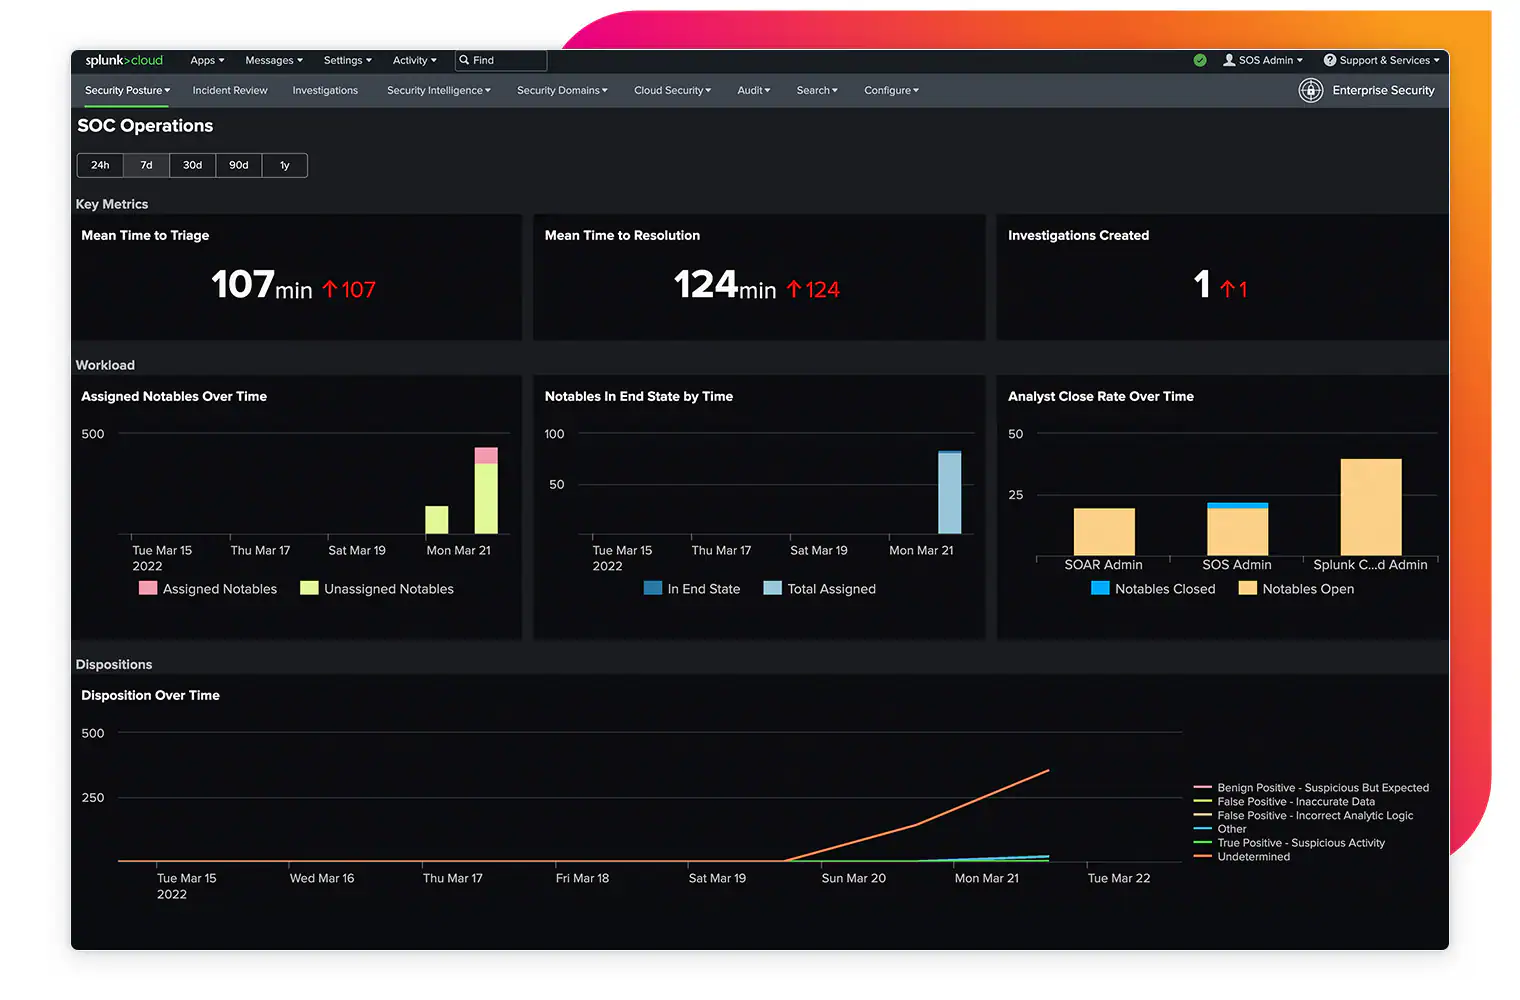
Splunk Observability extends Splunk’s well-known log analytics into a full monitoring and observability suite. It combines infrastructure monitoring, APM, log management, and real user monitoring with the search and analytics strengths Splunk is known for. It’s best for organizations that already rely on Splunk for logging and want a unified platform to cover performance monitoring, troubleshooting, and business context without stitching together multiple tools.
Pros
Deep log analytics capabilities integrated with monitoring and APM.
Strong enterprise adoption and ecosystem support.
Flexible search and query language for investigating incidents.
Real user monitoring alongside backend observability.
Scales well across large, complex environments.
Cons
Licensing and pricing can be complex and expensive.
Resource-intensive compared to lighter-weight tools.
Can require significant expertise to set up and manage effectively.
#9: Elastic Observability
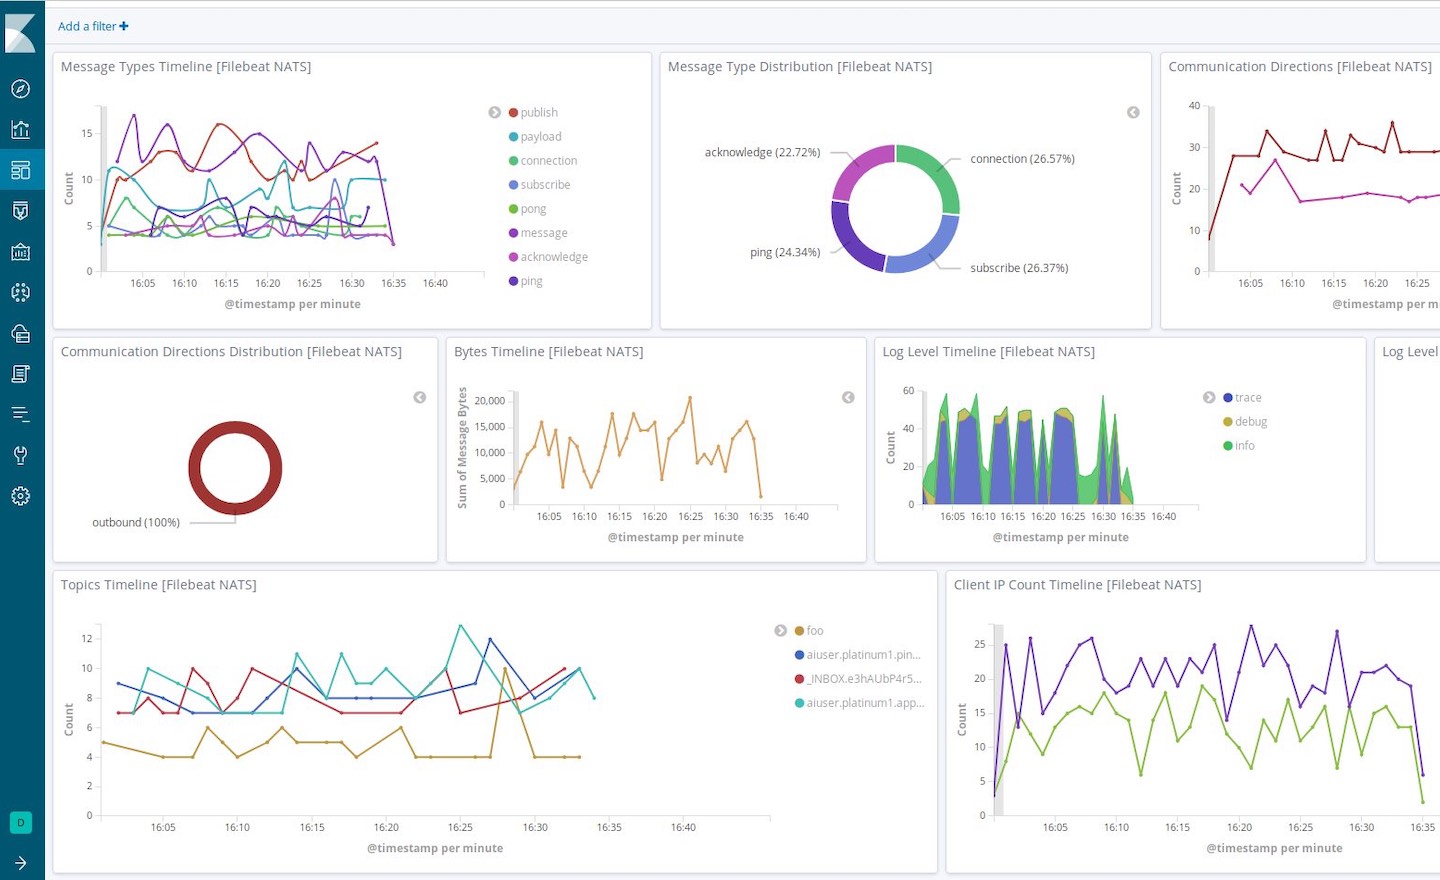
Elastic Observability builds on the ELK Stack (Elasticsearch, Logstash, Kibana) to provide monitoring, logging, and tracing in one platform. It’s designed for teams that want open-source flexibility with the option to scale into a managed solution via Elastic Cloud. Elastic shines where search and correlation matter — letting teams quickly pivot across logs, metrics, and traces in a single interface. It’s best for organizations that already use the ELK Stack or want strong search-driven observability without locking into a proprietary vendor.
Pros
Unified monitoring, logging, and tracing built on the ELK Stack.
Powerful search and correlation capabilities across data types.
Open-source foundation with commercial Elastic Cloud option.
Strong support for Kubernetes and cloud-native workloads.
Flexible deployment (self-managed or fully managed).
Cons
Can be resource-intensive to operate at scale when self-hosted.
Requires expertise to tune and maintain ELK components.
Some advanced observability features only available in Elastic’s commercial tiers.
#10: Zabbix
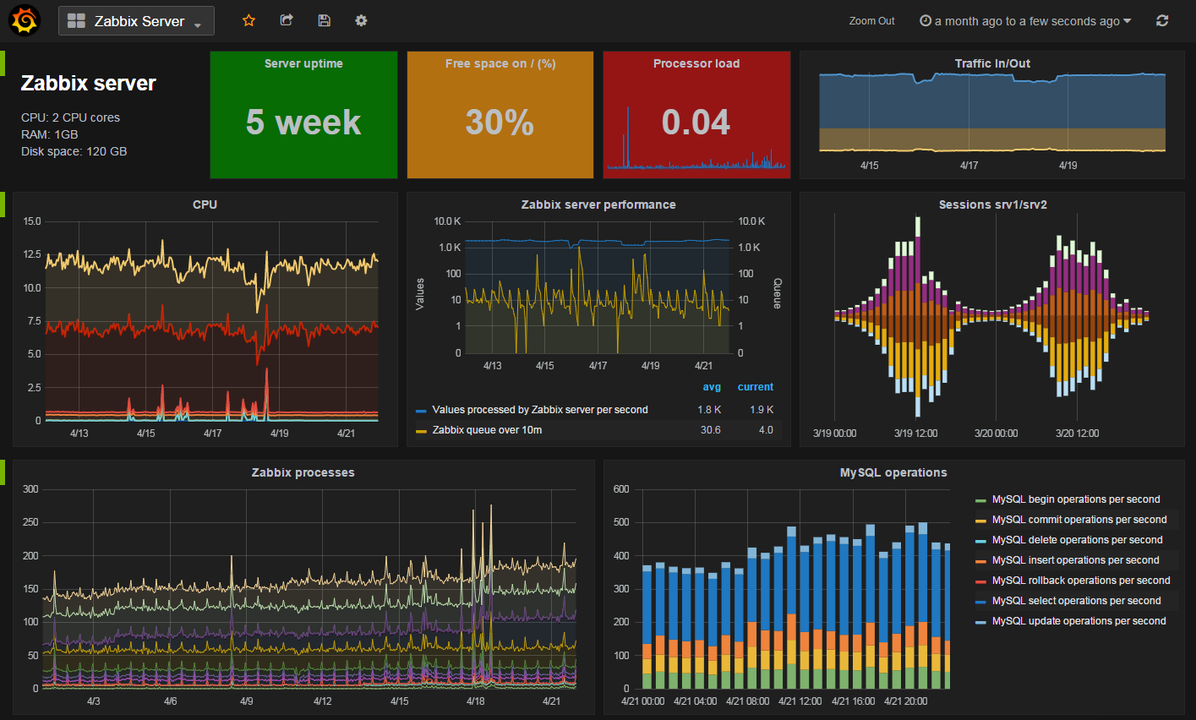
Zabbix is a long-standing open-source monitoring platform focused on infrastructure, networks, and servers. It excels in traditional IT and hybrid environments, providing real-time monitoring, alerting, and visualization for a wide range of devices. While it doesn’t have the cloud-native depth of tools like Prometheus or Datadog, Zabbix is valued for its stability, extensibility, and ability to cover legacy systems alongside modern workloads. It’s best for IT operations teams that need broad infrastructure coverage with an open-source foundation.
Pros
Mature open-source monitoring with a strong global community.
Wide protocol support (SNMP, IPMI, JMX, etc.) for diverse infrastructure.
Real-time monitoring with flexible alerting and escalation.
Suitable for hybrid environments that include on-premise assets.
No licensing fees for the open-source edition.
Cons
Less suited to cloud-native and Kubernetes workloads.
UI and user experience feel dated compared to modern SaaS tools.
Requires ongoing setup and maintenance to scale effectively.
#11: Nagios
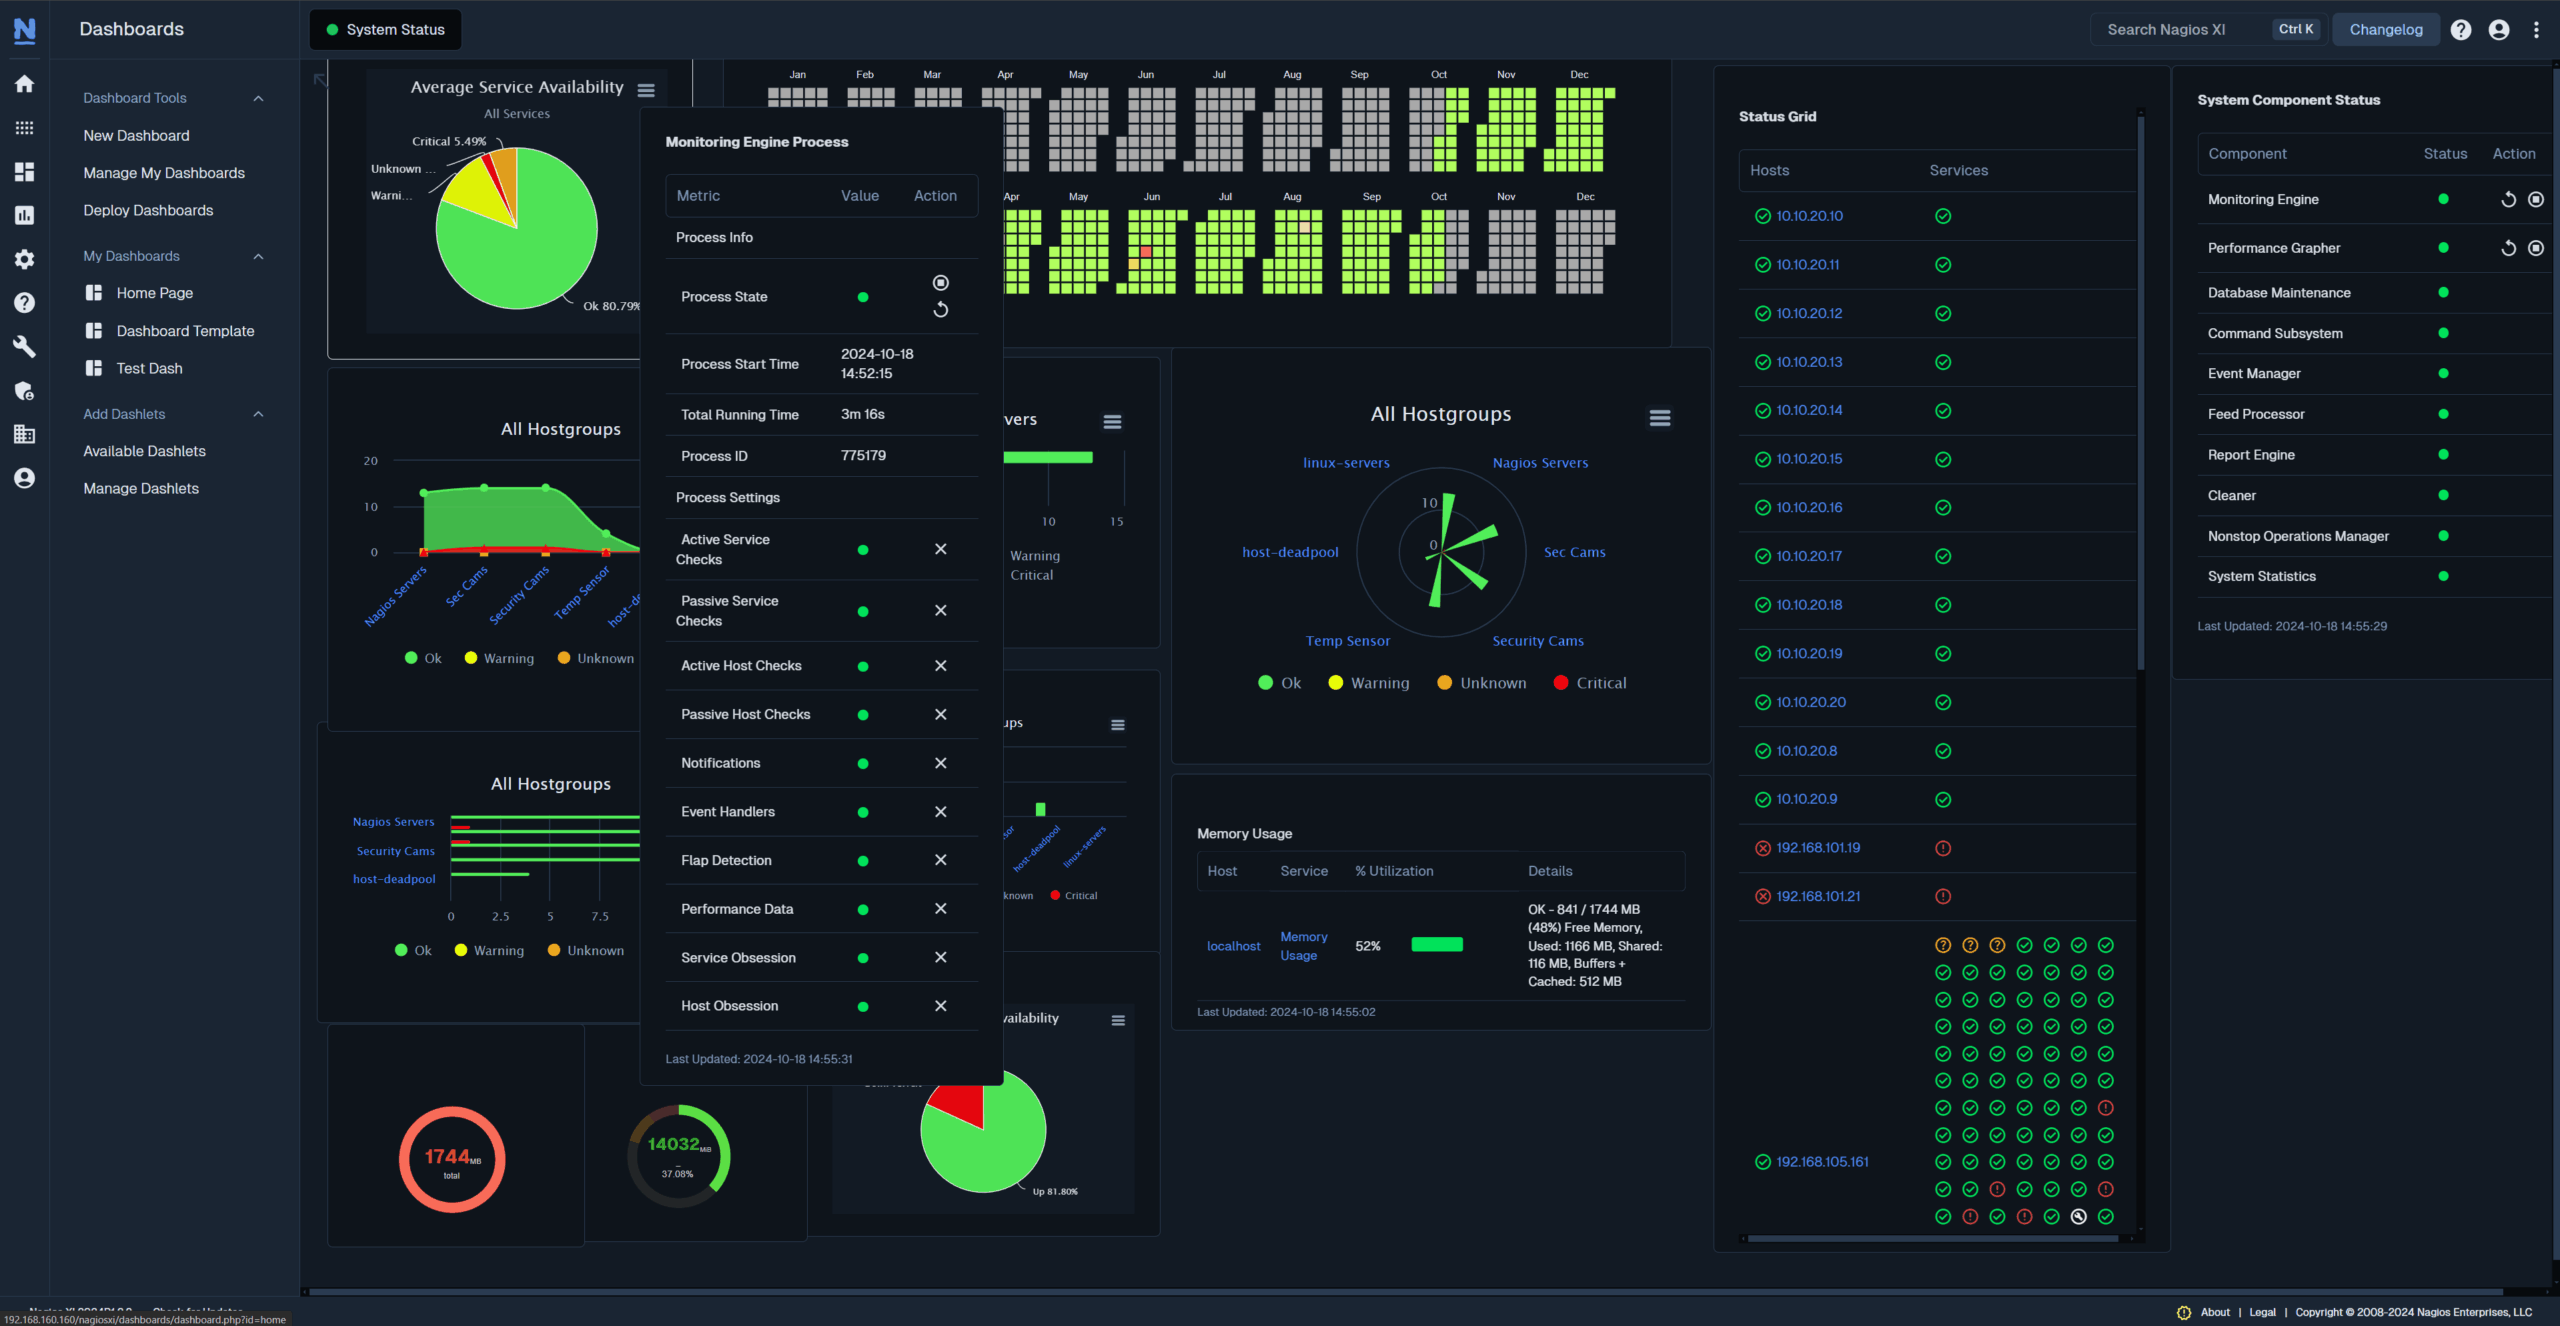
Nagios is one of the original open-source infrastructure monitoring tools, widely used for decades to track uptime, availability, and basic performance metrics. It’s built around plugins and checks, making it highly extensible for different environments. While still effective for traditional server and network monitoring, Nagios requires significant manual configuration and lacks the depth needed for Kubernetes, cloud-native, or AI workloads. It’s best for organizations with legacy infrastructure or smaller IT teams that need straightforward uptime monitoring.
Pros
Proven, reliable monitoring platform with long history.
Extensive plugin ecosystem for diverse integrations.
Strong community support and documentation.
Good for tracking uptime and SLA compliance.
Cons
Limited capabilities for modern cloud-native workloads.
Manual configuration and plugin management can be time-consuming.
Lacks native logging, tracing, or advanced analytics.
#12: LogicMonitor
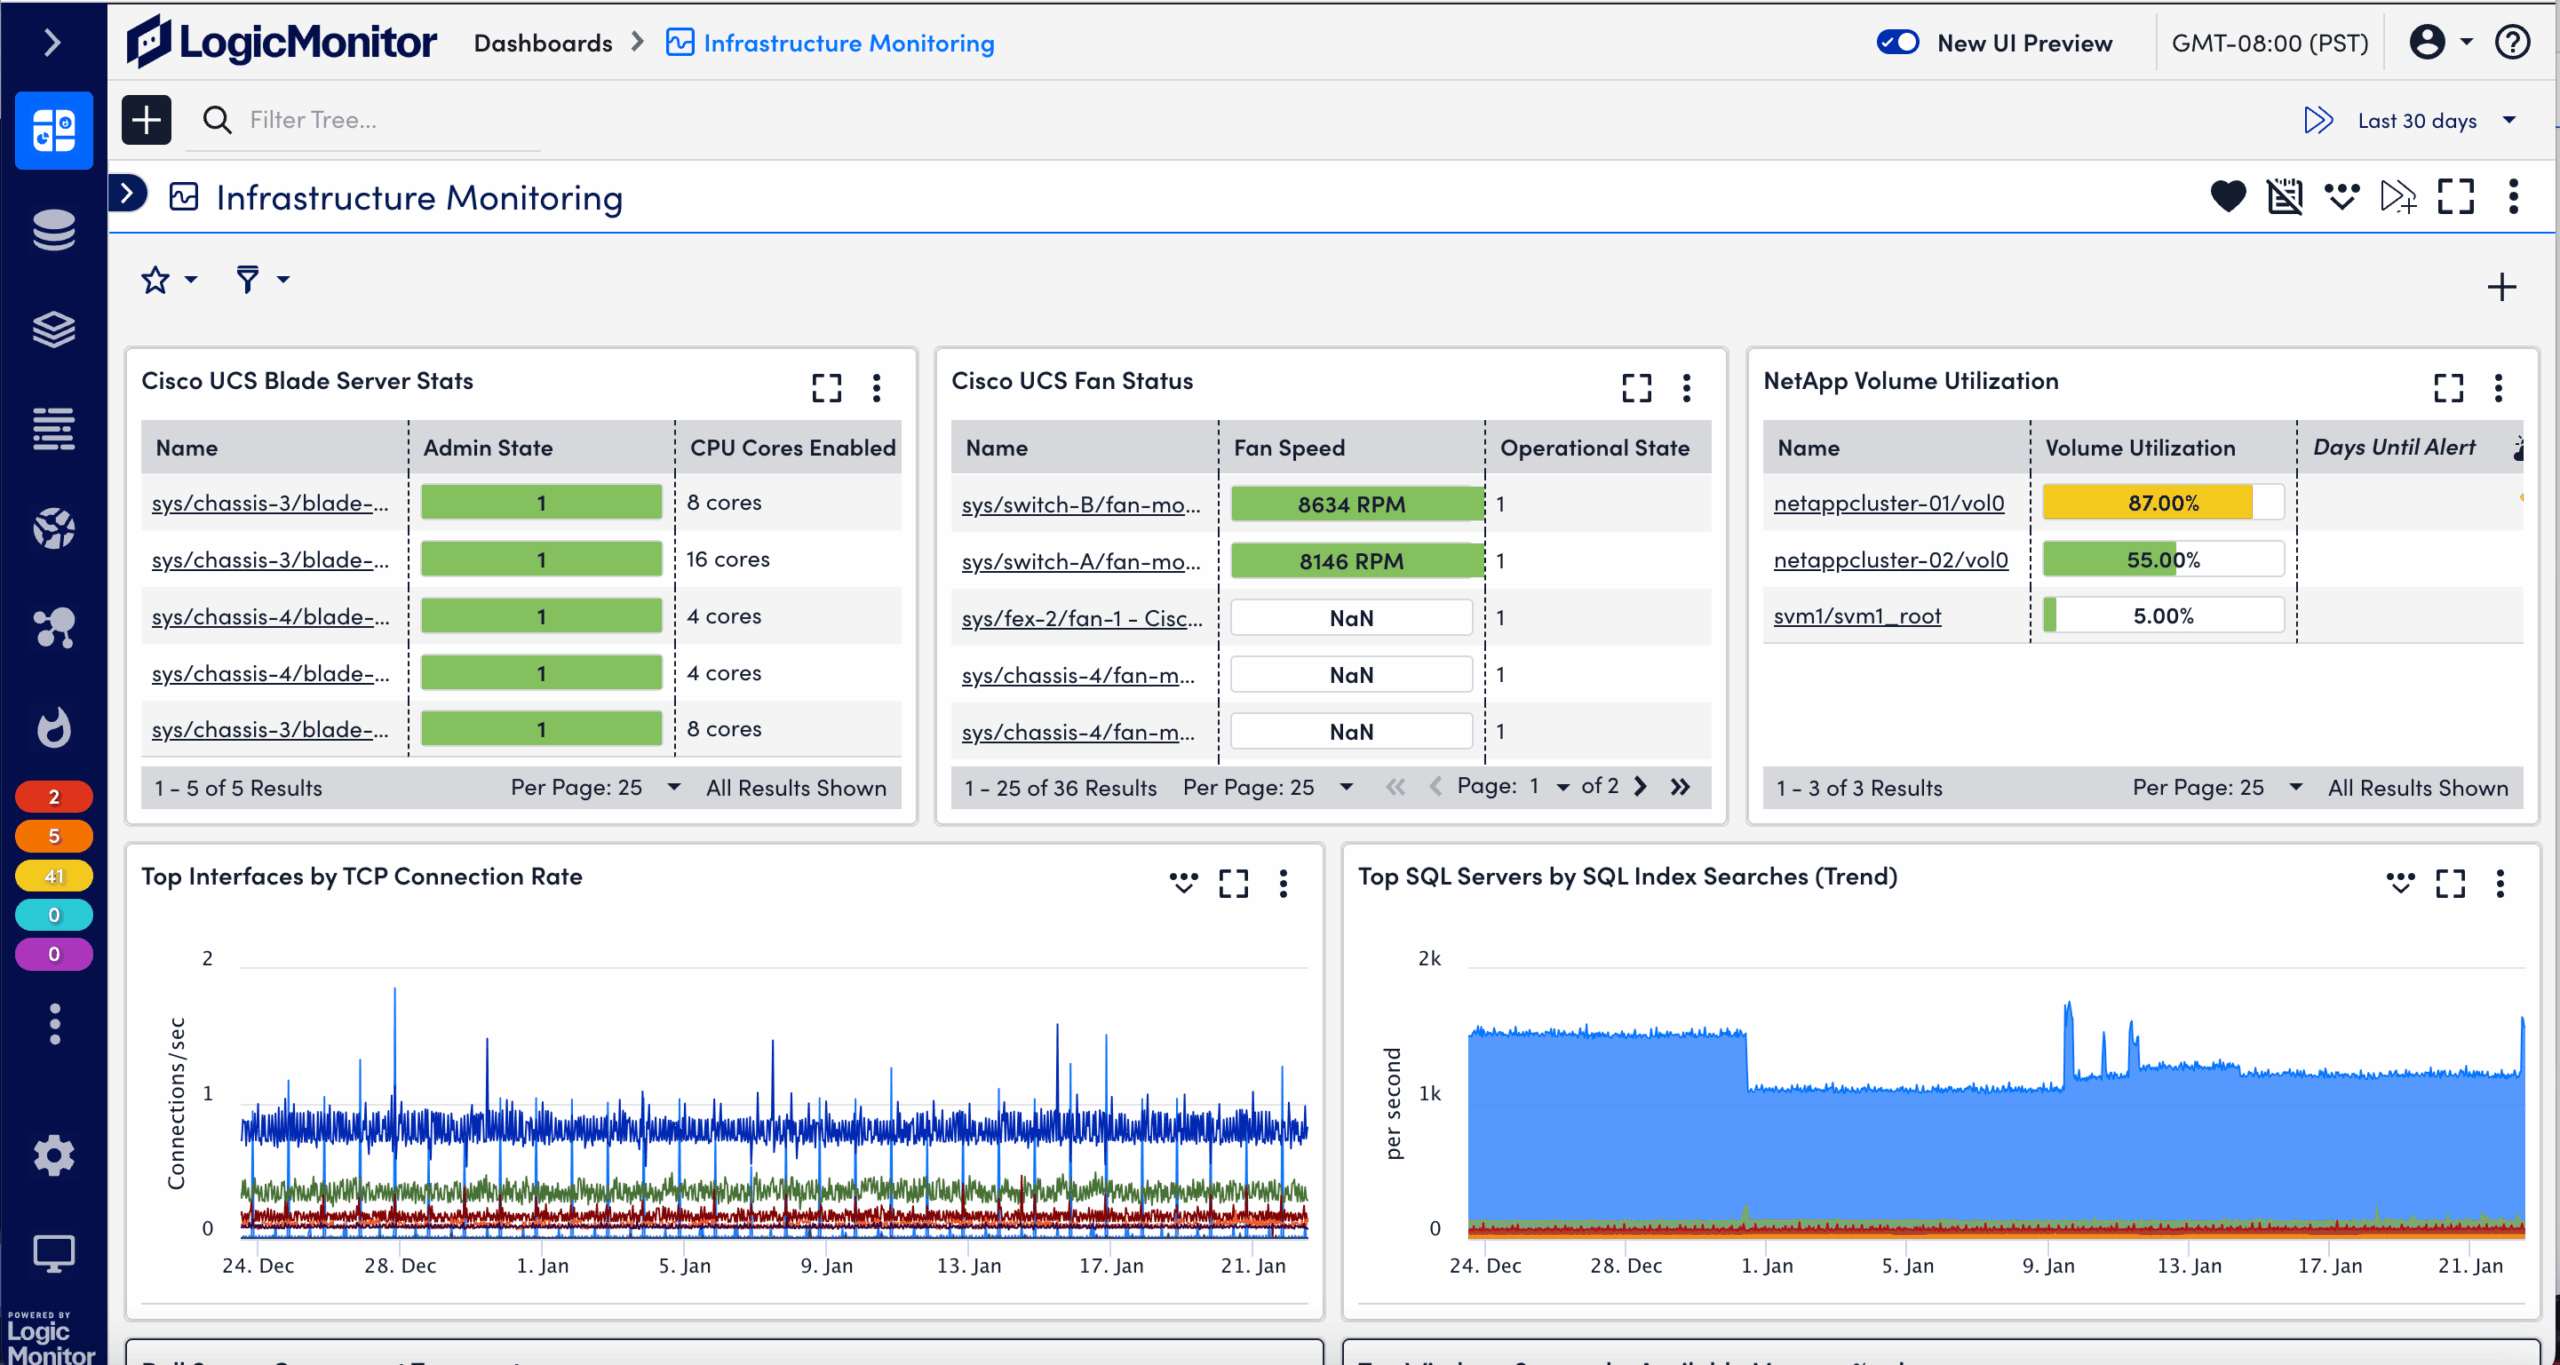
LogicMonitor is a SaaS-based infrastructure monitoring platform with strong support for hybrid and multicloud environments. It focuses on agentless monitoring, auto-discovery, and rapid time-to-value, making it easier to set up than many open-source or self-managed tools. LogicMonitor is best for enterprises that want broad visibility across on-premise networks, cloud resources, and SaaS applications without investing heavily in managing their own monitoring stack.
Pros
SaaS delivery model reduces setup and maintenance.
Agentless monitoring with auto-discovery for fast deployment.
Broad coverage across infrastructure, applications, and networks.
Good fit for hybrid and multicloud use cases.
Scalable for large enterprise environments.
Cons
Less developer-focused than tools like Prometheus or Grafana.
Limited depth for Kubernetes and cloud-native observability.
Pricing may be high compared to open-source alternatives.
#13: Coralogix
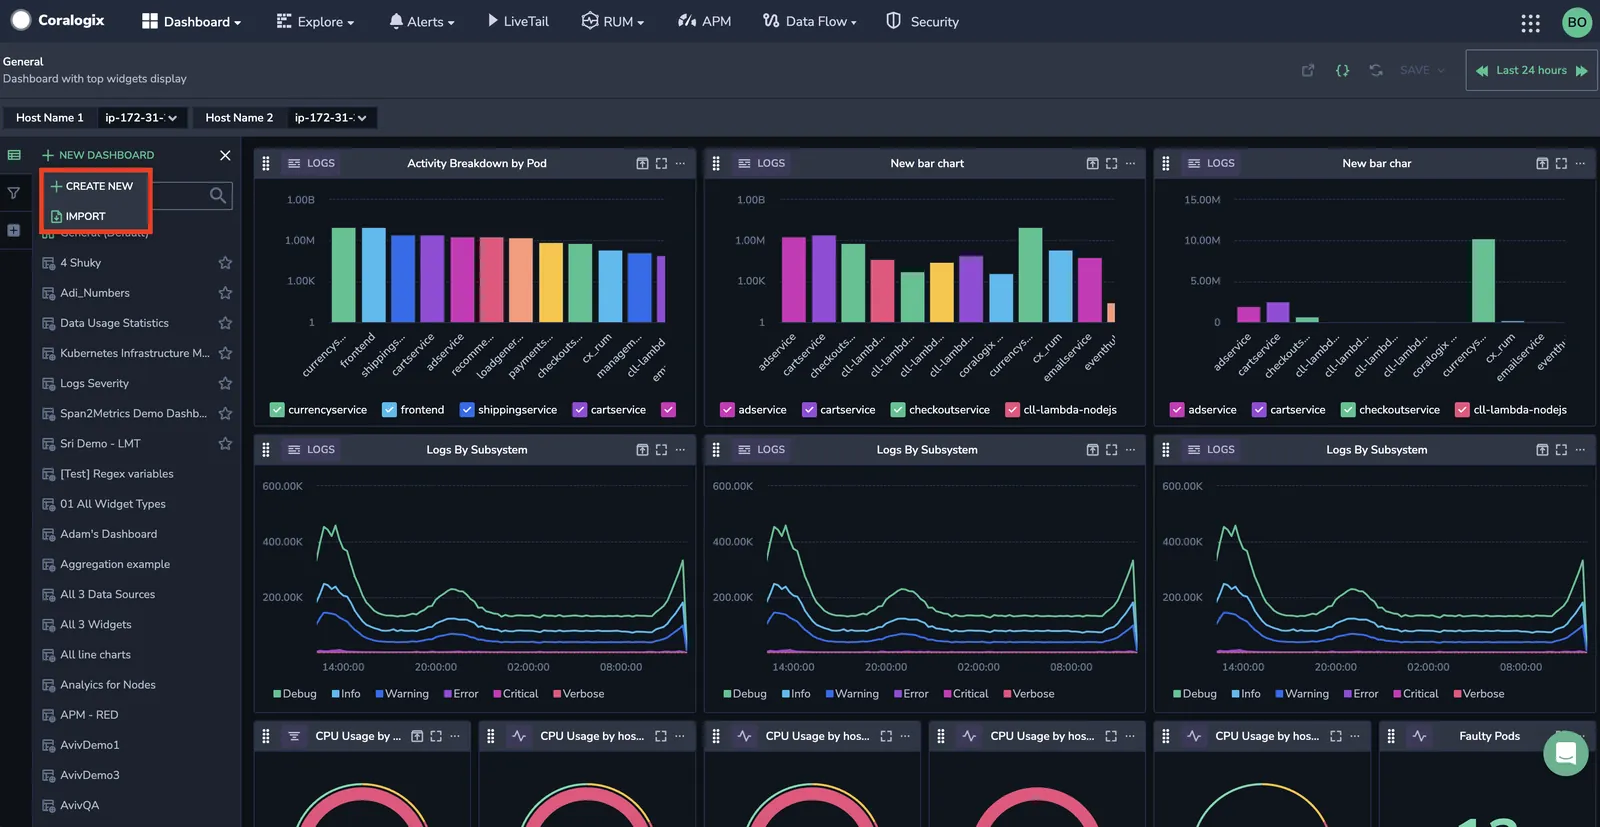
Coralogix is a modern observability platform built around log analytics, with expanding support for metrics, traces, and security monitoring. Unlike traditional log tools that require storing and indexing all data before analysis, Coralogix emphasizes streaming analytics — processing data in real time to reduce storage costs. It’s best for teams that generate high volumes of logs and want actionable monitoring insights without the expense of indexing everything.
Pros
Real-time log analytics with reduced storage overhead.
Expanding support for metrics, traces, and security data.
Strong fit for cloud-native and high-volume environments.
Flexible alerting and anomaly detection.
Competitive pricing compared to traditional log-first platforms.
Cons
Still log-centric compared to broader observability suites.
Less entrenched enterprise adoption than Splunk or Elastic.
Some advanced features require commercial tiers.
#14: AppDynamix
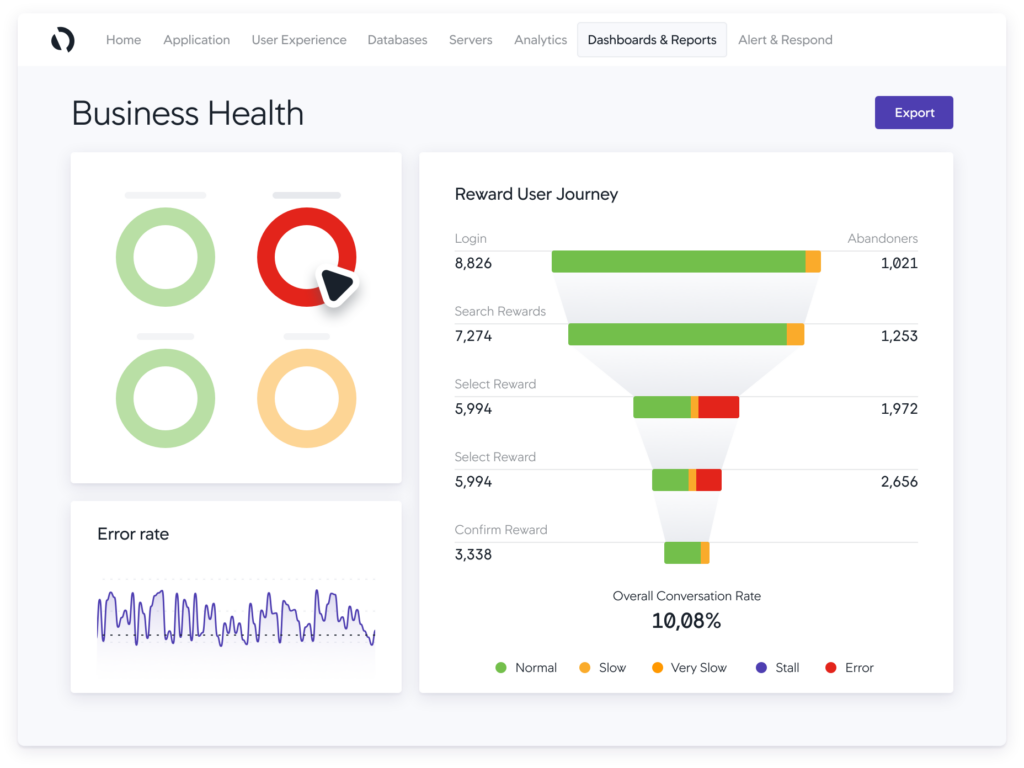
AppDynamics is a leading Application Performance Monitoring (APM) platform, now part of Cisco’s observability portfolio. It specializes in deep application monitoring, giving developers and operations teams visibility into transaction flows, dependencies, and code-level performance. AppDynamics is best for enterprises that want to tie application performance directly to business outcomes, with strong monitoring of complex distributed systems.
Pros
Detailed APM with transaction tracing and code-level diagnostics.
Business transaction monitoring connects performance to outcomes.
Strong enterprise adoption, especially in regulated industries.
Part of Cisco’s broader observability ecosystem.
Flexible deployment: on-premise or SaaS.
Cons
Narrower focus on application monitoring vs. full-stack observability.
Pricing can be prohibitive for smaller organizations.
Steeper learning curve than lighter-weight tools.
#15: Sentry
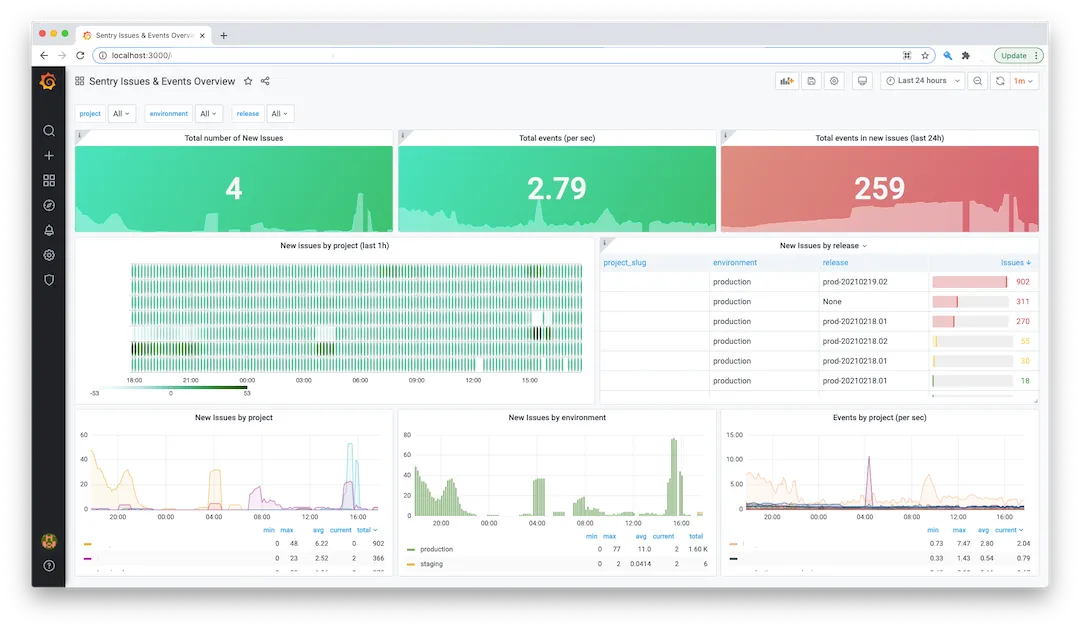
Sentry is a developer-focused error and performance monitoring platform. It captures exceptions, stack traces, and latency issues in real time, giving engineers direct visibility into how code behaves in production. With integrations into CI/CD pipelines and source control, Sentry connects monitoring data back to the lines of code and commits that introduced issues. It’s best for development teams that want lightweight, application-level monitoring rather than full infrastructure observability.
Pros
Real-time error tracking with detailed context for debugging.
Performance monitoring across front-end and back-end applications.
Strong developer integrations (GitHub, GitLab, Slack, Jira).
Open-source foundation plus hosted SaaS option.
Cons
Limited coverage for infrastructure and system metrics.
Not designed for full-stack observability or cost insights.
Larger organizations may need to pair it with broader monitoring suites.
The Bottom Line
The list of top AWS cloud monitoring tools of 2025 spans AWS-native basics like CloudWatch, enterprise observability suites such as Datadog and Dynatrace, and open-source mainstays like Prometheus and Grafana. Each tool has its niche — some excel at application performance, others at infrastructure uptime or log analysis.
But modern teams need more than point solutions. They need monitoring that’s tied to cost, automation, and business context. That’s where nOps sets itself apart: it provides Kubernetes and AI workload visibility like Kubecost or Lens, but with a lightweight agent that runs at a fraction of the overhead. Combined with cost intelligence and real-time optimization, nOps transforms monitoring from passive visibility into actionable FinOps.
Book a call to try it out with your own AWS account — it only takes 5 minutes to get started.
Frequently Asked Questions
Let’s dive into some FAQ about top AWS infrastructure monitoring tools.
What is the monitoring tool in AWS?
AWS offers Amazon CloudWatch as the primary monitoring tool. It collects metrics, logs, and events from resources and applications, enabling real-time visibility, dashboards, alarms, and automated responses to performance changes across your AWS environment.
Which AWS service is used for monitoring applications?
Amazon CloudWatch is widely used to monitor applications, capturing metrics, traces, and logs. For deeper insights, AWS X-Ray helps trace application requests, while CloudTrail logs API calls for auditing, enabling developers and operators to troubleshoot performance and availability.
How to monitor AWS infrastructure?
You monitor AWS infrastructure primarily with Amazon CloudWatch, which gathers metrics on compute, storage, networking, and databases. Combine it with CloudTrail for API activity logs, Config for compliance tracking, and alarms or dashboards for real-time visibility and alerts.
What is AWS CloudWatch and CloudTrail?
CloudWatch monitors performance, metrics, and logs for resources and applications. CloudTrail records all API calls, including identity, time, and action taken, supporting auditing, compliance, and security. Together, they provide a full picture of operational health and user activity.
Which AWS service is used for monitoring and observability?
Amazon CloudWatch provides monitoring and observability through metrics, logs, events, dashboards, and alarms. It integrates with services like X-Ray for tracing and OpenTelemetry for observability pipelines, enabling unified insights into system performance, reliability, and cost optimization across AWS environments.
