
Best AI Cost Observability Tools in 2026: Track LLM, Token and GPU Spend
KPMG’s global head of AI told The Wall Street Journal that some clients had burned through their annual token and cloud budgets within months, and one saw its token usage rise sixfold. Most companies would struggle to say where that money went and what value it delivered. 98% of FinOps practitioners now manage AI spend, yet three in four enterprises can’t confidently prove AI business outcomes to their CFO.
This guide covers AI cost observability, how to do it well, and how ten industry-leading tools compare across key dimensions such as provider coverage, pricing model and best use case.
AI Cost Observability Tools at a Glance (2026)
Here is how the ten tools in this guide compare, with detailed breakdowns below.
Tool | Layer | What it tracks | Providers covered | Open source | Pricing model | Best for |
|---|---|---|---|---|---|---|
nOps | Cost attribution + optimization + budget governance | Hourly AI, cloud, and SaaS spend by team, product and feature | All major AI providers and coding tools; AWS, Azure, GCP; Major SaaS platforms; Gateway/OTLP integrations | No | Flat fee on cloud spend; percentage-of-savings for optimization | Unified fine-grained AI, Cloud & SaaS cost visibility & automated optimization in one platform |
Helicone | Gateway / observability | Per-request tokens, cost, latency | 100+ models via gateway | Yes | Free; $79–$799/mo plus usage | Fast request logging (now in maintenance mode) |
Langfuse | Observability | Traces, cost per trace, evaluations | Model-agnostic via SDKs and OpenTelemetry | Yes | Free; $29–$2,499/mo plus usage | Agent tracing and evaluations |
Portkey | Gateway | Per-request cost; budgets per key | Major providers via one API | Partly | Free; $49/mo plus usage; Enterprise custom | A governed entry point for model traffic |
LiteLLM | Gateway (self-hosted) | Spend by key, user, team and tag | 100+ providers | Yes | Free; Enterprise by request capacity | Self-hosted per-team budgets |
TrueFoundry | Gateway + model serving | Per-request cost; budgets by cost center | Major APIs plus self-hosted models | No | Free; $499–$2,999/mo; Enterprise custom | Gateways inside a regulated security perimeter |
Datadog LLM Observability | Observability | LLM spans, estimated cost, quality | Major providers via SDKs | No | Free tier; Pro from $160/mo plus usage | Teams already on Datadog |
Arize Phoenix | Observability | Traces, cost, evaluations | Major providers and frameworks | Yes | Free; AX Pro $50/mo; Enterprise custom | Quality- and evaluation-focused teams |
CloudZero | Cost attribution | AI and cloud spend by customer and feature | OpenAI, Anthropic, Bedrock; clouds; 50+ sources | No | Based on spend under management | Unit economics and per-customer margin |
Vantage | Cost attribution | AI and cloud spend by model, key and developer | OpenAI, Anthropic, Cursor; clouds; 20+ providers | No | Free tier; fixed tiers by tracked spend | Self-service AI and cloud cost reporting |
What Is AI Cost Observability?
In this guide, we use “AI cost observability” broadly to mean gaining detailed visibility into what AI workloads cost and where that spend comes from. It covers API tokens from model providers, models bought through cloud platforms like Amazon Bedrock, AI coding tools like Cursor and Claude Code, and the GPU hours behind self-hosted models.
That is also what buyers say they want from providers. In the State of Tokenomics survey of 472 organizations, released in September 2026, 23% asked model and token providers for more transparency and more granular data, and only 4% asked for lower prices. What buyers want, in the report’s words, is “a bill they can explain to a CFO.”
What AI cost observability tracks
AI cost observability tracks what every model call costs, with tokens broken out by type, and rolls that cost up along the dimensions the business cares about. Type matters because input, output and cached tokens are priced differently. On Claude Sonnet 5.5, for example, input costs $2 per million tokens and a cache hit $0.20, so a tool that reports one total can't explain why a bill changed. The main dimensions are:
- Model and provider. The same Claude model is sold through Anthropic’s API, Amazon Bedrock, Google Cloud and Microsoft Foundry, and the price can differ by channel. Regional endpoints on Bedrock and Google Cloud carry a 10% premium over global endpoints.
- Prompt version. A longer system prompt raises the cost of every call that uses it, so cost needs to be comparable across prompt versions.
- Agent run. For agents, the useful unit is the whole task: every model call, tool call and retry in one run, summed into a cost per completed task.
- User, team, feature and customer. These are the dimensions behind showback, chargeback and per-customer margin, and they are the ones provider billing leaves out.
- GPU hours. Self-hosted and fine-tuned models are billed as compute, not tokens. 31% of organizations run AI on rented cloud or neocloud GPUs and 29% on private hardware, so token tracking alone misses part of the bill for a large share of companies.
AI cost observability vs related terms
Traditionally, observability means monitoring how software performs using metrics, logs and traces, and platforms like Datadog, New Relic and Dynatrace are built for it. AI cost management and governance are about spend instead: knowing what AI costs, who owns it, and keeping it within budgets and limits. “AI cost observability” is used loosely, but it often refers to the overlap between the two: applying observability’s near real-time, request-level data to spend, so teams can see what each model, agent, feature and team costs. That is how this guide uses the term.
Category | Question it answers | Main user | Typical data source |
|---|---|---|---|
LLM observability | Why did this request fail, slow down or return a bad answer? | Engineers | Traces and logs from an SDK, OpenTelemetry or a proxy |
Cloud cost management | What did we spend on cloud services, and who owns it? | FinOps and finance | Billing exports such as the AWS Cost and Usage Report |
AI cost observability | What did each AI request, feature and team cost, and was it worth it? | FinOps, platform and finance teams, with engineering | Provider usage and billing data plus request-level telemetry |
AI cost governance | Who owns this spend, what is it allowed to cost, and what happens when it goes over? | FinOps, finance and platform teams | Attributed spend data plus budgets, alerts and usage controls |
In practice, most platforms overlap with multiple terms. LLM observability tools like Langfuse and Helicone now calculate cost per trace, gateways like LiteLLM and Portkey enforce budgets, and cost platforms are adding AI providers.
Why AI spend is hard to see
Cloud bills grow with resources someone provisioned. AI bills grow with behavior: how much text goes into each call, how long the model reasons, how many times an agent loops. That makes them move faster and less predictably.
- Token pricing is the first problem. Output costs five times as much as input on every current Claude model, and reasoning models add output nobody sees: OpenAI bills internal reasoning tokens as output even though they aren’t returned through the API. Prices can also shift under the same prompts. Anthropic’s newer models use a tokenizer that produces about 30% more tokens for the same text, so an upgrade can raise costs with no code change.
- Retries and fallbacks are billed like any other call. A request that times out and is retried, or falls back to a second model, can be billed twice, and OpenAI notes that a request that hits its output limit can incur input and reasoning costs without returning a visible answer. In a provider dashboard, all of it looks like ordinary usage.
- Agent loops multiply everything above. Every tool definition is billed as input on every call (on Claude, the computer-use toolset alone adds about 4,500 input tokens per request), and agents make many calls per task. In Anthropic’s data, agents use about 4× the tokens of chat interactions, and multi-agent systems about 15×. A loop that never finishes keeps billing until something stops it.
- Spend is also split across providers and channels. 96% of organizations buy from model providers directly, 87% through cloud platforms such as Bedrock, Vertex and Azure Foundry, and 64% through embedded tools such as Cursor and Databricks Genie. Each one arrives on a different invoice, in a different format, on a different schedule.
- Finally, provider dashboards and cloud invoices don’t attribute spend to the features, products and customers the business tracks. Connecting each request to what it served is left to you.
Key Features to Look for in an AI Cost Observability Tool
The State of Tokenomics asked organizations which capabilities matter most, and their answers clustered around value attribution, economic modeling of AI impact, model routing, governance controls and demand forecasting.
Per-request token and cost tracking across providers
Every model call should be recorded with its tokens broken out by type (uncached input, cache writes, cache reads, output and reasoning) and priced at the rate actually charged, across every provider you use: OpenAI, Anthropic, Bedrock, Azure OpenAI, Vertex and anything self-hosted. The rate matters as much as the count, because the same token costs different amounts depending on how it was bought. On Anthropic’s API, a cache read costs a tenth of base input and the Batch API halves input and output prices. A tool that applies list price to everything won’t match your invoice.
Cost attribution by model, prompt, feature, team and customer
Attribution turns an AI bill into something finance can act on: cost broken down by model, prompt, feature, team and customer, which is what showback, chargeback and per-customer margin depend on. Tools get there in three ways:
- Request tags. Gateways and SDKs such as Portkey, Helicone and Langfuse attach metadata like feature, customer ID or prompt version to each call. The detail is fine-grained, but it only covers traffic that runs through them.
- Keys and workspaces. A separate API key or workspace per team splits spend without code changes, but breaks down when keys are shared.
- Cloud tags. On Bedrock, application inference profiles carry cost allocation tags into AWS billing, though tags only apply from the date they’re activated.
Whatever the method, some spend arrives untagged: shared keys, shared infrastructure, and tools like Cursor and Claude Code that bill separately. A good attribution feature has rules to allocate that remainder, so the total assigned to owners matches the total billed.
Agent- and workflow-level cost tracing
Agents break per-request reporting. One task can make dozens of model calls, tool calls and retries that each look reasonable on their own, and the total only shows up when they’re grouped by run. Agent-level tracing ties every step to a run or session ID and reports cost per completed task, which is the number that tells you whether an agent is worth running. It also catches loops: a run that keeps calling tools without finishing shows up as an outlier long before the monthly bill does. Most tools build this on tracing, increasingly using the OpenTelemetry GenAI conventions, which define standard fields for token usage and agent steps.
Budgets, rate limits and anomaly alerts before the invoice lands
In KPMG’s survey, only 36% of organizations have direct token or usage controls. Controls come in two forms:
- Alerts and anomaly detection flag spend that crosses a threshold or breaks from its normal pattern, on any spend the tool can see.
- Enforced limits block or throttle requests at a token or dollar cap, which requires sitting in the request path (usually a gateway) or using the provider’s own spend limits.
Budgets are most useful when they can be scoped to a team, model or project and paired with a forecast, so the warning arrives while there’s still time in the month to act. How fast an alert fires depends on how fresh the data is: Anthropic’s cost report, for instance, returns costs in daily buckets, while hourly data can catch a runaway job much sooner.
Provider and stack coverage
Most companies buy AI through several channels at once. Half of AI consumers spread across four of six procurement and hosting channels. A tool needs native, automatic coverage of each one you use:
- Model provider APIs: OpenAI, Anthropic, Google Gemini and others billed directly.
- Cloud AI platforms: Amazon Bedrock, Azure OpenAI and Microsoft Foundry, and Google Vertex AI, billed through the cloud invoice.
- AI coding tools: Cursor, Claude Code, OpenAI Codex and GitHub Copilot, often billed per seat plus usage.
- Self-hosted models: GPU instances and Kubernetes clusters, billed as compute rather than tokens.
Coverage that depends on CSV uploads, or that stops at one provider, leaves the rest of the bill out of every report built on it.
Integration method
Tools collect data in one of three ways, and the method determines what they can see and whether they can enforce limits.
Method | How it works | Strengths | Tradeoffs |
|---|---|---|---|
Proxy or gateway | Apps send model calls through the tool by changing the API base URL | Real-time, per-request data; can enforce rate limits, budgets and routing | Adds a network hop and a dependency in the request path; sees prompt content; misses traffic that bypasses it |
SDK or OpenTelemetry | Application code is instrumented to emit a trace for each call | Rich context such as agent steps, prompt versions and user IDs | Engineering work for every service; coverage depends on instrumentation; GenAI conventions not yet stable |
Billing and usage data | The tool pulls provider cost APIs, cloud billing exports and usage logs | No code changes; covers all spend; reconciles to the invoice | Less request-level context; data is often hourly or daily rather than real time |
Pricing, self-hosting and data residency
AI cost tools are priced by logged requests or events, by seats, by a percentage of managed spend, or as a flat platform fee, and several open-source options can be self-hosted for free.
Gateways and tracing tools that capture full prompts and completions hold sensitive content, so check where that data is hosted, how long it is kept, and whether content capture can be turned off while token counts are kept.
The Best AI Cost Observability Tools Compared
Seven of the tools below work at the request level and three are cost-attribution platforms. Three of the request-level tools also changed hands this year: ClickHouse acquired Langfuse in January, Mintlify acquired Helicone in March, and Palo Alto Networks closed its acquisition of Portkey in May. Each entry below covers the tool’s layer, what it tracks, the providers it covers, its pricing and who it fits best.
1. nOps - AI cost attribution and automated optimization
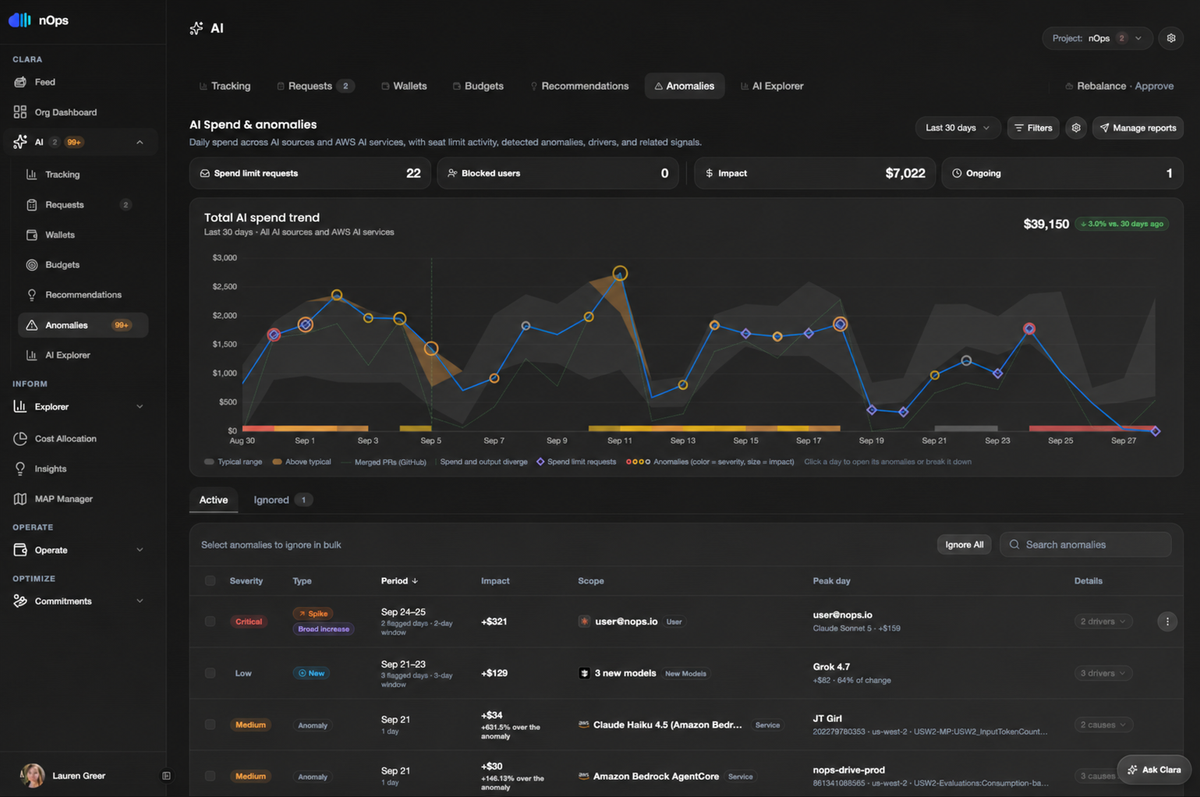
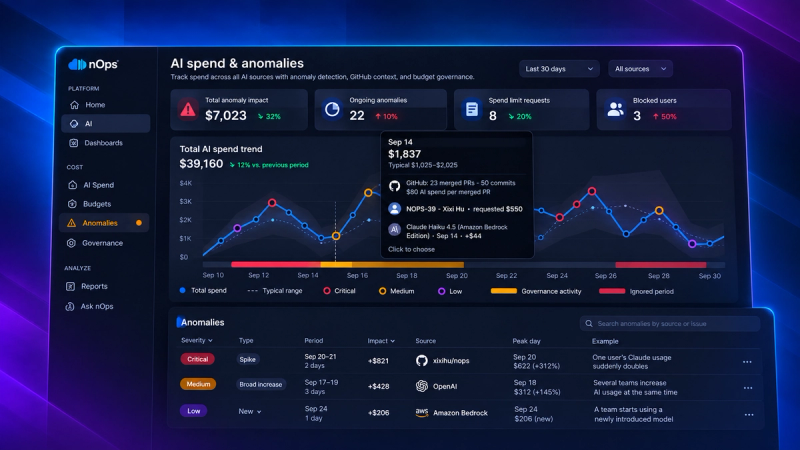
nOps attributes AI, multicloud, SaaS and Kubernetes spend to the teams, products and features that generated it, including untagged spend, with hourly data feeding showback, budgets and forecasts. For AI specifically, it adds anomaly detection with GitHub context, automated budget governance, and recommendations such as model substitution and cache tuning. Clara, its FinOps agent, answers questions about allocation, anomalies and token costs in plain language, from the nOps console or from AI tools like Claude and Cursor.
It is also the only platform in this list that pairs that hourly fine-grained visibility with automated optimization of the pricing layer, the biggest lever on a cloud bill. Savings Plans, Reserved Instances and committed-use discounts cut compute rates by up to 72% compared with On-Demand without changing underlying workloads. nOps buys and manages those commitments across AWS, Azure and GCP, adjusts them every hour as usage shifts, and is paid only a share of the savings it generates. The other platforms here stop at recommendations or, in Vantage’s case, automate AWS Savings Plans only.
- Layer: Cost attribution plus automated rate optimization.
- What it tracks: Token and usage costs, cache costs and developer-tool spend, alongside compute, Kubernetes and SaaS costs.
- Providers covered: All major AI providers and AI coding tools, plus AWS, Azure, GCP, Kubernetes and SaaS.
- Pricing: A flat fee based on cloud spend for visibility and allocation, and a percentage of realized savings for commitment management, with a 14-day free trial.
- Best for: FinOps, finance and platform teams that want AI spend managed alongside the rest of the cloud bill, with the pricing layer optimized automatically rather than by hand.
2. Helicone
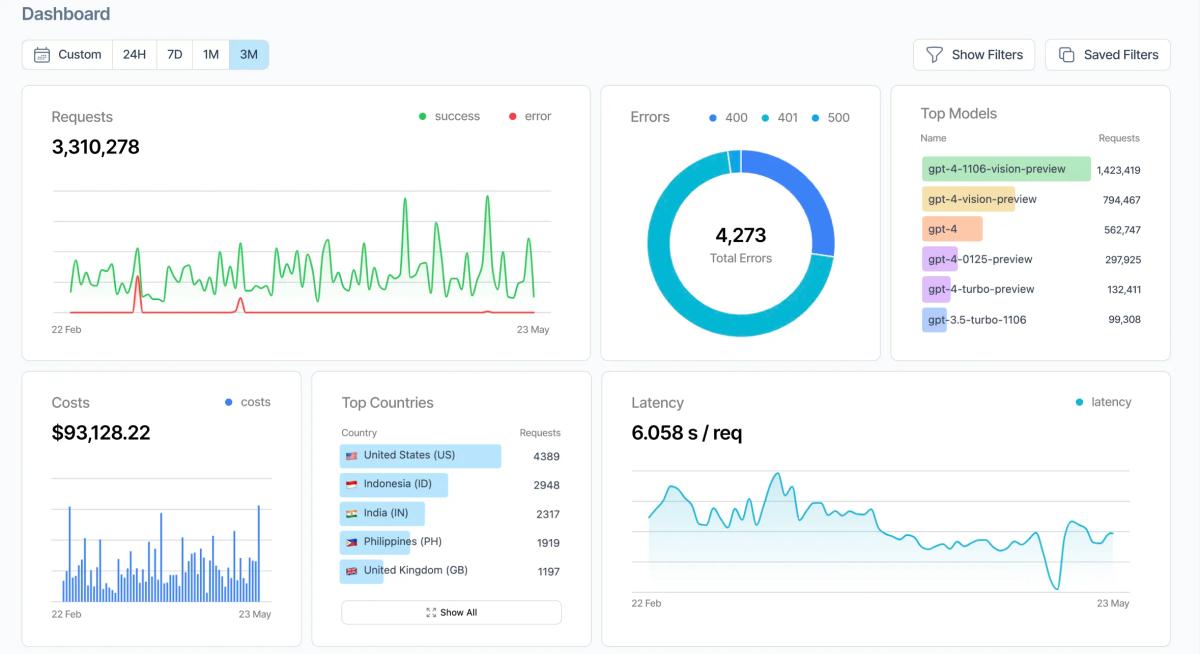
Helicone is an open-source LLM observability platform and AI gateway built around a one-line integration: change the API base URL and every request is logged with its tokens, latency and cost. It adds caching, rate limiting and routing across providers, and it is open source under Apache 2.0, so it can be self-hosted. Buyers should know that after Mintlify acquired Helicone in March 2026, the hosted product moved into maintenance mode: security updates, bug fixes and new models continue to ship, but new features don’t.
- Layer: Request-level (proxy and gateway, with an async SDK option).
- What it tracks: Per-request tokens, cost and latency, plus users and custom properties attached to each request.
- Providers covered: OpenAI, Anthropic, Gemini, Bedrock, Azure and 100+ models through its gateway.
- Pricing: Free Hobby tier; Pro at $79/month and Team at $799/month, each with usage-based charges above 10,000 requests.
- Best for: Small engineering teams that want request logging with minimal setup and are comfortable self-hosting or using a product in maintenance mode.
3. Langfuse
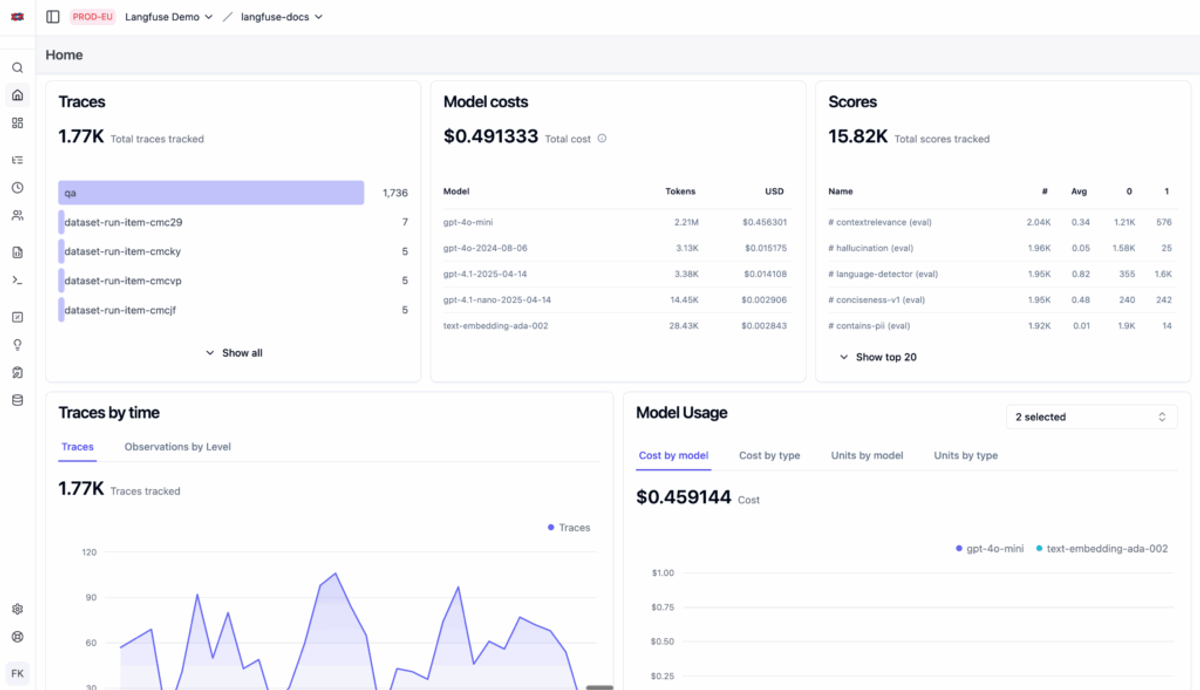
Langfuse is an open-source LLM engineering platform for tracing, evaluations and prompt management. Every trace carries token counts and cost, and because a trace captures a full agent run (nested model calls, tool calls and retrieval steps), it is one of the stronger options for seeing what a multi-step agent costs per run. It integrates through SDKs and OpenTelemetry rather than a proxy, so it adds nothing to the request path. ClickHouse acquired Langfuse in January 2026; it remains MIT-licensed and self-hostable, and Langfuse Cloud continues as a standalone service.
- Layer: Request-level (SDK and OpenTelemetry tracing).
- What it tracks: Traces and spans with tokens, cost and latency, plus prompt versions, user and session IDs, and evaluation scores.
- Providers covered: Model-agnostic, with integrations for OpenAI, Anthropic, Bedrock, Vertex and frameworks such as LangChain and LlamaIndex.
- Pricing: Hobby free (50k units/month); Core $29/month; Pro $199/month; Enterprise $2,499/month; self-hosting free.
- Best for: Engineering teams building agents who want tracing, evaluations and cost per trace in one open-source tool.
4. Portkey
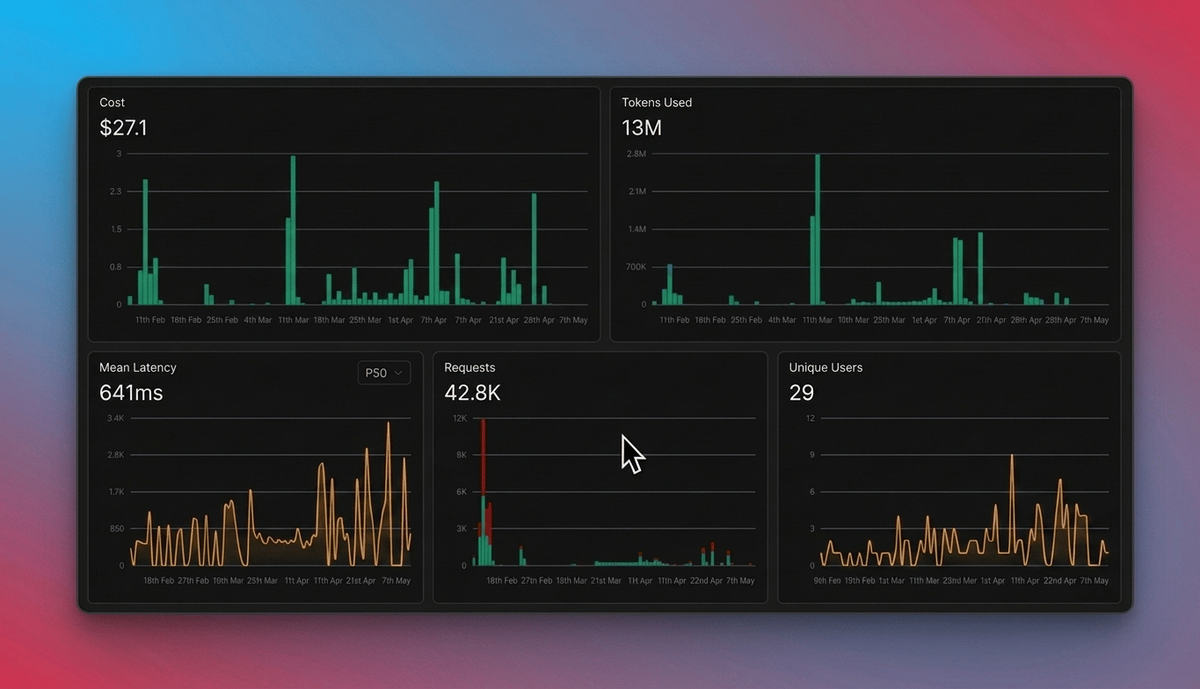
Portkey is an AI gateway and control plane. Applications route model calls through it, and it handles routing, fallbacks, caching, guardrails and spend limits, with logs and per-request cost for everything that passes through. Palo Alto Networks completed its acquisition of Portkey in May 2026, and Portkey now serves as the AI gateway in Palo Alto’s Prisma AIRS security platform, so expect its roadmap to lean toward AI security and agent governance.
- Layer: Request-level (gateway).
- What it tracks: Requests, tokens, cost, latency and custom metadata per call, with budgets and rate limits per key.
- Providers covered: The major model providers and cloud AI platforms through a single API.
- Pricing: Developer tier free (10k recorded logs/month, not for production); Production $49/month with 100k logs plus $9 per additional 100k; Enterprise custom, which is where granular budget and rate limits sit.
- Best for: Platform and security teams that want one governed entry point for all model traffic, especially those already using Palo Alto Networks.
5. LiteLLM
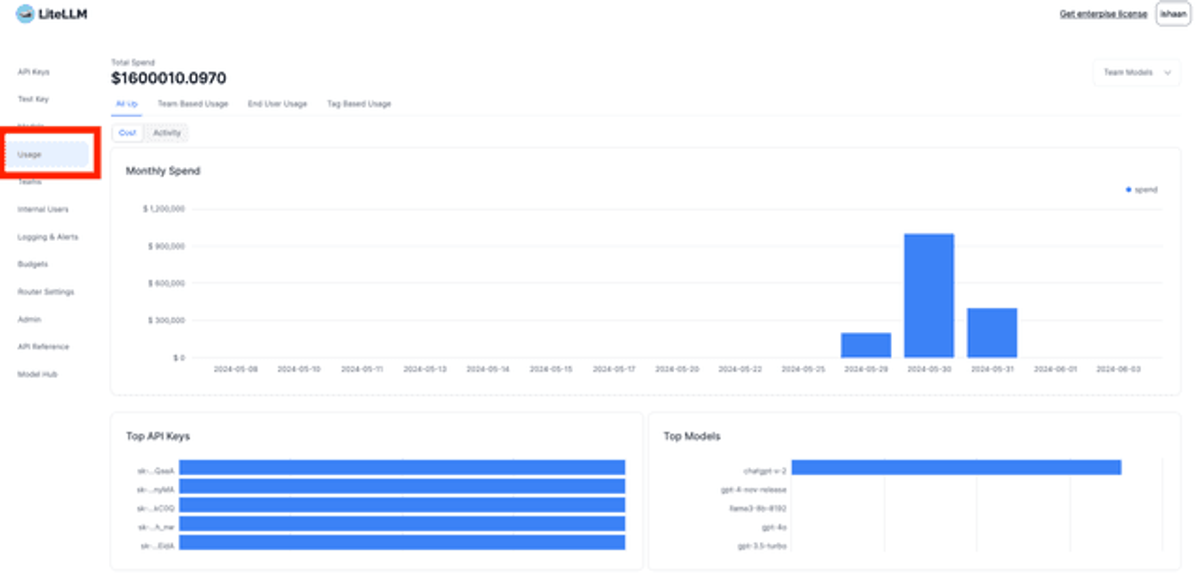
LiteLLM is an open-source proxy that puts 100+ model providers behind a single OpenAI-compatible API. Its cost strength is enforcement included in the free version: virtual keys, budgets, rate limits and spend tracking by key, user, team and organization are part of the open-source tier, with Enterprise adding SSO, audit logs and support. Because it is self-hosted, you run and secure it yourself. In March 2026, two compromised releases (1.82.7 and 1.82.8) were published to PyPI in a supply-chain attack before PyPI quarantined the project, a reminder to pin versions for anything in the request path.
- Layer: Request-level (self-hosted proxy).
- What it tracks: Spend per request, key, user, team, model and custom tag.
- Providers covered: OpenAI, Anthropic, Azure, Gemini, Bedrock and 100+ other providers.
- Pricing: Open source and free to self-host; Enterprise priced by gateway request capacity, never per token.
- Best for: Platform teams with the capacity to run their own gateway that want hard per-team budgets without a SaaS bill.
6. TrueFoundry
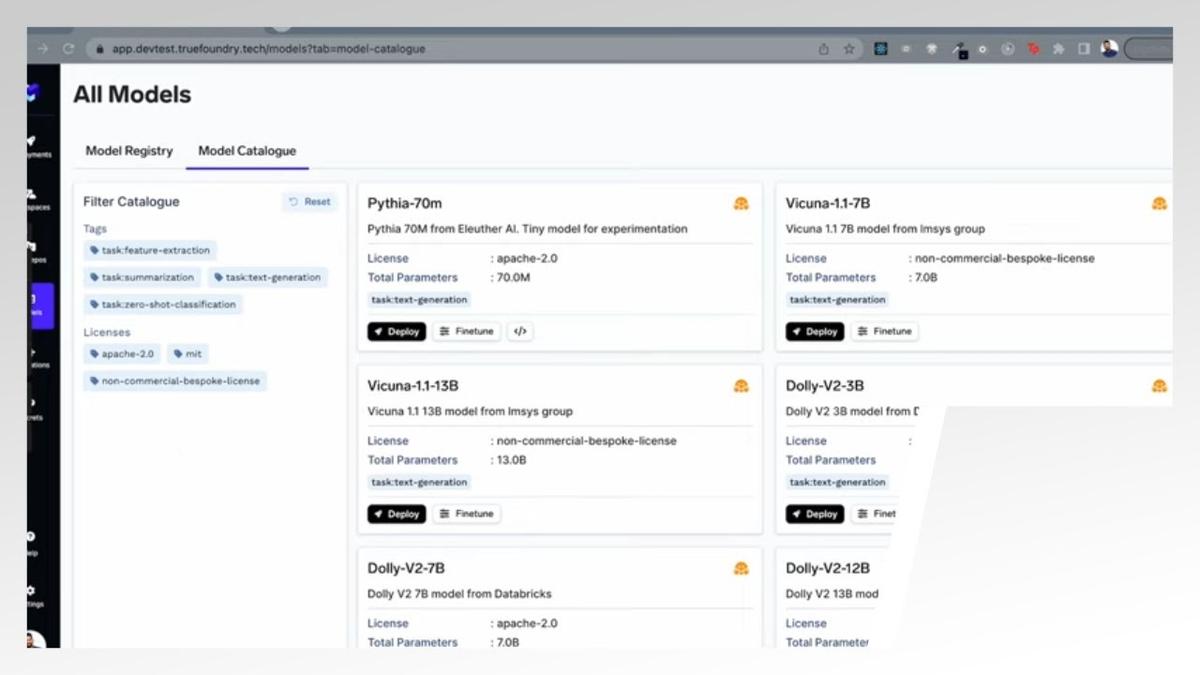
TrueFoundry combines an AI gateway with a platform for deploying models, agents and MCP tools, and it can run inside your own cloud, VPC or an air-gapped environment. The gateway tracks cost per request and enforces hierarchical budget and rate limits. Because TrueFoundry also serves self-hosted models on your own GPUs, it can cover token spend and the infrastructure behind open-weight models in one place.
- Layer: Request-level (gateway), plus model serving.
- What it tracks: Per-request cost, tokens and latency, tagged by cost center, with budgets and rate limits.
- Providers covered: The major model APIs plus self-hosted models on your own GPU capacity.
- Pricing: Free Developer tier (50k requests/month); Pro from $499/month; Pro Plus $2,999/month; Enterprise custom.
- Best for: Enterprises in regulated industries that need a governed gateway and model serving inside their own security perimeter.
7. Datadog LLM Observability
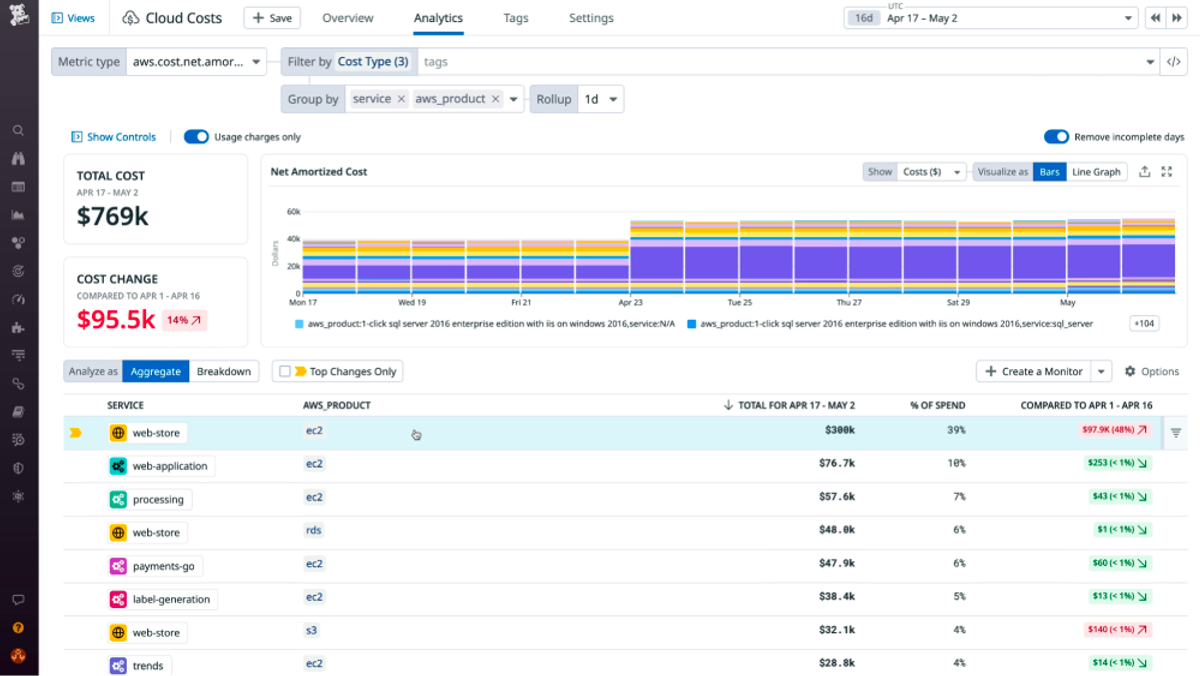
Datadog LLM Observability traces LLM calls and agent workflows inside the platform many teams already use for APM, logs and infrastructure. It estimates the cost of each request from providers’ public pricing and token counts, across 800+ models, so cost sits next to latency, errors and quality evaluations. Because those figures come from list prices, they won’t reflect negotiated discounts, and they won’t reconcile exactly to the invoice.
- Layer: Request-level (SDK tracing, with OpenTelemetry support).
- What it tracks: LLM spans with tokens, estimated cost, latency, errors and evaluations.
- Providers covered: OpenAI, Anthropic, Gemini, Bedrock and other providers through SDK integrations.
- Pricing: A free tier with 40,000 LLM spans/month, and Pro from $160/month on annual billing with 100,000 LLM spans included.
- Best for: Teams already standardized on Datadog that want AI cost and performance alongside the rest of their telemetry.
8. Arize Phoenix
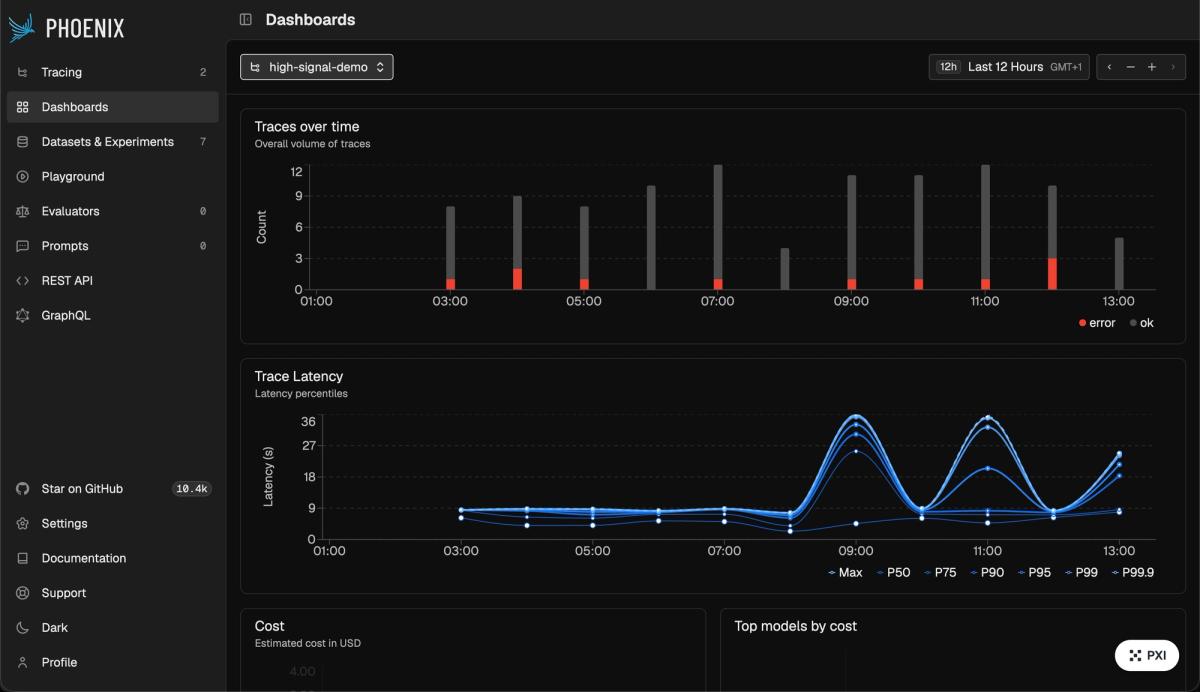
Phoenix is Arize’s open-source tracing and evaluation tool, built on OpenTelemetry, with token and cost tracking on each trace. Its focus is quality: evaluations, LLM-as-a-judge scoring and experiments, with cost as one of the signals. The open-source version is free to self-host, and Arize AX is the managed platform for larger teams.
- Layer: Request-level (OpenTelemetry tracing).
- What it tracks: Traces and spans with tokens, cost, latency and evaluation scores.
- Providers covered: OpenAI, Anthropic, Bedrock, Vertex and major agent frameworks through its instrumentation libraries.
- Pricing: Phoenix free to self-host; AX Free; AX Pro $50/month; AX Enterprise custom.
- Best for: AI engineering teams whose main concern is model quality and evaluation, with cost tracked alongside.
9. CloudZero
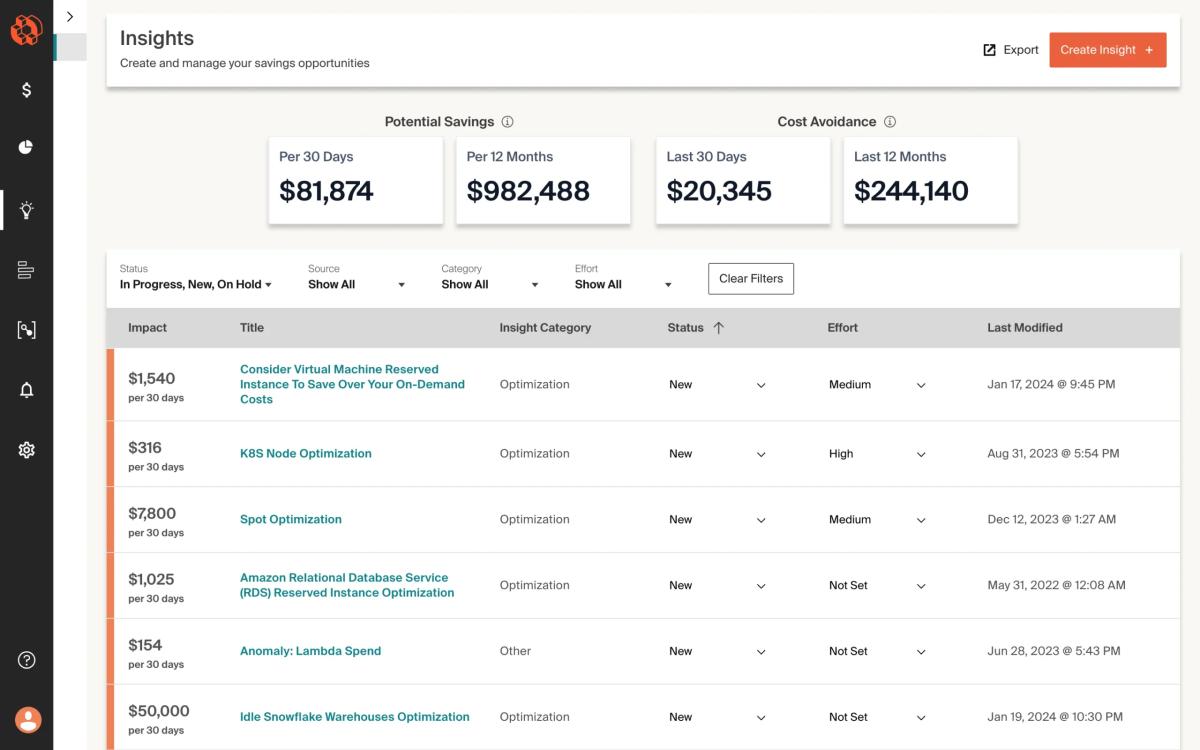
CloudZero is a cloud cost platform that treats AI providers as cost sources alongside AWS, Azure, GCP, Kubernetes and SaaS. Its allocation engine assigns 100% of cloud and AI costs, including untagged and shared spend, to products, features or customers. Its main strength is unit economics: it combines Anthropic spend with your own telemetry to calculate cost per customer, per feature and per transaction.
- Layer: Cost attribution (billing and usage data).
- What it tracks: AI spend by model, token, customer, feature and environment, alongside cloud and SaaS costs.
- Providers covered: OpenAI, Anthropic, Bedrock, AWS, Azure, GCP and 50+ other cost sources.
- Pricing: Not published; tiers are based on the annual cloud spend a customer brings onto the platform.
- Best for: Engineering-led organizations focused on unit economics and per-customer margin.
10. Vantage
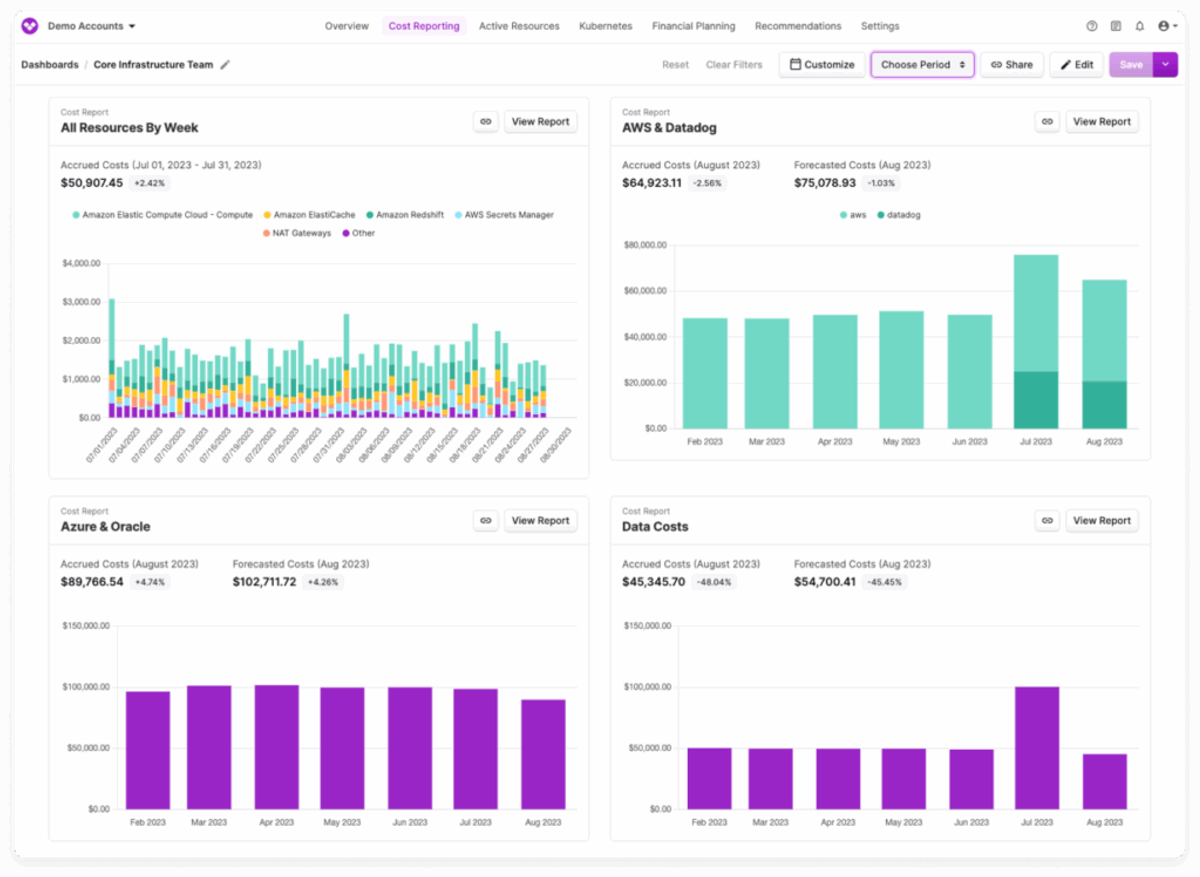
Vantage is a cloud cost management platform with native integrations for OpenAI, Anthropic and Cursor, so AI spend appears in the same cost reports, budgets and forecasts as AWS, Azure and GCP. It connects through providers’ admin APIs. For Anthropic, that means token counts by model, workspace, API key and service tier, refreshed daily, and a 2026 expansion to Claude Enterprise analytics covers per-user spend across products like Claude Code.
- Layer: Cost attribution (billing and usage data).
- What it tracks: AI spend by model, workspace, key, developer and project, alongside cloud and SaaS costs.
- Providers covered: OpenAI, Anthropic (API and Claude Enterprise), Cursor, plus AWS, Azure, GCP, Kubernetes and 20+ other providers.
- Pricing: A free Starter tier and fixed-rate paid plans based on tracked cloud spend.
- Best for: Developer-led teams that want self-service AI and cloud cost reporting with predictable tool pricing.
Native provider and cloud tools and where they fall short
Every provider ships its own cost view, and each is the right place to start: Anthropic’s Console and usage and cost API, OpenAI’s Costs API, AWS Cost Explorer (with Bedrock application inference profiles for tagging), Azure Cost Management and Google Cloud Billing.
Their limit is scope. Each covers only its own provider and stops at its own keys, workspaces or projects, and none combines AI spend with the cloud infrastructure, GPUs and SaaS tools around it.
Gateway, Observability or Cost Layer? Why Most Teams Need Both
Organizations most confident in their AI value share two traits: spend that is metered and attributable across workloads and teams, and concrete business output metrics such as tickets, PRs or revenue. Request-level tools supply the first half for engineering, and cost-attribution platforms supply it for the business. Most organizations past early adoption end up needing both.
What the request-level layer tells you (and what it can't)
A gateway or tracing tool sees each call as it happens: the model, prompt version, tokens in and out, latency, errors, the agent step that made it, and its cost at list price. That is the detail engineers need to debug a slow agent, compare prompt versions or catch a loop in progress, and a gateway can block a request before the spend happens.
It can’t see anything outside its path. Calls that skip the gateway, AI coding tools like Cursor and Claude Code, Bedrock usage in other accounts, GPU instances running open-weight models, and the commitments and credits on the invoice are all invisible to it.
What the cost-attribution layer adds
The cost layer starts from the bill, so its totals match what was paid, including negotiated rates and commitments. It covers every channel the bill comes from, including the ones no gateway sees, and allocates that spend with the same rules finance uses for cloud: by team, product, feature, customer and environment, with shared and untagged costs split rather than left over.
With the full bill allocated, finance can work out unit economics such as cost per customer, cost per feature and AI’s share of product COGS. Organization-wide budgets, forecasts and anomaly alerts also belong here, since this is the only layer that sees all of the spend.
Example stack pairings by team size and maturity
- Early, one or two providers: the provider consoles plus an open-source tracer such as Langfuse or Phoenix shows cost per trace while spend is small.
- Scaling product teams on several providers: a gateway such as LiteLLM or Portkey for routing and per-key budgets, adding a cost-attribution platform once AI spend has to appear in showback and margin reporting. Teams already on Datadog can use its LLM Observability as the tracing layer.
- Enterprises with AI across many teams and clouds: a cost-attribution platform such as nOps, CloudZero or Vantage as the system of record for AI, cloud, Kubernetes and SaaS spend, with gateways or tracing wherever engineering teams need request-level control.
Why Provider Dashboards and Cloud Billing Aren't Enough for AI Spend
Claude bought through Claude Platform on AWS shows up on the AWS bill as a single Claude Consumption Unit line item, with Cost Explorer showing only aggregated CCUs. Most AI spend reaches the invoice in a similar form: correct in total, but with no record of which team, feature or customer it served.
One monthly total vs per-feature, per-user visibility
Each billing source breaks spend down only as far as its own data model goes. Anthropic’s usage and cost API groups by API key, workspace and model. Bedrock can attribute costs through tagged application inference profiles and IAM principals, but cost allocation tags only apply from the date they’re activated. Claude deployed through Microsoft Foundry reaches Azure Cost Management as aggregated CCUs. None of them reports what a feature, a user or a customer cost.
Chargeback needs every cost assigned to an owner, and per-customer margin needs AI costs matched to the customers who generated them. It is why buyers in the State of Tokenomics asked providers for billing standards such as FOCUS (19%) and better attribution and tagging (17%).
Business Contexts: tying AI and cloud spend back to teams, products and features
Business context means mapping every dollar to the units the business plans and reports in: teams, products, features, customers and environments. The same AI spend usually needs several of these views at once. Finance wants cost by cost center each month, an engineering lead wants it by service and squad each day, and a product owner wants cost per feature against revenue. A good allocation model builds all of them from one set of data rather than separate spreadsheets.
Shared costs are harder with AI than with most cloud services. One API key or gateway often serves several products, a vector database or embedding pipeline supports many features, and the GPU instances behind a self-hosted model sit on the cloud bill while its usage sits in request logs. Each shared item needs a rule: split it by a usage driver such as tokens or requests per product where that data exists, and by fixed percentages where it doesn’t. nOps Business Contexts, for example, builds separate business contexts for different roles over the same spend and splits shared costs by fixed percentages or proportional weighting.
From visibility to action - closing the loop with automation
The people who see a cost spike in a FinOps dashboard rarely own the code behind it, so an alert is only useful if it explains the change: which feature, model or deploy drove it, and what it cost compared with the week before.
Some fixes can run without a person. Frequent, well-understood actions, such as buying and adjusting commitments as baseline usage shifts, are good candidates for automation, and nOps runs that layer automatically. Changes that can affect output quality, such as switching models or trimming context, belong with the owning team as a recommendation with the expected saving attached. Tracking the time from anomaly to fix, and the share of recommendations acted on, shows whether the loop is working.
How to Choose the Right AI Cost Observability Tool
The State of Tokenomics found that organizations with defined ownership of AI economics are 3.7x more likely to show value to the CFO. The right tool depends on who owns AI spend and what they need from it.
Who needs it - engineers debugging cost vs finance/platform owning spend
Engineers debugging cost need to know which prompt, agent step or retry drove a spike, in close to real time. A tracing tool or gateway fits that job. Finance and platform teams that own spend need complete, invoice-accurate totals allocated to owners, with budgets and forecasts. A cost-attribution platform fits that job.
Once AI spend crosses several teams, both groups have questions, and the cost platform should be the system of record. A useful trial test is to have each group answer its own top question in the tool: an engineer explaining yesterday’s most expensive agent run, and finance producing last month’s AI showback by team.
Open source/self-hosted vs managed
Self-hosted open-source tools such as Langfuse, Phoenix, Helicone and LiteLLM have no license fee and keep prompts inside your environment, which matters for regulated data. Your team still has to run the database, scale ingestion, handle upgrades and secure anything in the request path.
Self-host when data can’t leave your environment and a platform team can run the tool. Otherwise, weigh a managed product’s subscription against the engineering time self-hosting would take. Either way, check who maintains the project. Three of the tools in this guide changed owners in 2026, and one hosted product is now in maintenance mode.
Single provider vs multi-provider/multi-cloud
If all AI usage runs through one provider, its console plus a tracer can carry you for a while. Nearly one in five already uses at least one of DeepSeek, Qwen, Kimi or GLM, and while 51% describe their usage as heavily frontier today, only 24% expect to next year.
More open-weight models means more self-hosted inference on GPUs, in whichever cloud has capacity. Pick a tool that covers the channels you’ll have next year, including self-hosted models and the AWS, Azure and GCP infrastructure they run on, not just the APIs you use today.
Observability alone vs observability + optimization
Some tools stop at dashboards and alerts, while others act on what they find. For example, Gateways enforce budgets and route traffic to cheaper models, and nOps automates commitment purchases across clouds and recommends model substitutions. Organizations using model routers are 4x more likely to be able to show CFO value.
When comparing vendors, ask whether the tool only alerts on a problem or can change something itself, such as buying a commitment or capping a budget.
Total cost of the tool vs the savings it unlocks
Compare a tool’s cost with the spend it manages and the savings it can produce, not only with other tools’ list prices. Pricing models scale with different things:
- Request-metered tools scale with traffic, and agent traffic multiplies calls. At 2 million recorded logs a month, Portkey’s Production plan comes to about $220 ($49 plus $9 per extra 100,000 logs), and at 1 million LLM spans Datadog Pro comes to about $880 ($160 plus $8 per extra 10,000 spans on annual contracts).
- Spend-based tools such as CloudZero, Vantage and nOps visibility scale with the size of the bill they manage.
- Savings-based pricing scales with results: nOps commitment management charges a share of the savings it generates, and Vantage Autopilot charges 5% of savings on AWS Savings Plans.
Model each candidate’s price at two to three times your current volume to see how its pricing scales.
How to Reduce AI Costs Once You Can See Them
Once you can see where AI spend is going, the main ways to reduce it are model choice, context and caching, spending limits, and engineering follow-through:
- Model routing and right-sizing models per task. On Anthropic’s price list, Claude Haiku 4.5 costs $1/$5 per million input/output tokens and Fable 5.1 costs $10/$50, a 10x difference. Sending classification, extraction and short answers to smaller models and reserving frontier models for hard reasoning cuts cost without changing the product. 86% of organizations are already evaluating or using a model router.
- Prompt and context trimming, caching. Input is billed again on every call, so long system prompts, tool definitions and conversation history add up across an agent run. On Claude, a cache hit costs a tenth of base input on most models, a five-minute cache write pays for itself after one read, and the Batch API halves prices for work that can wait.
- Token budgets and rate limits at the gateway. Hard caps per key, team or agent run stop runaway loops before they bill.
- Getting engineering to act on cost signals. Judge cost per completed task alongside quality in each release. Avoid rewarding raw usage: KPMG has warned that token leaderboards risk incentivizing activity over outcomes.
nOps brings AI spend into the same platform as your AWS, Azure, GCP, Kubernetes and SaaS costs, allocates all of it to the teams and products that generate it, and automates the pricing layer underneath. Book a free savings analysis or start a 14-day free trial to see your AI and cloud spend in one place.
FAQs
Short answers to the questions teams ask most often when they start tracking AI spend.
What are AI cost observability tools?
AI cost observability tools measure what AI workloads cost and attribute that spend to the models, prompts, agents, features, teams and customers behind it. They come in two types: request-level tools, such as gateways and LLM observability platforms, which record each model call, and cost-attribution platforms such as nOps, which allocate the full AI bill alongside cloud, Kubernetes and SaaS spend.
What is the difference between LLM observability and AI cost observability?
LLM observability tracks how each model call performed, including latency, errors and output quality, and usually estimates cost from list prices. AI cost observability tracks what AI actually costs, reconciled to the invoice and attributed to teams, features and customers, so finance can budget, charge back and measure margin.
Which AI cost observability tool is easiest to set up?
Gateways such as Portkey and Helicone are the fastest way to start logging requests: you change the API base URL and every call is recorded. Billing-based platforms such as nOps need no code changes at all, because they connect to provider and cloud billing data and cover every team and tool without instrumenting each application.
Which AI cost observability tools are open source?
Langfuse, Helicone, LiteLLM and Arize Phoenix are open source and free to self-host, and Portkey’s gateway is open source with a paid managed platform. Self-hosting removes license fees but means running, scaling and securing the tool yourself.
How do I track OpenAI or Anthropic spend per feature?
Tag every request with a feature identifier, either through a gateway or SDK that attaches metadata to each call, or by giving each feature its own API key, Anthropic workspace or OpenAI project. Then bring those tags and the providers’ usage data into one cost platform so feature-level spend reconciles to the bill. Provider consoles alone stop at the API key, workspace and model level.