 Skip to content


- Blog
- Cloud Management
- GCP Cost Monitoring: How to Track, Control, and Optimize Your Google Cloud Spend
GCP Cost Monitoring: How to Track, Control, and Optimize Your Google Cloud Spend
GCP cost monitoring gives finance and engineering teams a shared lens into where cloud dollars go and why spend changes week to week. Without that visibility, it’s easy to overshoot forecasts, miss discount opportunities, and discover waste only after the bill arrives.
This guide breaks down Google cost monitoring from the ground up: what it means, the metrics that matter, and native tools vs third-party platforms.
What Is GCP Cost Monitoring?
GCP cost monitoring is the practice of continuously tracking, analyzing, and reporting on Google Cloud Platform spending across projects, services, and teams. It goes beyond reading the monthly invoice. Effective cost management means understanding spend at the hourly or daily level, mapping costs back to business units, and catching anomalies before they compound.
At a basic level, GCP cost monitoring involves:
- Tracking actual spend against budgets and forecasts in near real-time
- Attributing costs to specific projects, labels, teams, or products using GCP’s resource hierarchy
- Alerting on budget thresholds and cost anomalies so teams can respond before overruns escalate
- Analyzing trends to identify underutilized resources or creeping serverless costs
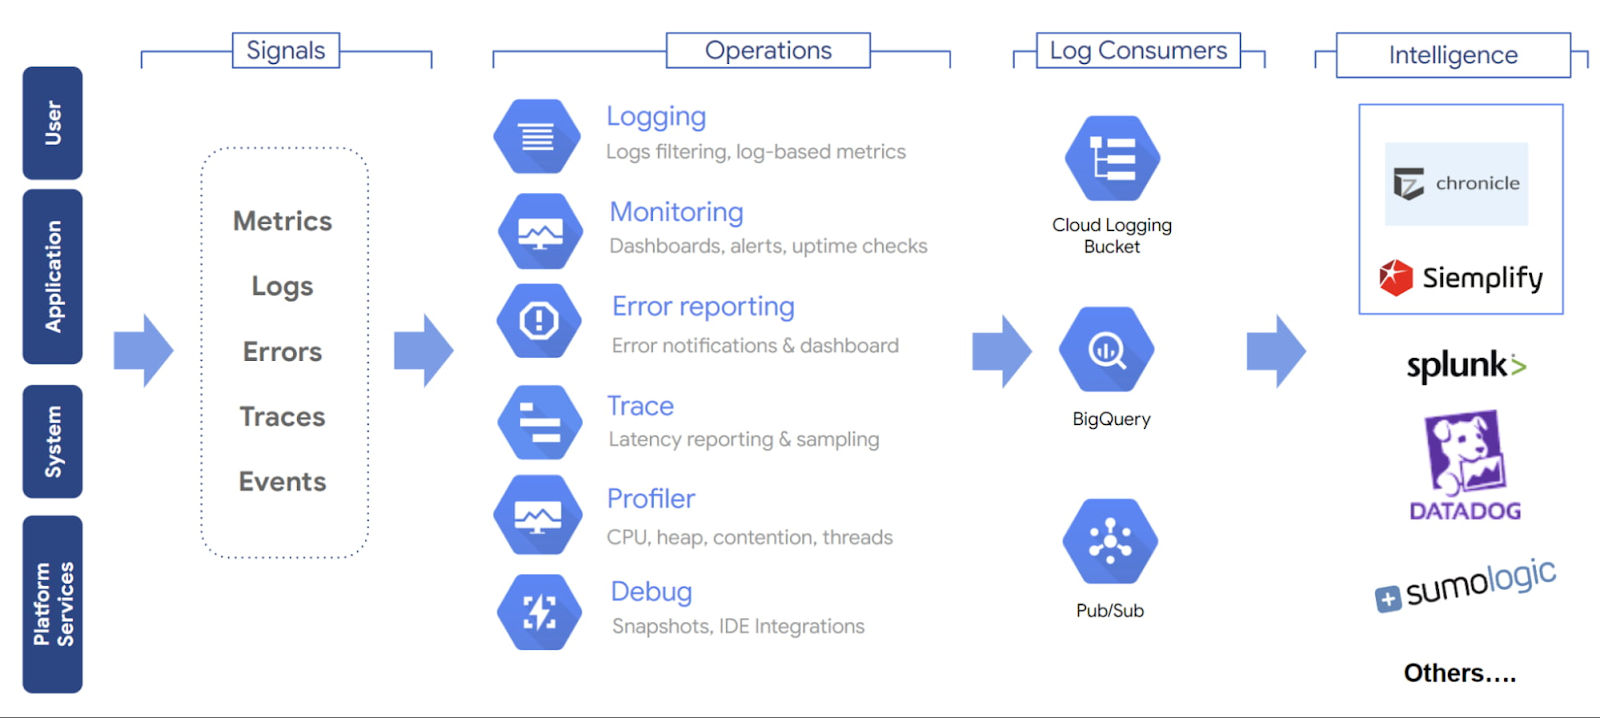
Google provides native cost management tools — including Cloud Billing Reports, Budget Alerts, Billing Export to BigQuery, and the Recommender Hub — that form the foundation. However, as organizations scale across multiple projects, regions, and service types, many teams find they need additional tooling for deep visibility and effective GCP cost optimization.
Why GCP Cost Monitoring Matters
Here is why monitoring your Google Cloud Platform costs matters more than ever:
Cloud costs scale faster than headcount. GCP is popular for workloads like genomics research, biotech analytics, clinical data processing, and AI model development because it can scale compute and storage quickly. But that same flexibility creates cost risk. A single unpartitioned BigQuery query across genomic datasets, an overprovisioned Vertex AI training job, or a misconfigured Dataflow pipeline can generate thousands of dollars in unexpected spend before anyone notices. Without continuous spend monitoring, these spikes often only surface when the invoice arrives.
Multi-project complexity obscures accountability. Modern Google Cloud environments often spread workloads across many projects, folders, and billing accounts — for example, separate projects for dev, staging, production, analytics, and AI experiments. Without consistent labels and cost attribution, teams may know spend is rising, but not which product, workload, or owner is responsible.
Serverless and AI workloads introduce unpredictability. Cloud Run, BigQuery on-demand queries, and Vertex AI create variable cost patterns that are difficult to forecast. As one industry analysis observed, serverless cost unpredictability is a defining GCP FinOps challenge in 2026.
Finance needs engineering data, and vice versa. FinOps as a practice has matured beyond quarterly cost reviews. Effective cloud cost management requires granular visibility into resource consumption across projects, accurate allocation mapped to products and business units, and real-time alerting. Google cloud cost management provides the connective tissue between engineering decisions and financial outcomes.
Commitment discounts only work with visibility. GCP offers CUDs that deliver up to 57% savings on compute and 35% on database services in exchange for one-year or three-year commitments. Committing without understanding actual usage patterns creates risk. Monitoring tells you where stable baselines exist.
How GCP Costs Work
Pay-as-You-Go Pricing
Sustained Use Discounts
Google automatically applies sustained use discounts when Compute Engine resources run for more than 25% of a billing month — up to approximately 30% for resources running the entire month. No commitment or upfront action is required. For monitoring purposes, your effective per-hour cost decreases as usage increases within a month, so projections based on early-month rates will overestimate actual costs.
Committed Use Discounts (CUDs)
Committed Use Discounts are Google Cloud’s equivalent of reserved capacity. You commit to a specific amount of vCPU, memory, GPU, or local SSD resources for one or three years in exchange for substantial discounts. According to Google Cloud documentation, Committed Use Discounts can reduce compute costs by up to 57% and database costs by up to 35%.
The monitoring implication: GCP CUD utilization must be tracked continuously. A Committed Use Discount that sits underutilized because workloads shifted wastes money just as surely as an idle VM. Effective Google cost management tracks CUD coverage rates, utilization percentages, and upcoming renewal dates.
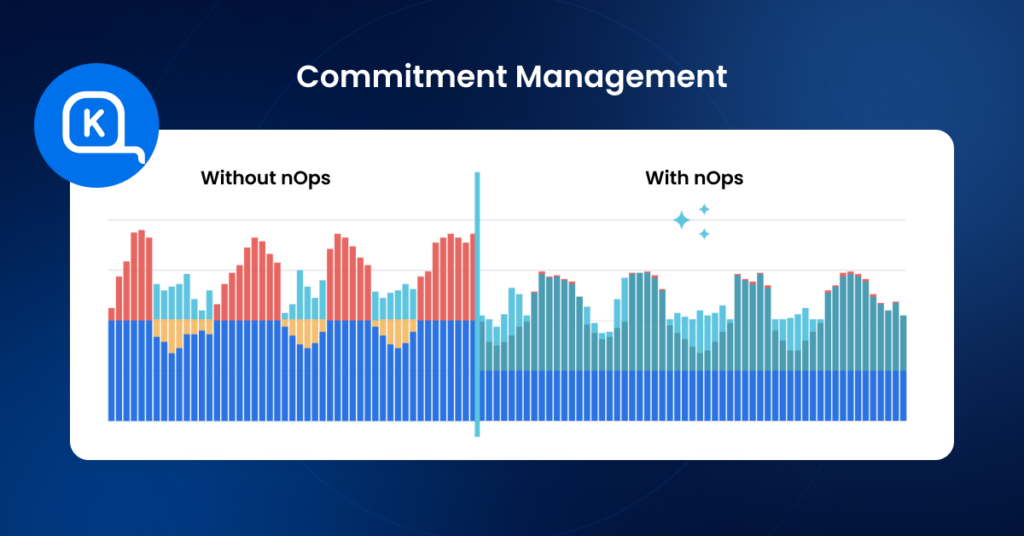
This mirrors challenges on other clouds as well. In nOps sales conversations, engineering leaders frequently describe the difficulty of committing to reservations when workloads are seasonal — one team saw database usage drop from $840/day to $24/day after a seasonal downsize, which would have turned a one-year commitment into pure waste without an automated solution to address savings and risk.
Key Cost Metrics to Track in Google Cloud
Actual Cost
Actual cost is the real spend incurred over a given period — hourly, daily, weekly, or monthly. It accounts for all pricing factors including sustained use discounts, CUD amortization, credits, and promotions.
Track actual cost at the project and service level, not just the billing account level.
Forecasted Cost
Budget vs. Actual
Setting budgets and tracking variance is fundamental. GCP supports budget alerts at the billing account, folder, or project level, with customizable threshold alerts. Set budgets at granular levels — a project-level budget catches overspend from a specific team before it becomes material at the organizational level.
Cost by Project
GCP’s resource hierarchy — organizations → folders → projects — is designed for cost attribution. Tracking cost by project reveals which applications, teams, or environments are driving spend.
Cost by Service (Compute, BigQuery, Storage)
Breaking spend down by Google Cloud service reveals which categories dominate your bill and where optimization efforts should focus. Common high-spend services include:
Compute Engine / GKE: VM instances, node pools, and container workloads — often the largest line item
BigQuery: Query costs (on-demand) or slot reservation costs (flat-rate) — notorious for unexpected spikes from unpartitioned tables or complex analytical queries
Cloud Storage: Storage volume plus egress charges — egress costs between regions or out of GCP can rival storage costs themselves
Networking: Data egress, load balancers, NAT gateways, and Cloud Interconnect add recurring fees that can rival compute costs in multi-region deployments
Cloud Run / Cloud Functions: Per-request and per-second billing creates variable cost patterns that require dedicated monitoring
Idle Resource Cost
Unused resources are the silent budget drain. Orphaned persistent disks, stopped VMs still retaining reserved IP addresses, underutilized GKE nodes, and over-provisioned database instances all generate cost without delivering value.
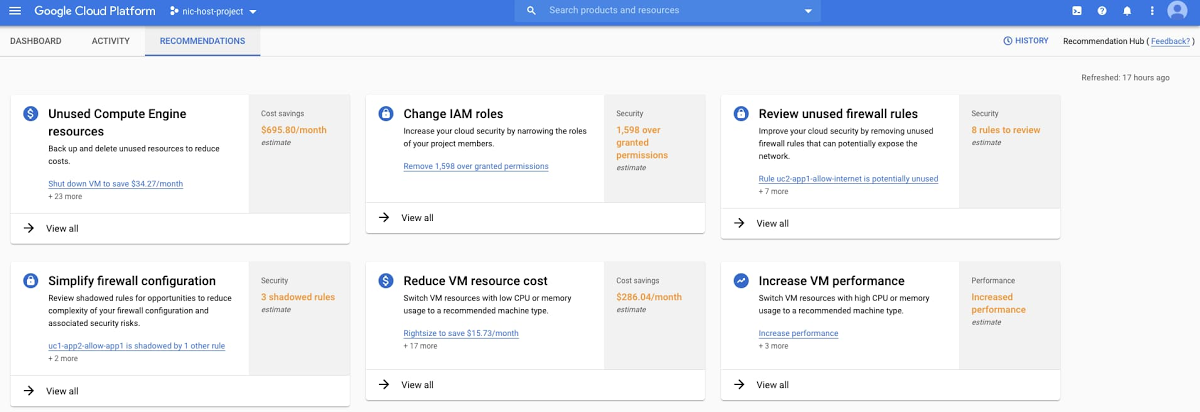
GCP’s Recommender and Active Assist provide unused resource identification, but the recommendations require manual action. Tracking resource waste as a distinct metric — and trending it over time — creates accountability for cleanup.
Common Challenges in GCP Cost Monitoring
Even teams with good intentions face structural challenges when monitoring GCP costs. Understanding these pitfalls is the first step toward overcoming them.
Label inconsistency across projects. GCP labels are the primary mechanism for cost attribution beyond the project level, but labels are not enforced by default. When different teams apply different labeling conventions — or skip labels entirely — cost reports become unreliable. One engineering operations team described how developers were “fiddling with tags for their own purposes, not realizing we’re also relying on them” for financial reporting. Without standardized labels, allocation breaks down.
Delayed billing data. GCP billing data can lag by several hours, which means real-time monitoring is technically near-real-time. For organizations running event-driven or batch workloads that spike costs rapidly, this delay creates a window where overspend accumulates before alerts fire.
Multi-project sprawl. As organizations grow on GCP, the number of projects multiplies. Each new project is a potential source of unmonitored spend. Without governance policies that require budget alerts on every project, cost visibility gaps emerge organically.
Shared resource attribution. GKE clusters, shared VPCs, and cross-project networking make it difficult to attribute costs to specific teams or products. A single GKE cluster may host workloads from five different teams, and splitting the cluster cost accurately requires namespace-level allocation tools like Kubecost or equivalent solutions.
Pricing model complexity. GCP’s combination of pay-as-you-go, sustained use discounts, CUDs, preemptible/spot VMs, and per-service pricing models creates a matrix of rates that is difficult to reason about manually. The native billing console provides visibility into cost trends, but as organizations scale, these gaps often push FinOps practitioners toward third-party tools.
Serverless cost opacity. Cloud Functions, Cloud Run, and Dataflow bill per invocation or per unit of processing time, making costs directly proportional to traffic patterns. Without monitoring, a viral event or misconfigured retry loop can generate thousands of dollars in serverless costs within hours.
Best Practices for Effective GCP Cost Monitoring
Monitor Costs Daily (Not Monthly)
Monthly cost reviews are autopsy reports — they tell you what went wrong after the damage is done. Daily monitoring catches anomalies early enough to take corrective action.
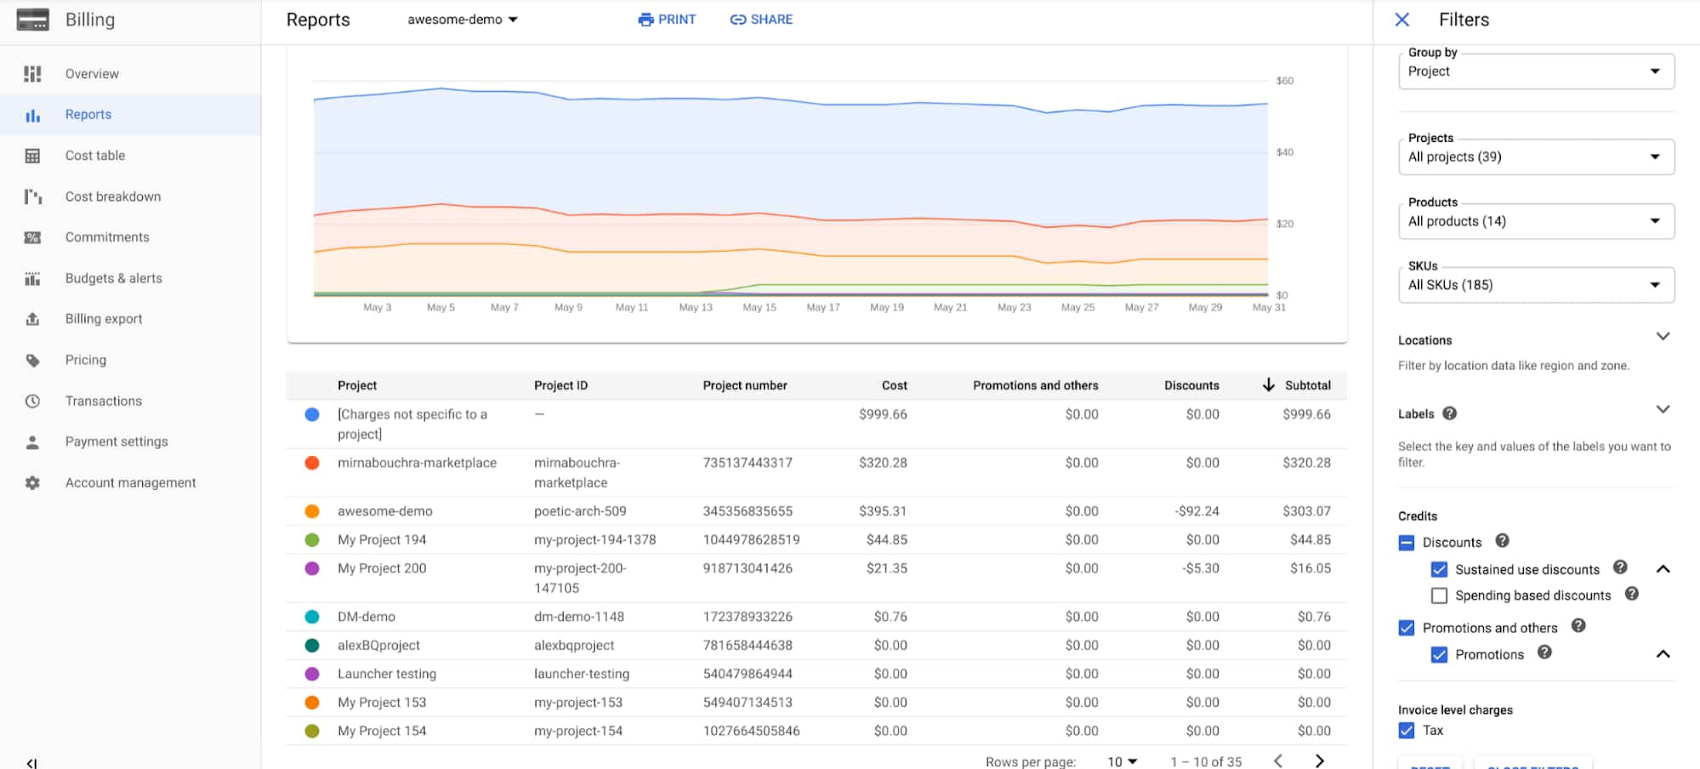
Set up daily cost trend dashboards using GCP’s Cloud Billing Reports or by querying billing exports in BigQuery. Configure anomaly detection alerts that flag deviations from baseline spend patterns. Google Cloud’s AI-powered Cost Anomaly Detection automates this for native billing data.
The goal: no cost surprise should survive more than 24 hours without someone knowing about it.
Standardize Labels Across Projects
Establish a mandatory labeling policy before projects proliferate. At minimum, every resource should carry labels for:
- Team or cost center — who owns the spend
- Environment — dev, staging, production
- Application or service — what the resource supports
- Project or initiative — why the resource exists
Enforce label compliance through organization policies and audit regularly. Unlabeled resources should be flagged and escalated weekly.
Set Proactive Budget Alerts
Create budgets at multiple levels of the resource hierarchy:
- Billing account level: Catch total organizational overspend
- Project level: Flag individual project overruns
- Service level: Alert when specific services (especially BigQuery and Compute Engine) exceed expected spend
Set multiple alert thresholds — 50%, 80%, and 100% of budget — to give teams graduated warning before hitting limits. Connect alerts to Pub/Sub topics for automated responses like scaling down non-critical resources or notifying on-call engineers via Slack or PagerDuty.
Track Cost Anomalies
Align Engineering + Finance
GCP cost monitoring works only when both engineering and finance teams have shared visibility and shared accountability. This means:
- Engineers should see cost data in their workflows — integrated into CI/CD pipelines, Slack channels, or dashboards alongside performance metrics
- Finance should understand enough about GCP architecture to ask informed questions about cost changes
- Shared reviews should happen weekly (not quarterly) to discuss cost trends, upcoming infrastructure changes, and opportunities to optimize costs.
The FinOps Foundation calls this the “Inform, Optimize, Operate” cycle. Cost monitoring is the foundation of the Inform phase — without accurate, timely cost data shared across teams, optimization efforts are guesswork.
GCP Cost Monitoring vs. Cost Optimization
| Aspect | Cost Monitoring | Cost Optimization |
|---|---|---|
| Focus | Visibility and awareness | Action and cost savings |
| Question answered | “What are we spending, and where?” | “How do we spend less without impacting performance?” |
| Activities | Tracking spend, setting budgets, alerting on anomalies, attributing costs | Right-sizing instances, purchasing CUDs, eliminating unused resources, scheduling workloads |
| Frequency | Continuous; daily or real-time | Periodic; triggered by monitoring insights |
| Ownership | Shared across FinOps, engineering, and finance | Primarily engineering with FinOps guidance |
| Risk | Low — monitoring doesn’t change infrastructure | Moderate — optimization changes can impact performance |
Cost monitoring is the prerequisite for cost optimization. You cannot right-size a VM if you don’t know its utilization pattern. You cannot commit to a CUD if you don’t understand your usage baseline. You cannot eliminate overprovisioned resources if you can’t identify them.
The most effective GCP cost strategies treat monitoring as the continuous foundation and optimization as the periodic action layer. One r/FinOps practitioner summarized it: “set up billing alerts directly (free), tag everything by team or project so you can actually see what’s costing what, and do a monthly review.”
Tools for Advanced GCP Cost Monitoring
Native GCP Tools
| Tool | What It Does | Best For |
|---|---|---|
| Cloud Billing Reports | Visual dashboards of cost trends and forecasts | Quick cost visibility for small teams |
| Budget Alerts | Configurable spend thresholds with email/Pub/Sub notifications | Preventing budget overruns |
| Billing Export to BigQuery | Raw billing data export for custom analysis | Teams with data engineering capacity for custom dashboards |
| Recommender / Active Assist | AI-driven recommendations for right-sizing, CUD purchases & other cost efficiency measures | Surfacing low-hanging optimization opportunities |
| Cost Attribution / Labels | Hierarchical allocation via projects, folders, and labels | Organizational cost governance |
nOps: The Best GCP Cost Optimization Tool
nOps is a AI-powered platform that offers autonomous rate optimization for GCP, AWS, and Azure. It stands out for its savings-first pricing model and automated commitment management.
Key features:
1. Autonomous rate optimization: Automatically manages Google CUDs and SUDs with 100% utilization guarantee, eliminating manual commitment purchasing decisions
2. Multi-cloud visibility: Unified dashboards for GCP, AWS, and Azure with business context grouping by product, team, feature, or customer
3. Cost allocation without extensive tagging: Maps cloud spend to business units using code-level analysis rather than requiring comprehensive resource tagging
Google Cloud optimization capabilities:
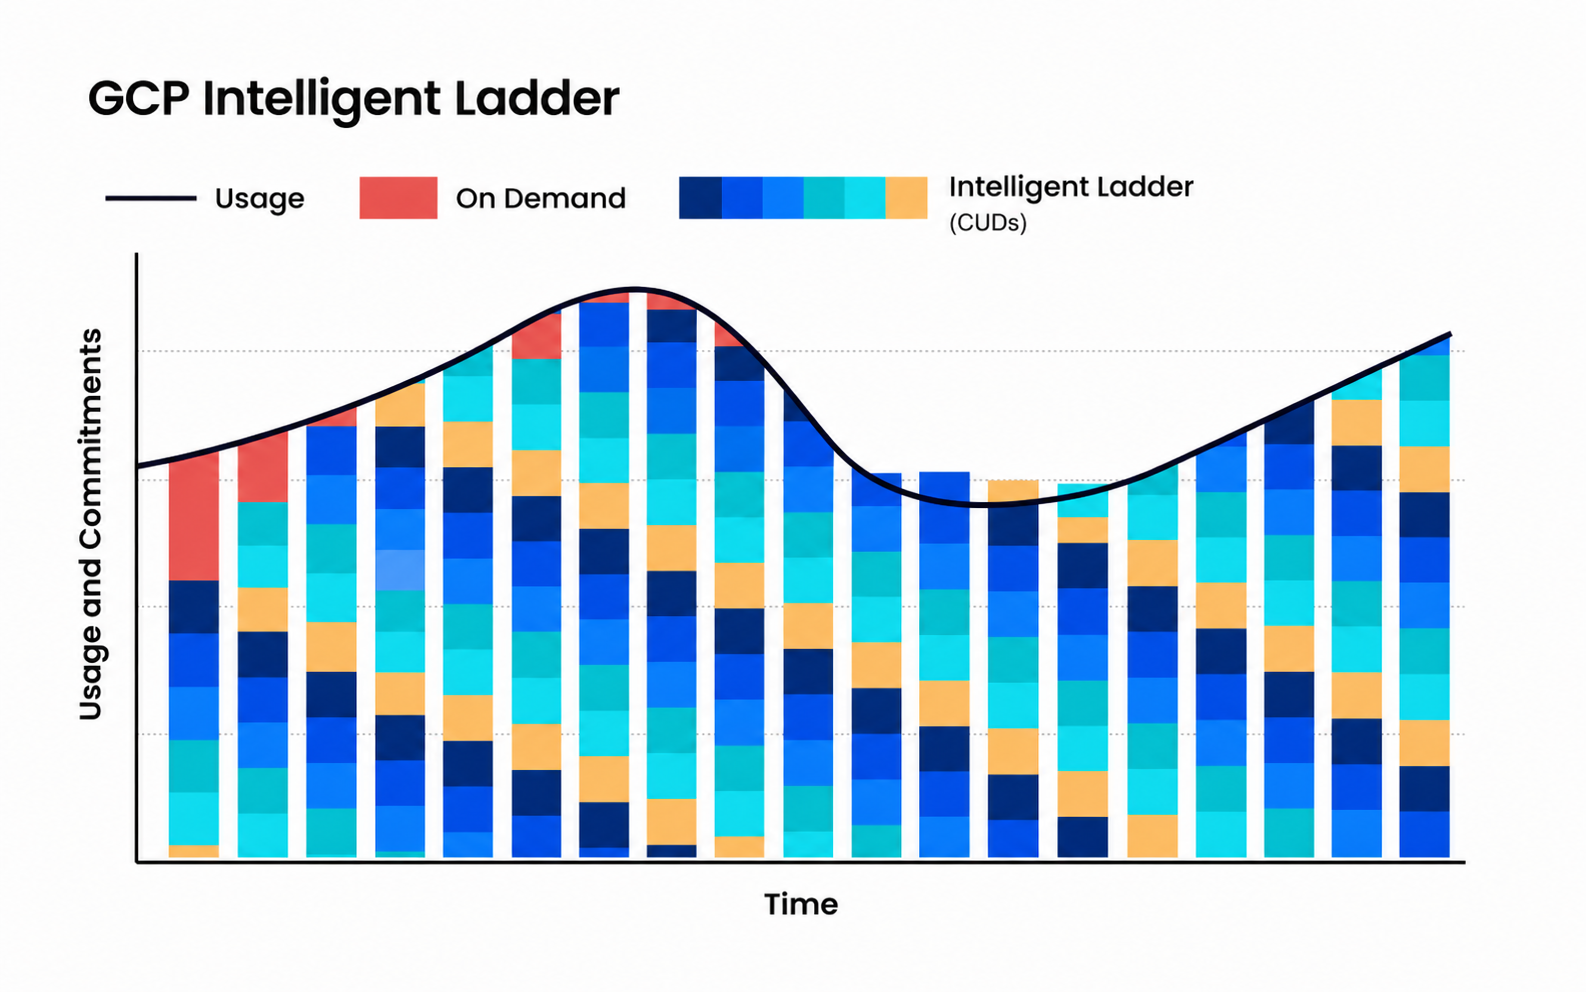
Here at nOps, we provide Google rate optimization through intelligent commitment management. We continuously analyze usage patterns and incrementally adjust commitments to track demand—avoiding the risk of over-committing on annual purchases. For organizations with unpredictable workloads, this approach delivers significant savings without long-term financial risk.
Best use cases:
- Organizations with multi-cloud environments seeking unified Google cost visibility
- Teams that want automated commitment management without operational overhead
- Companies seeking a risk-free pricing model (nOps only charges after delivering measurable savings)
Pricing: Flat fee for cost visibility. Savings-first pricing for commitment management (share of savings delivered). No upfront cost or long-term commitment required.
The Bottom Line:
- You get automated commitment management that adapts to your actual usage patterns
- You eliminate the manual overhead of tracking, rebalancing, and forecasting commitments
- You pay nothing upfront — our savings-first model means we only earn when you save
Book a demo to get a free savings analysis of your GCP/Azure/AWS spend.
CloudZero: Visibility Tool for Managing GCP Costs
CloudZero focuses on cost intelligence by mapping cloud spend to engineering dimensions like features, products, teams, and customers. It is one of the few platforms that practitioners consistently praise for making costs visible to engineers, not just finance teams.
Key capabilities:
- Unit cost economics — track cost per customer, per feature, or per deployment
- Multi-cloud support including GCP, though AWS remains the deepest integration
- Anomaly detection and alerting tied to engineering events (deploys, feature flags)
- Features to allocate costs by team, product, application
Limitations: Requires more initial setup than some alternatives, and the unit economics approach demands investment in defining cost allocation dimensions. As one practitioner noted, “CloudZero’s unit economics approach is interesting but requires more setup than we wished.”
Ideal for: Engineering-led organizations that want primarily visibility rather than optimization,
Cloudability (Apptio): Enterprise Cost Management Tool
Apptio Cloudability is an enterprise-grade FinOps platform acquired by IBM, designed for large organizations managing significant multi-cloud costs across AWS, Azure and GCP services
Key capabilities:
- Comprehensive showback and chargeback reporting
- CUD and commitment optimization recommendations and limited automation
- Rightsizing and idle resource identification
- Enterprise-scale reporting for organizations with hundreds of millions in cloud spend
Cloudability is frequently cited alongside Flexera as one of only two enterprise-ready solutions “able to deal with hundred million spend data.”
Limitations: Can feel like overkill for mid-market organizations. The platform is feature-rich but complex to configure, and contract terms tend toward multi-year enterprise pricing agreements.
Ideal for: Large enterprises with significant GCP and multi-cloud spend that need comprehensive FinOps governance, chargeback, and executive reporting.
Comparison at a Glance
| Capability | Native GCP Tools | nOps | CloudZero | Cloudability |
|---|---|---|---|---|
| GCP cost visibility | ✅ Deep native | ✅ Unified dashboard | ✅ Cost intelligence | ✅ Enterprise reporting |
| Automated optimization | ❌ Manual recommendations | ✅ Automated commitments | ❌ Insight-focused | ⚠️ Limited |
| Kubernetes (GKE) cost allocation | ⚠️ Basic with GKE Allocation | ✅ Namespace-level | ✅ Feature-level mapping | ✅ Namespace-level |
| Multi-cloud support | ❌ GCP only | ✅ AWS + GCP | ✅ AWS, GCP, Azure | ✅ AWS, GCP, Azure |
| Anomaly detection | ✅ AI-powered | ✅ Automated alerts | ✅ Engineering-context alerts | ✅ Threshold + ML-based |
| Pricing model | Free (native) | % of savings (ROI-based) | SaaS subscription | Enterprise contract |
| Ideal for | Small teams, GCP-only | AWS-primary + GCP growth | Engineering cost culture | Enterprise governance |
Google Cost Optimization is better with nOps
Across the tools in this guide, commitment optimization remains one of the largest savings levers in Google Cloud. nOps focuses on maximizing that lever automatically — increasing your effective savings rate without adding operational overhead. And, we only get paid after delivering you measurable savings.
In 2026, “good enough” means you’re likely leaving money on the table. We’ve talked to companies that can save millions on their cloud bills by switching to nOps from competitors.
There’s no risk to book a free savings analysis to find out if nOps can help you get more value out of your cloud investments.
nOps manages $4B+ in cloud spend and was recently rated #1 in G2’s Cloud Cost Management category.
Frequently Asked Questions
Let’s dive into a few questions about the best GCP cost optimization tools and application resource management platforms for GCP.
Why is GCP cost monitoring important?
What metrics should you track in GCP cost monitoring?
How often should you monitor GCP costs?
Are GCP native tools enough for cost monitoring?
Last Updated: June 7, 2026, Cloud Management
Tags
Last Updated: June 7, 2026, Cloud Management
