Cloud Rate Optimization: How to Pay Less for Every Unit of Cloud Compute
Rate optimization is arguably the biggest lever to reduce your cloud bill. You’re already running the workloads. You’re already buying the compute. The question is whether you’re paying higher prices than you need to — and the answer, for a surprising number of organizations, is yes.
According to the FinOps Foundation, rate optimization is the capability used to manage the rates you pay for the resources you use in each technology category. Cloud cost equals the amount of a resource you use multiplied by the rate you pay for it. Rate optimization targets that second variable — the per-unit price — through commitment discounts, negotiated agreements, and alternative pricing mechanisms.
This guide covers how cloud rate optimization works, how it differs from usage optimization, common pitfalls, and how to build a strategy that adapts as your workloads change.
Rate Optimization vs. Usage Optimization: What's the Difference?
Before diving into rate optimization tactics, it’s worth clarifying what rate optimization is NOT. Usage optimization — rightsizing instances, eliminating idle resources, scheduling dev environments — reduces the quantity of resources you consume. Rate optimization reduces the price per unit you pay for whatever resources remain after usage optimization.
Both matter for optimizing cloud costs. But they operate on different timelines and require different skills. Here’s how they compare:
| Dimension | Rate Optimization | Usage Optimization |
|---|---|---|
| What it targets | Per-unit price ($/hour, $/GB) | Resource quantity consumed |
| Primary mechanisms | Savings Plans, RIs, CUDs, Spot, EDPs | Rightsizing, scheduling, idle cleanup |
| Who owns it | FinOps team, Procurement | Engineering, DevOps |
| Time horizon | 1–3 year commitments | Immediate to weeks |
| Risk profile | Over-commitment if usage drops | Performance impact if undersized |
| Savings potential | 30–72% off on-demand rates | 20–40% by eliminating waste |
| Reversibility | Low (locked in for term) | High (can revert changes) |
This work has a clear order of operations: optimize usage first, then optimize rate. If you commit before rightsizing workloads or eliminating waste, you risk locking in a spend commitment based on usage that should have been reduced first. The better approach is to remove unnecessary consumption, establish a stable baseline, and then apply commitments to the demand that remains.
Rate Optimization Mechanisms: Your Full Toolkit
Rate optimization isn’t a single action — it’s a portfolio of pricing mechanisms, each with different risk-reward profiles. Here’s what’s available across the major cloud providers:
Commitment-Based Discounts
Reserved Instances (RIs) lock in capacity for a specific instance type, region, and platform for 1 or 3 years. AWS RIs can save up to 72% compared to On-Demand pricing. The tradeoff: they’re inflexible. If your workload changes instance families or moves regions, those RIs become stranded.
Savings Plans (AWS) and Committed Use Discounts (GCP) offer more flexibility. Instead of committing to a specific instance type, you commit to a dollar-per-hour spend level. AWS Compute Savings Plans apply across instance families, regions, and even between EC2 and Fargate. Discounts range from 20% to 66% depending on term and payment option.
Enterprise Discount Programs such as a Private Pricing Addendum (AWS) and Microsoft Azure Consumption Commitment (Azure) provide flat-rate discounts on total cloud spend in exchange for minimum spend commitments — typically for organizations with $1M+ annual cloud spend.
Non-Commitment-Based Pricing Discounts
Spot Instances offer up to 90% savings on spare compute capacity, with the caveat that instances can be reclaimed with a 2-minute warning. Suitable for fault-tolerant, stateless workloads — batch processing, CI/CD, data pipelines.
Sustained Use Discounts (GCP) automatically apply when you run resources for more than 25% of a month. No commitment required — GCP applies them retroactively.
Marketplace and Program Discounts
AWS Marketplace purchases can count toward EDP commit thresholds. Programs like the AWS Migration Acceleration Program (MAP) provide credits that effectively reduce rates during migration phases.
When Each Mechanism Makes Sense
Here’s a decision framework based on workload characteristics:
| Workload Type | Stability | Best Mechanism | Expected Discount |
|---|---|---|---|
| Steady-state production | High | 3-year RIs or Savings Plans | 50–72% |
| Growing but predictable | Medium-High | 1-year SPs, layered monthly | 30–50% |
| Variable with a baseline | Medium | SPs covering baseline + Spot for peaks | 30–60% blended |
| Short-lived projects | Low | Spot + On-Demand | 0–90% (Spot portion) |
| AI/ML training batches | Low-Medium | Spot with checkpointing | 60–90% |
| Multi-region, multi-family | Variable | Compute SPs (broadest flexibility) | 20–40% |
Rate Optimization Pitfalls
The theory of rate optimization is straightforward: buy commitments, pay less. The execution is where teams struggle. Based on conversations with engineering leaders managing cloud spend, and discussions across FinOps practitioner communities, here are the failure patterns that recur most often.
Shifting Business Priorities
Cloud commitments are made at a specific point in time, but workloads do not arrive all at once. They accumulate unevenly as projects launch, expand, contract, or shut down on different timelines. That makes it difficult to estimate demand as a single stable block. This is the fundamental tension in rate optimization. Commitments are forward-looking bets on future usage, but workloads arrive unpredictably. A commitment that was optimal at purchase becomes suboptimal as new workloads shift the infrastructure mix.
Evolving Infrastructure
Even when overall demand remains stable, the cloud infrastructure underneath it rarely does. Teams migrate instance families, adopt new services, replatform workloads, move between compute models, or change regional footprints. And as cloud providers accelerate the release of newer GPUs, specialized compute and AI services, changes can reduce the fit between existing commitments and the resources actually being consumed.
Conflicting Recommendations
Another common frustration from FinOps communities: “One tool pushes hard for a 3-year commitment, another says 1-year is best.” When tools analyze the same workload and produce different recommendations, teams freeze. The conflict usually stems from different assumptions about workload stability, different lookback windows for usage analysis, or different risk models.
Manual Management at Scale
Commitment portfolios require ongoing attention. Cloud usage shifts hourly across services, accounts, instance families, regions, and architectures. A team managing 50+ accounts across multiple regions can’t realistically track expiration dates, utilization rates, and rebalancing opportunities manually. The cognitive overhead grows linearly with infrastructure complexity — and most organizations’ cloud footprints are growing, not shrinking.
The Coverage-Utilization Tradeoff
Every commitment purchase faces a tension: high coverage (more of your spend is discounted) versus high utilization (your commitments are fully used). Push coverage too high and you’re paying for commitments that go unused. Push utilization too high and you’re leaving on-demand spend uncovered. Finding the balance requires continuous adjustment, not quarterly reviews.
Building a Rate Optimization Strategy That Adapts
Given these common pitfalls, here’s a practical framework for cloud cost optimization that accounts for real-world complexity.
Step 1: Establish Your Commitment Baseline
Calculate what percentage of your compute spend is currently covered by commitment discounts. This is your coverage rate. Then calculate what percentage of your existing commitments are actually being utilized — your utilization rate.
Target benchmarks:
- Coverage rate: 70–80% of eligible on-demand spend
- Utilization rate: 95%+ on all active commitments
- Combined metric (Effective Savings Rate): the percentage saved versus what you would have paid at full on-demand
If your coverage is below 60%, you’re almost certainly leaving significant savings uncovered. If your utilization is below 90%, you’ve over-committed somewhere and need to rebalance.
Step 2: Layer Your Commitments
Don’t buy all your commitments at once. Instead, purchase in small increments — weekly or even daily — that track actual demand. This approach:
- Reduces the risk of a single large over-commitment
- Spreads expiration dates across the calendar (no “commitment cliff”)
- Allows the portfolio to adapt as workloads change
- Captures savings on stable baseline while avoiding commitment on volatile portions
A layering strategy that purchases 1/52nd of your annual commitment recommendation each week achieves nearly the same discount depth as a single annual purchase, with dramatically lower risk.
Step 3: Match Mechanism to Workload
Not everything should be covered by the same commitment type. Map your workloads to the decision framework above. Stable, long-running production services warrant deeper commitments (3-year, all-upfront for maximum discount). Variable workloads benefit from shorter-term, no-upfront Savings Plans. Burst workloads should stay on Spot or On-Demand.
Step 4: Automate Portfolio Management
This is where manual processes break down. Usage shifts hourly across services, accounts, regions, instance families, and architectures. New workloads start, others wind down, and commitment coverage drifts as the environment changes.
The rebalancing math — factoring in expiration schedules, new workload onboarding, instance family migrations, and regional shifts — requires continuous recalculation. Automated commitment management tools handle this by monitoring utilization in real time and adjusting purchases hour by hour to maintain target coverage and utilization rates without human intervention.
Step 5: Measure with the Right Metrics
Track your Effective Savings Rate (ESR) — the actual discount achieved across your entire eligible compute portfolio, accounting for both covered and uncovered spend, and for commitment utilization. This single number tells you whether your rate optimization strategy is working better than the alternative approaches: raw coverage percentage alone can be misleading if utilization is low, and utilization alone ignores uncovered spend.
Teams also need to monitor commitment lock-in risk: how much future spend is already committed, how concentrated those commitments are by term and purchase date, and how exposed the portfolio is if demand shifts. A rate optimization strategy is only healthy if it improves realized savings without locking too much spend into commitments that may no longer fit the business later.
The Bottom Line: Rate Optimization Is Your Most Powerful Savings Lever
Rate optimization is the fastest path to reducing your cloud bill without touching application code or infrastructure architecture. The mechanisms are well-understood — SPs, RIs, CUDs, EDPs, Spot. The challenge is execution: timing, sizing, rebalancing, and adapting as workloads evolve.
You can do this manually with spreadsheets and quarterly reviews. Or you can let automation handle the continuous math while your team focuses on the engineering decisions that actually need human judgment.
Automate Rate Optimization with nOps
Maximizing savings and minimizing risk requires continuously adjusting coverage, duration, timing and commitment mix as your usage changes.
But in practice, it is very difficult to manage this manually at scale. Usage shifts daily, commitments span years, and small mistakes compound into long-term lock-in.
nOps automated Commitment Management employs all of the strategies included in this list to minimize your Commitment Lock-In Risk while maximizing your Effective Savings Rate.
Maximize discounts with ML-powered automation: Push discounts to 55%+ with adaptive commitment layering that adapts to your usage every hour
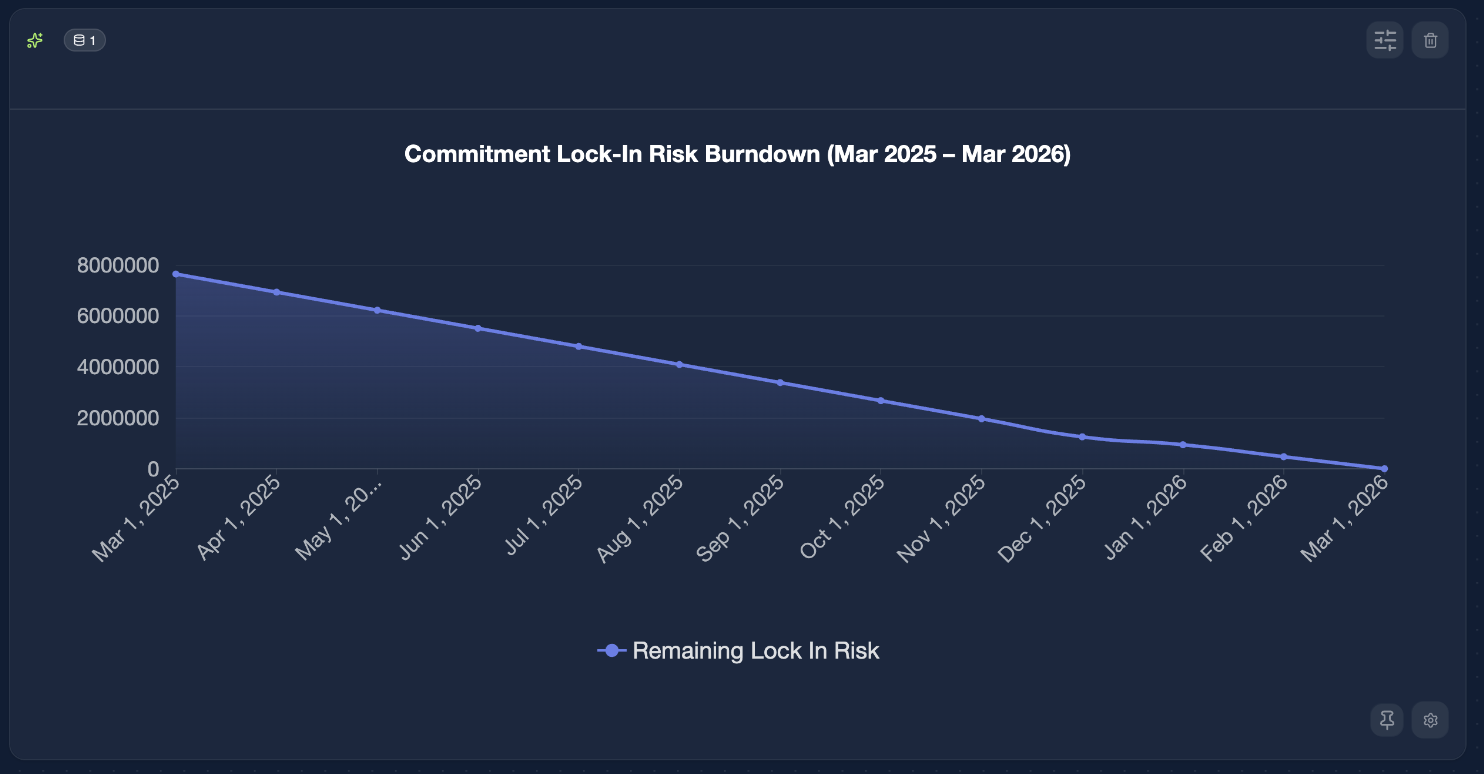
Maximize flexibility: Instead of one big batch of 3-year Compute Savings Plans, nOps builds a mix, committing in small increments each hour and adjusting as needed. The result: teams slash their risk and commitment windows. Track and watch your Commitment Lock-In Risk go down in the nOps platform:
Savings-first model: nOps only gets paid if we save you money — meaning there’s no upfront cost or financial risk. Customers have described it as being like “picking $20 bills off the ground” — there’s no downside to seeing if you can reduce costs with a free savings analysis.
nOps is entrusted with $4 billion in cloud spending and was recently rated #1 in G2’s Cloud Cost Management category.