 Skip to content


- Blog
- Cost Optimization
- GenAI Cost Optimization: The Essential Guide
GenAI Cost Optimization: The Essential Guide
From customer-facing chatbots to automated code generation, organizations are integrating large language models and multimodal models into every stage of the product development cycle. But with great predictive power comes steep compute bills: costly GPU-powered inference and training, plus variable, hard-to-predict token-based pricing.
This guide delivers a hands-on framework for GenAI cost visibility, optimization and control. Learn to instrument your pipelines for granular visibility, navigate AI-specific pricing constructs (tokens, PTUs, per-second GPU), right-size compute to workload demand, tune models to meet SLAs, and tie spend back to business outcomes. Effective GenAI FinOps strikes a three-way balance between savings, model accuracy, and user experience, and we’ll share engineering-friendly tools, platforms, and actionable tips to help achieve that.
Part 1: Getting visibility
To cost optimize, you first need to understand what you’re spending, where it’s happening, and when costs are being incurred across your AI workflows. That includes in-house models, hosted platforms like Bedrock, and direct integrations with third-party AI tools. This section breaks down what to measure, how to capture it, and which dashboards and integrations make it easy to act.
Key Cost Metrics
For effective GenAI cost management, you’ll need visibility on:
Token Consumption by Endpoint:
Understanding cost drivers at the most granular level means capturing the number of input and output tokens each API call consumes and tagging those calls by feature or use case.
Provisioned Throughput Utilization (PTUs):
When you pre-purchase PTUs, you unlock volume discounts, but you lose per-token pricing clarity. Emitting a utilization ratio (PTU used divided by PTU allocated) on an hourly cadence lets you compute an effective token rate, total PTU spend over total tokens, and quickly identify whether you’re under- or over-leveraging your reservation.
GPU/TPU Instance Metrics:
GPUs and TPUs account for the bulk of GenAI costs, so track both how long each instance runs and how fully it’s loaded. Recording instance hours alongside true saturation (average power draw) and tagging every VM or pod with model version and environment (production, staging) reveals idle capacity and pinpoints overprovisioned clusters you can rightsize.
Model Invocation Latency & Error Rates:
Performance hiccups often foreshadow cost overruns: slow or failing endpoints can trigger retries or reroute traffic to more expensive fallback models. By tracking P50, P95, and P99 latencies and correlating error spikes with specific model versions, you catch inefficiencies.
Cost by Deployment Tier:
Trying different models in lower environments and locking each tier to a fixed model is more cost-effective than running full-scale production models everywhere. Use smaller, cheaper models in dev and staging to test changes, while reserving premium models for production. You can also segment spend by environment and set budget alerts.
Instrumenting Your AI Workflows
To turn the metrics you need into data you can act on, weave cost telemetry into every layer of your AI stack, both real-time inference paths and batch pipelines. Below are the key touchpoints and how they work together for managing costs.
Centralized Telemetry Pipeline:
All inference and training data should flow through a service mesh or API gateway that’s instrumented to emit standardized spans. By using OpenTelemetry (or lightweight custom wrappers), you capture token counts, model identifiers, and compute-node tags in a single trace. This unified approach avoids piecemeal logging and guarantees that every call,including retries and fallbacks,lands in your metrics backend.
SDK & IaC Integrations:
Embed cost tags at the code and infrastructure levels so nothing slips through the cracks. In your application layer (Python, Node.js), wrap model-client calls with hooks that automatically attach feature and use-case metadata. In parallel, augment your Terraform or CloudFormation templates with cost-tracking modules so every new endpoint spins up with finops.team and finops.use-case labels by default. Together, these integrations ensure consistency across deployments.
Batch Job Metrics:
Long-running tasks like fine-tuning or data preparation often hide significant GPU consumption. Instrument Spark or Kubeflow jobs to emit GPU-hour counts, data read/write volumes, and job durations. Aggregating these metrics by job type surfaces inefficient ETL pipelines or retraining workflows before they consume large compute blocks and inflate your monthly bill.
Automated Tag Enforcement:
Prevent untagged deployments from ever reaching production by enforcing policies at the cluster level. Deploy Kubernetes admission controllers that reject pods missing required labels (e.g., finops.team, finops.usecase). This “fail-fast” mechanism preserves data integrity and ensures that every workload contributes to your cost-visibility pipeline without manual gatekeeping.

Part 2: Cost Optimization for Generative AI
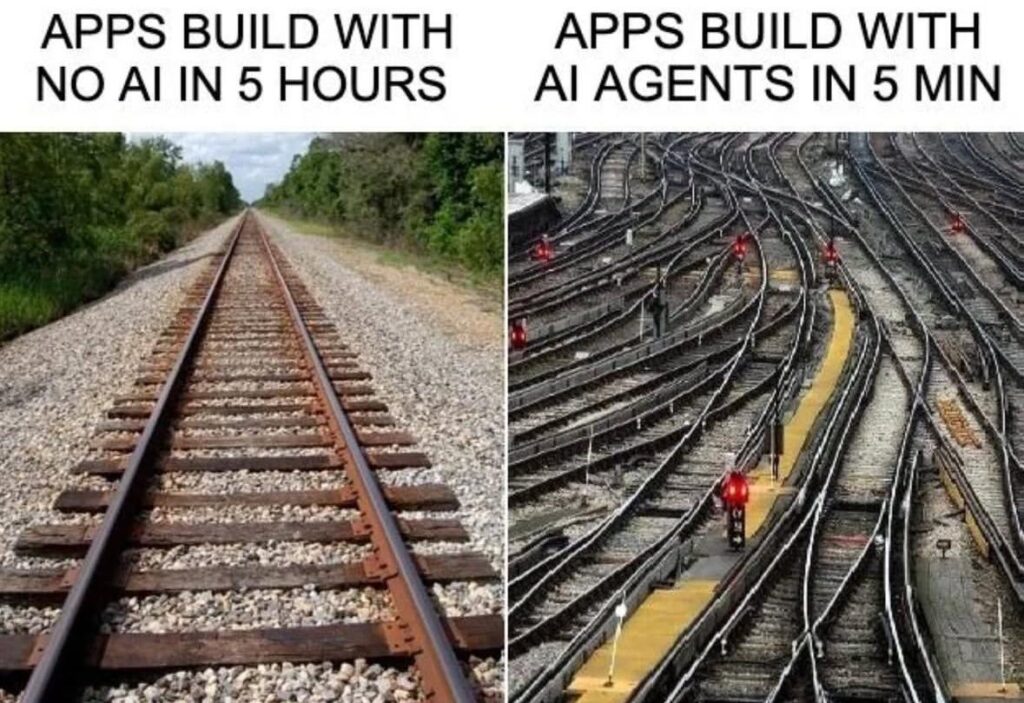
GenAI workloads are notoriously volatile: a feature launch or prompt tweak can spike token traffic by an order of magnitude, while GPUs sit half-idle because single-tenant deployments and conservative batch sizes waste expensive capacity. Pair that with model training jobs that hog clusters after hours, and you end up paying premium rates for hardware that delivers only a fraction of its potential throughput.
Cost headaches multiply when you layer in today’s fragmented pricing. Tokens, provisioned-throughput blocks, per-second GPU rentals, vector-DB I/O, even surprise egress fees all land on separate lines of the invoice, and the “cheapest” model on paper may require twice the tokens to reach the same answer quality. Let’s talk about some practical strategies to achieve significant cost savings while maintaining quality.
Model Selection & Tuning
Model choice, not hardware, is the single biggest lever on GenAI spend, Pick (or adapt) the smallest model that still meets your accuracy and latency targets, and your cost curve will follow.
1. Start with business fit.
The cheapest model is the smallest one that still meets accuracy and latency targets for the use case. Before you benchmark anything, write down the measurable outcome: BLEU for translation, exact-match for code, CSAT for chat. Then evaluate three tiers: 1-7 B parameters for simple classification or paraphrasing, 7-40 B for broad chat and code hints, 70 B+ only when nuanced reasoning or multimodal fusion is provably required.
2. Pre-trained vs. custom: follow the 90/10 rule.
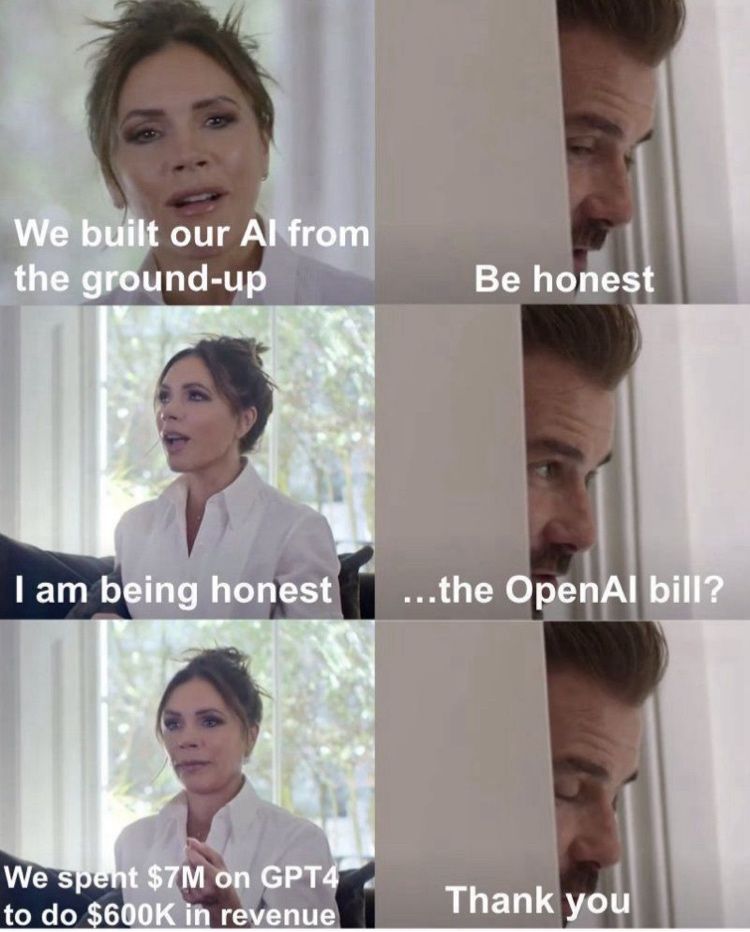
Off-the-shelf foundation AI models on Bedrock, Gemini, or Azure OpenAI cover about 90 % of generic language tasks with zero training spend. Building or full-fine-tuning a custom model only makes sense when (a) domain-specific jargon breaks the public model, (b) data privacy laws bar external vendors, or (c) lifetime inference volume is large enough that amortizing training over many tokens beats pay-as-you-go pricing. A rough break-even we see in the field: if monthly inference exceeds ~4 × training-day token volume, custom training can pencil out; otherwise, stick with API calls.
3. Training is a capex spike; inference is the annuity.
Even a modest 7 B checkpoint can burn through 250 GPU-hours to converge, but that cost hits once. Inference costs compound every day. FinOps teams, therefore, treat training spend like buying an asset, depreciate it over the model’s useful life, and focus optimization cycles on the recurring inference bill.
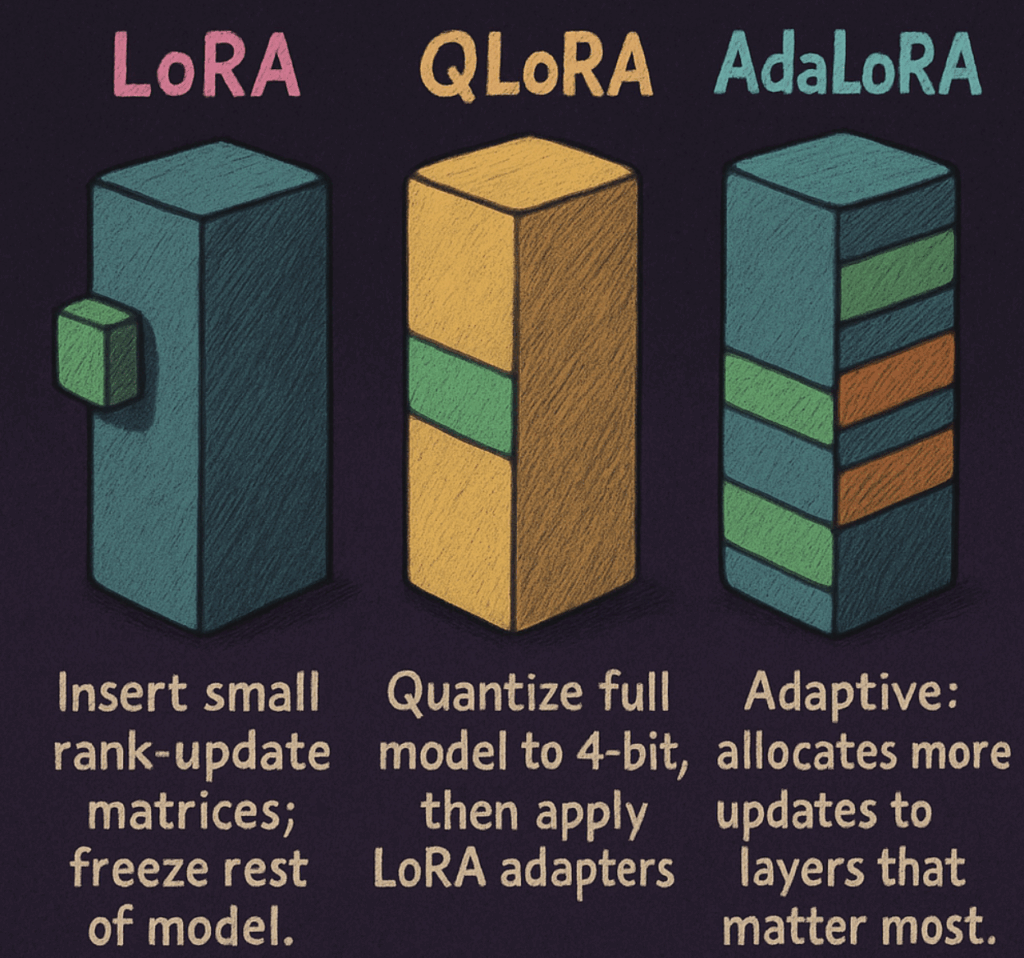
4. Parameter-efficient fine-tuning (PEFT) is the default middle path.
Techniques like LoRA, QLoRA, and AdaLoRA tweak < 1 % of the weights, slashing GPU hours by 90-95 % while retaining most performance lift. Store adapters separately, load them on demand, and you avoid re-deploying multi-gigabyte binaries. Typical dollar math: a full fine-tune of a 13 B model on A100 × 8 for four hours runs about $800; a LoRA pass costs $60 and often lands within two points of the same F1.
5. Prompt engineering is still the cheapest optimization knob.
Rewrite instructions, use system messages, or add retrieval-augmented context before you reach for a bigger or customised model. Teams that institutionalise a “prompt library” and A/B harness routinely cut token spend 20-30 % because better prompts mean shorter completions and fewer retries.
6. Mix-and-match routing.
Production stacks increasingly run a semantic router in front of a tiered model pool: send trivial queries to a distilled 6 B, medium model complexity to a 13 B LoRA, and fall back to a GPT-4-class on-demand model only when confidence drops. Early adopters report 40-70 % savings on premium-model tokens with no measurable dip in user satisfaction.
7. Governance closes the loop.
Publish cost-per-1 K-tokens and latency alongside quality metrics in the same dashboard. Engineers see immediately when a “better” model doubles unit cost for a 1-point gain, finance sees when aggressive downsizing hurts NPS, and both sides can iterate on the same facts.
Compute-Resource Cost Optimization Strategies
Computational costs are typically the largest line item in GenAI operations. This section outlines how to match hardware to workload and keep every GPU, TPU, and CPU running at useful capacity so cost per token falls without compromising latency or accuracy for significant computational resources.
Right-Sizing GPUs, TPUs, and CPUs
Pick the lightest accelerator that still meets your latency and accuracy SLOs; every step up in silicon class raises hourly cost 2-10× with no guarantee of better user experience.
- Real-time chat (<100 ms P95): small L4/A10 GPUs,or even CPU-only paths, for AI models ≤7 B params.
- Steady, high-throughput inference: reserve A100 40 GB nodes, drive ≥70 % sustained power draw.
- Large batch training/fine-tune: queue on pooled H100s after hours; combine spot + reserved to smooth price swings.
- Burst-only prototypes: Serverless GPU runtimes (AWS Sagemaker Inference, Vertex AI, Modal) where cold-start latency is acceptable.
GPU Utilization Strategies
Idle watts are the silent killer of GenAI budgets; multi-tenancy and elastic clusters turn parked capacity into throughput.
- Pooling / MIG slices: partition A100/H100 GPUs, enforce per-namespace quotas; typical utilisation jump: 25 → 60 %.
- Dynamic scaling: forecast tokens-per-second, pre-warm just-in-time, tear down sub-50 % saturated nodes.
- Load-aware batching: auto-tune batch size when queue depth rises; a 2× batch lift often cuts cost per token ~30 %.
- Job packing & bin-packing: Repack low-priority inference onto under-used training GPUs during idle windows.
CPU Offloading for Prep & Post-Processing
Tokenization, embedding look-ups, and JSON post-processing don’t need $3/hr GPUs, shifting them to modern Graviton or Ice Lake CPUs trims total GPU hours by 20-35 %.
- Run preprocessing on C7g/M7i autoscale groups.
- Cache common embeddings in Redis/Memcached near CPU nodes.
- Separate the ingress queue so GPU pods receive only fully prepped batches.
Saturation vs. Utilization Metrics
A GPU can report 90 % “utilization” while barely sipping power; saturation (e.g., average watt draw or SM occupancy) tells the real cost efficiency story.
- Export NVML power metrics or DCGM SM-busy to Prometheus.
- Alert on GPUs <50 % saturation for >15 min; trigger rightsizing or job re-packing.

Infrastructure Cost Efficiency
Moving data quickly and economically is what keeps expensive accelerators busy. Focus on the slowest, or costliest, links first, then drill down.
Network Optimisation
Even the fastest GPUs stall if interconnect bandwidth can’t keep tensors flowing. Aim for low-latency, high-throughput paths between worker nodes, storage, and vector databases.
- Upgrade the east-west spine first. Jumping from 25 GbE to 100 GbE inside the training pod often cuts epoch time by 20-30 %.
- NUMA-aware placement. Pin multi-GPU jobs to sockets sharing the same PCIe switch; saves ~5 µs per NCCL hop.
- NVLink or InfiniBand for >1 TB/day workloads. The cost delta is usually recovered in under two months of GPU time.
- QoS lanes for inference. Tag model traffic so high-priority requests never queue behind bulk ETL transfers.
- Disable reverse-path filtering on RDMA subnets. Eliminates hard-to-track packet drops that throttle throughput.
Storage Tiering & Caching
Training pipelines grind without high I/O, and inference often rereads large prompt or embedding files. Tier data storage by access pattern so hot data stays close to the compute
- Stage current epoch shards on local NVMe. Keeps GPUs fed at >5 GB/s without scaling a shared file.
- Lifecycle policies on checkpoints. Anything older than N days moves to S3 Glacier / Coldline, saving 30-60 % on storage.
- Prompt/embedding cache. A memory-only Redis layer often pays for itself by avoiding object-store egress.
Vector Databases & Sharding
RAG pipelines can triple inference cost if the vector store lags.
- Shard by tenant or LSH bucket so >90 % of queries stay local.
- Right-size replicas to RAM, not CPU. Vector search is memory-bound; doubling RAM beats adding vCPU.
- Use product quantisation. 30-50 % RAM savings with <1 % drop in recall translates to smaller node counts.

Provisioned Throughput Units (PTUs)
PTUs trade a flat monthly fee for guaranteed capacity, but unused minutes are sunk cost. Track utilisation like a reserved GPU fleet and charge back fairly.
- Expose hourly utilisation (%). Under 70 % for two consecutive weeks? Down-shift the reservation.
- Token-weighted chargeback. Split PTU cost by actual tokens, not headcount, to curb noisy-neighbour behaviour.
Inference-Level Cost Efficiency
Once you’ve chosen the model and sized the hardware, the last 20–30 percent of savings lives inside the inference loop itself. By tightening how each request is processed (down to numerical precision, queue discipline, and whether you even call the model), you can lower cost-per-token without retraining or re-provisioning anything.
Quantization & Pruning: Reduce numerical precision (FP32 → FP16/INT8) and strip weights with minimal impact. Memory footprints shrink up to 4× and arithmetic costs drop by 30–60% with almost no accuracy hit.
Batching & Concurrency Management: Adaptively batch requests until you hit either a latency budget or token ceiling. You’ll see 2–3× more tokens per second and avoid expensive over-scaling by throttling low-priority traffic during spikes.
Prompt Routing & Caching: Send routine or duplicate queries to smaller distilled models and serve identical requests from cache. This can cut premium-model usage by 40–70% and shave off tail latency, all while preserving response quality.
Retrieval-Augmented Generation (RAG): Pull only the necessary context from your vector store into a compact (7–13 B) model at runtime. You’ll drastically reduce token counts and GPU memory pressure—often achieving an order-of-magnitude lower cost than running a single massive model.
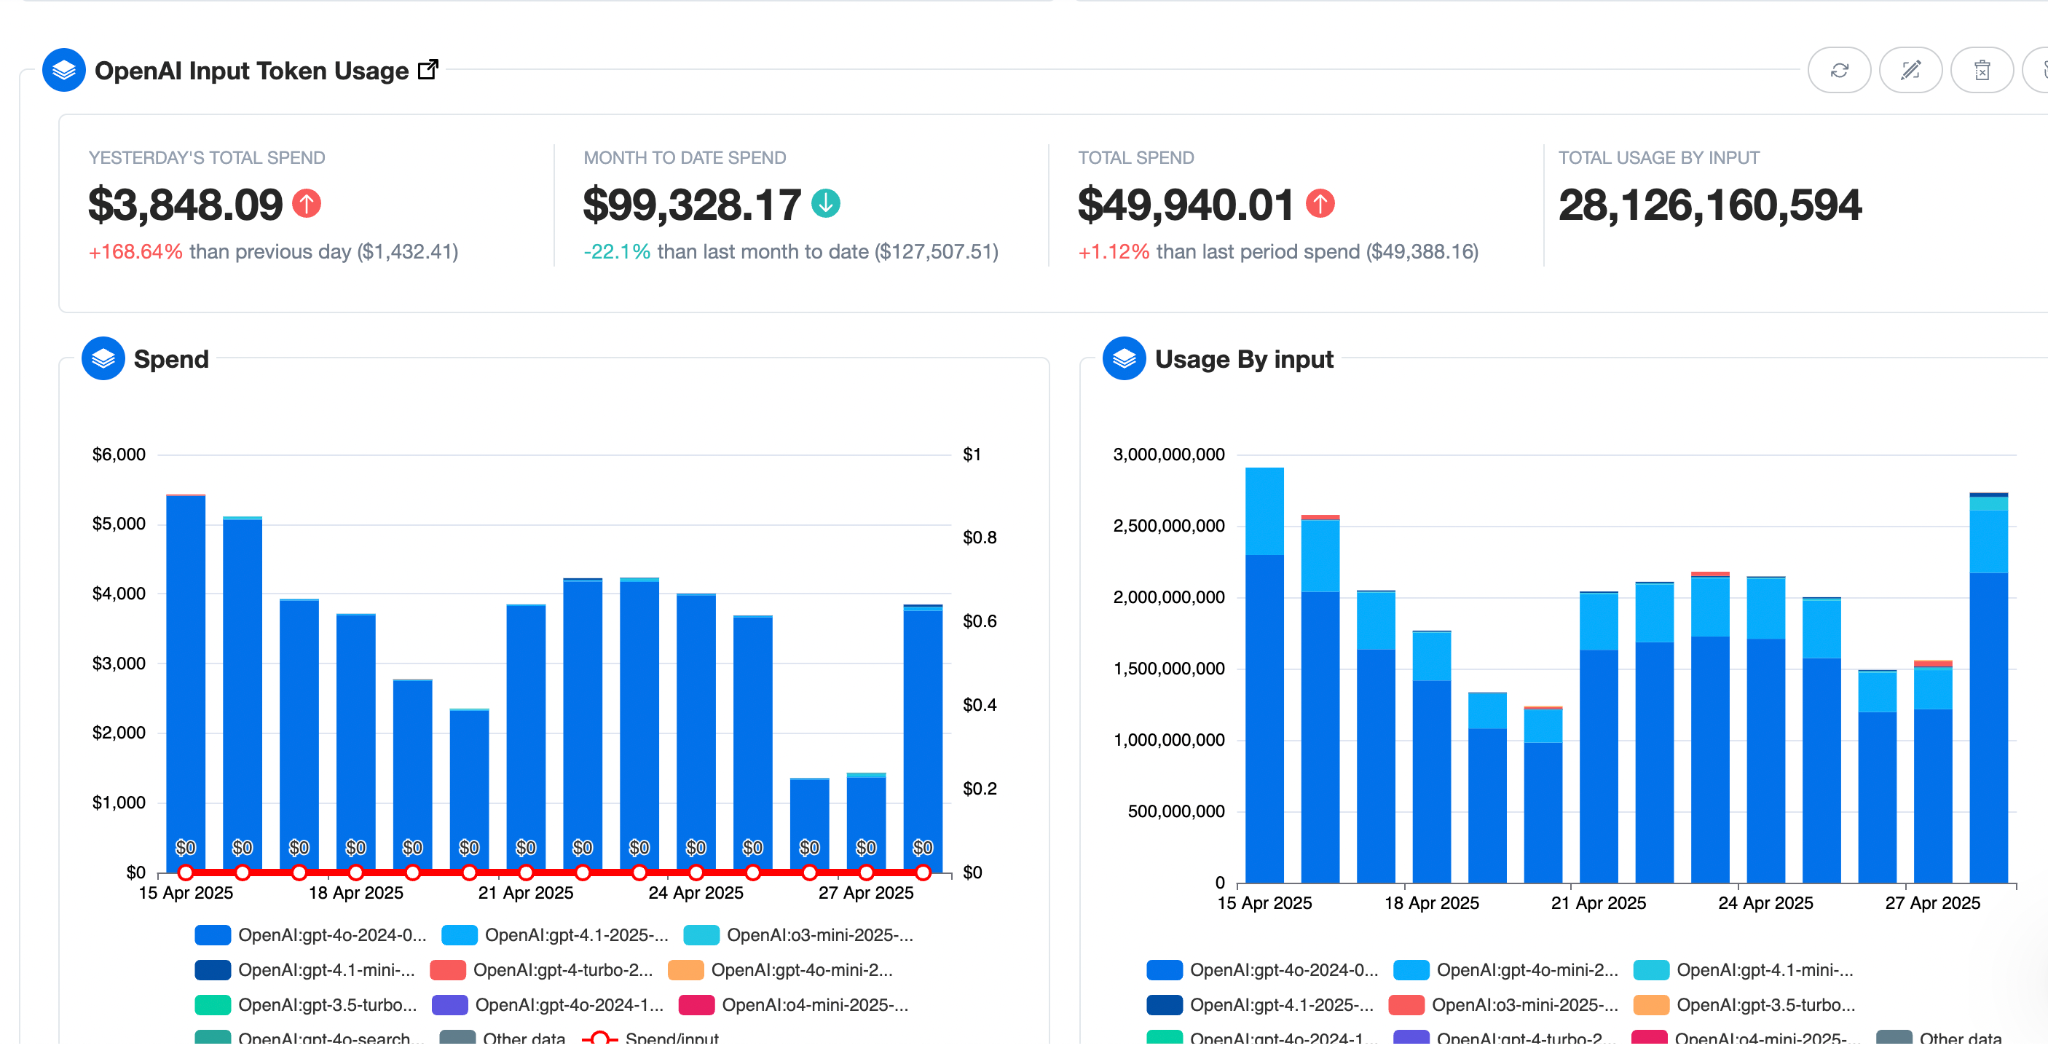
Cost Tracking and Attribution
Token-Based Billing
Most vendors already surface input_tokens and output_tokens per call. Capture both, multiply by the published $/1 K-token rate, and you have an immutable cost record that survives future price cuts, volume discounts, or PTU roll-ups. When counts aren’t returned, use a deterministic tokenizer (e.g., tiktoken) so engineering, finance, and dashboards all speak the same accounting unit: dollars per 1 000 tokens.Minimum Viable Ledger, Fields You Actually Need
| Field | Type | Description |
|---|---|---|
request_id | UUID | Unique request identifier |
ts | TIMESTAMP | Timestamp of request |
model_id | VARCHAR | Model identifier |
api_version | VARCHAR | API version used |
feature_tag | VARCHAR | Feature tag (e.g. “chat_support”) |
input_tokens | INT | Number of input tokens |
output_tokens | INT | Number of output tokens |
duration_ms | INT | Request duration (ms) |
total_cost_usd | NUMERIC | Total cost (derived at ingest) |
- Keep the fact table append-only; price changes are handled by a prices dimension table joined at query time.
- <10 k req/s? Postgres or Aurora is fine.
- >10 k req/s? Stream to Kafka → ClickHouse or BigQuery and aggregate hourly.
AI Cost Optimization with nOps
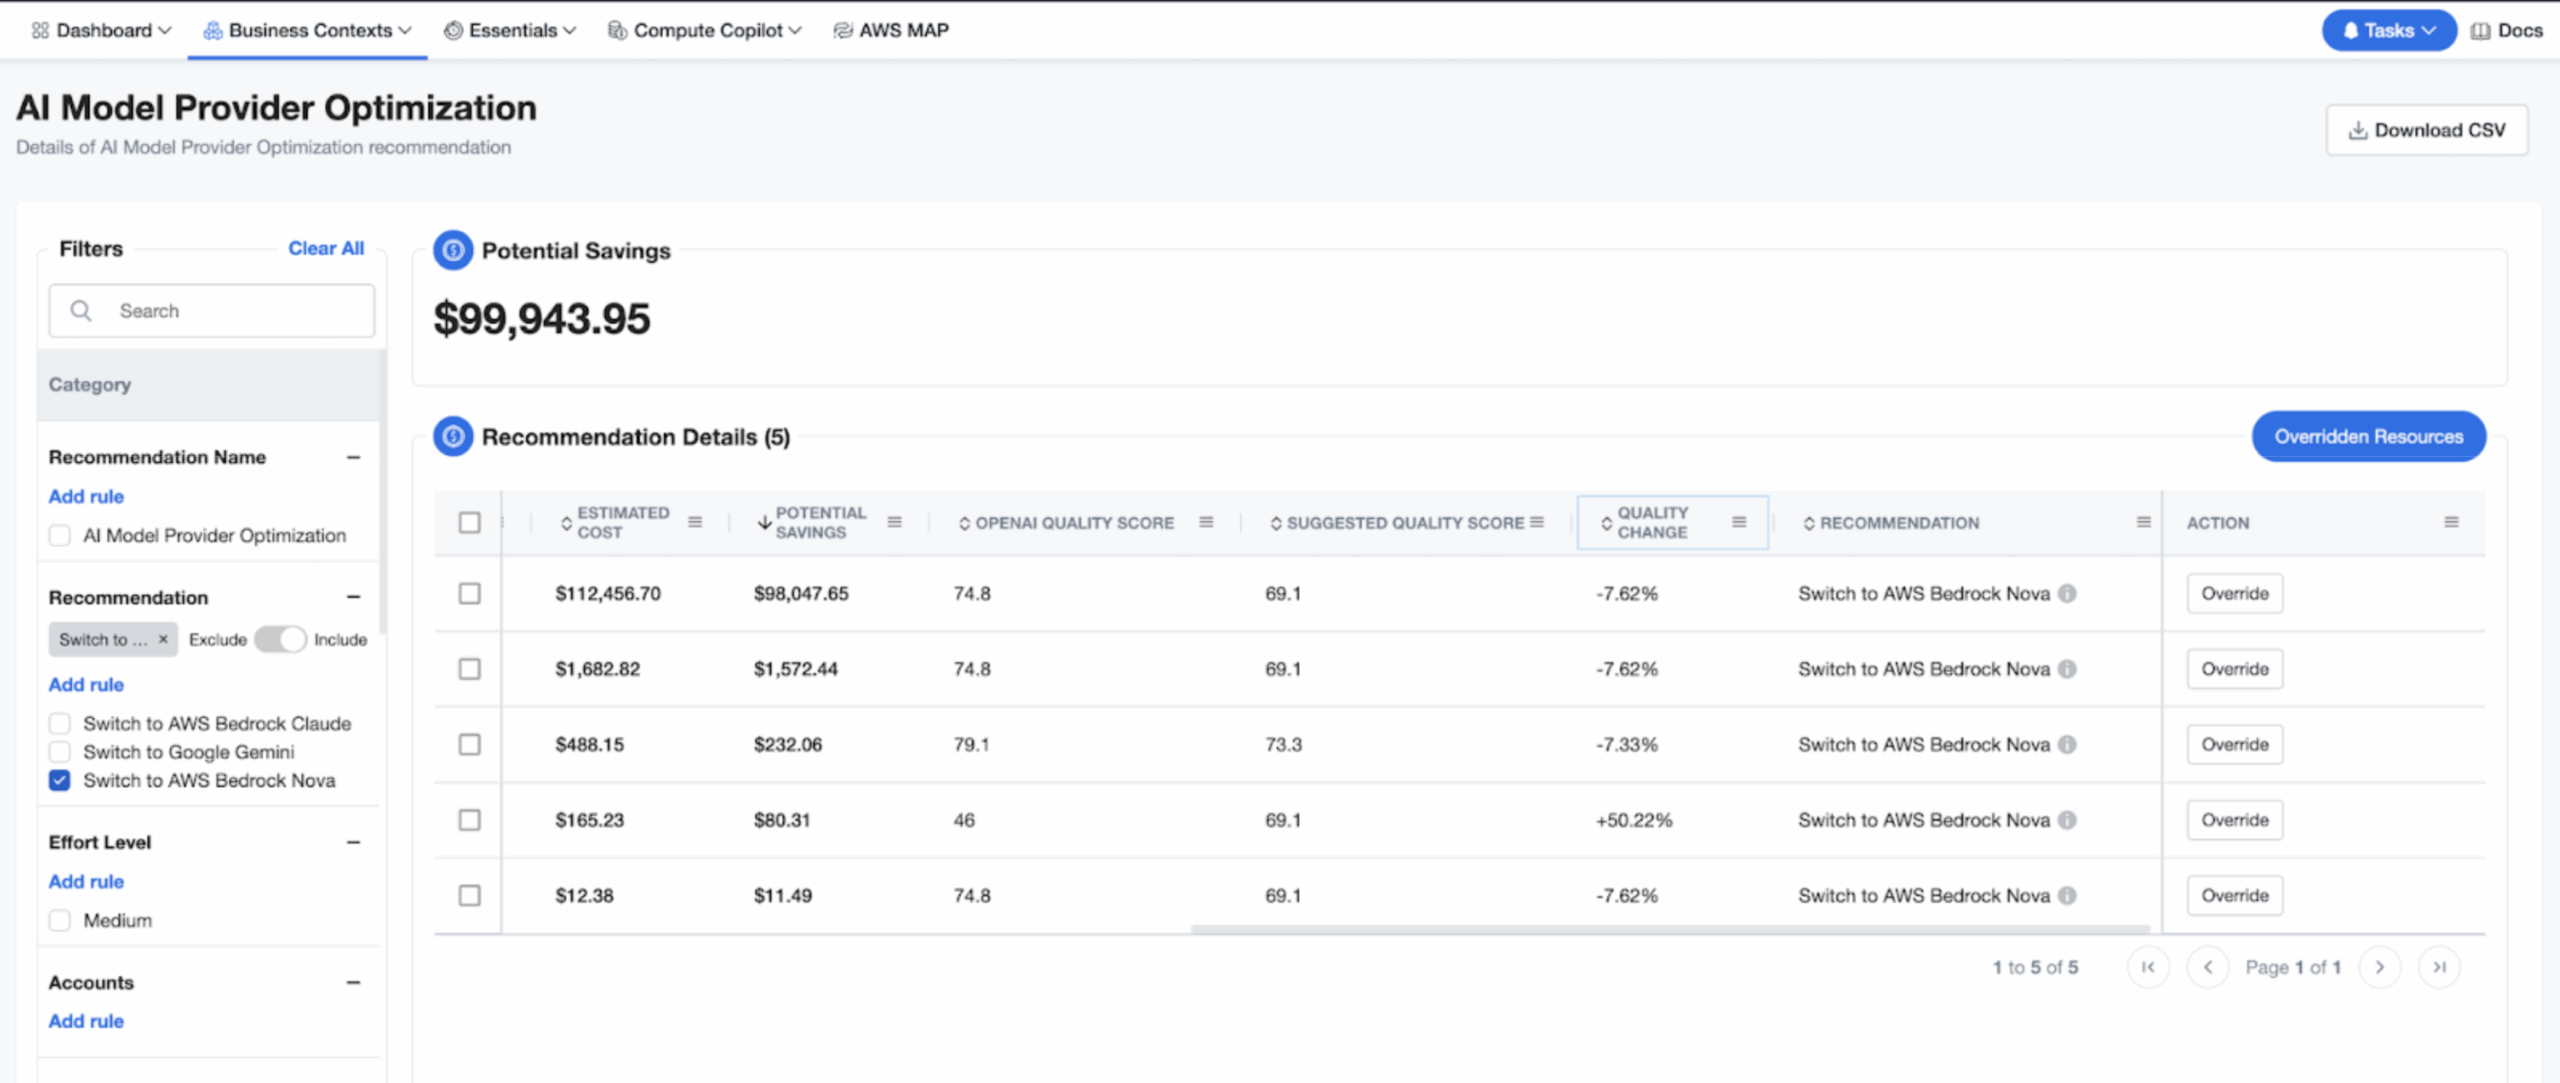
nOps gives you full-stack visibility and optimization across your GenAI pipelines — from GPU usage and token spend to model performance and optimization recommendations. Whether you’re analyzing model-level costs, tracking real-time GPU utilization, or identifying cheaper model alternatives without sacrificing SLAs, nOps brings everything into one platform with FinOps guardrails on top.
- One-click integrations – pull spend and usage from multicloud, SaaS and GenAI into a single pane of glass, with drill-downs by account, namespace or model.
- Model switch recommendations – compare token cost, latency, and accuracy to suggest lower-cost models or routing strategies without degrading SLAs.
- Budgets & proactive anomaly alerts – set thresholds on spend, get Slack/email alerts the moment they’re breached.
- Forecasting & reporting – ML-based spend forecasts and exportable chargeback/showback reports for finance.
- Granular cost allocation – split shared services down to team, feature, or environment.
- Discount & pricing optimisation – detect under-used Savings Plans/RIs and highlight cheaper provider or PTU pricing models.
nOps manages $2 billion in AWS spend and is rated 5 stars on G2. Book a demo to find out how to get visibility and control over your GenAI costs today!
Last Updated: February 9, 2026, Cost Optimization
Tags
Last Updated: February 9, 2026, Cost Optimization
