 Skip to content


- Blog
- EKS Optimization
- The Complete Kubernetes Cost Visibility Playbook
The Complete Kubernetes Cost Visibility Playbook
Kubernetes has become the backbone of modern infrastructure. But it also complicates cloud cost visibility. Unlike traditional environments, Kubernetes abstracts workloads away from underlying infrastructure, making it harder to track who’s spending what, where, and why.
This article walks through the complete nOps playbook for achieving Kubernetes cost visibility: from usage data and billing reports to forecasting, allocation, anomaly detection, and strategies for uncovering cost saving opportunities.
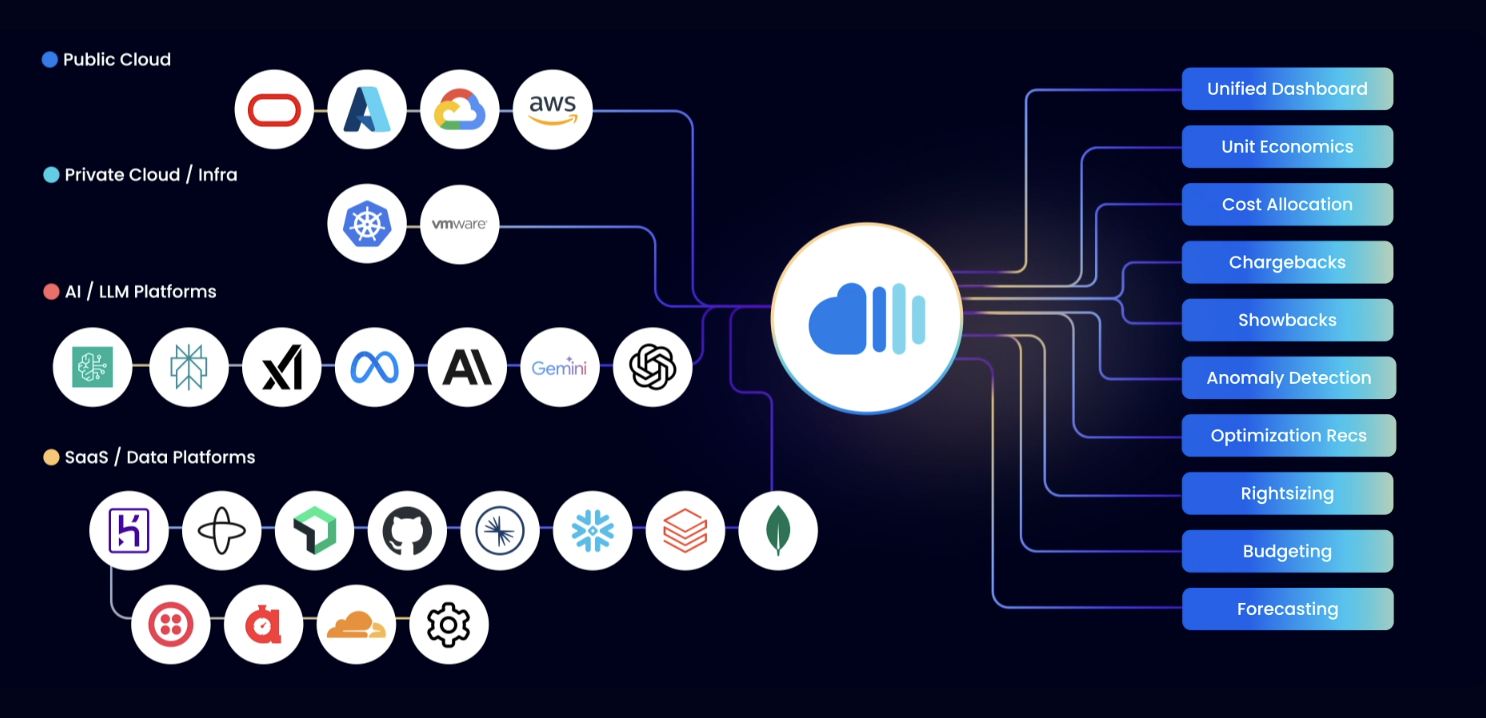
Part 1: Cost Data Integrations
Kubernetes is just one part of your cloud footprint—but often one of the most complex and expensive. To achieve cloud cost visibility, you need data from the following four sources:
Kubernetes Usage & Resource Data
This is your in-cluster view: what’s running, how much it’s requesting, and how much it’s using. You’ll need:
- CPU and memory requests (to represent guaranteed capacity)
- Actual usage over time (to reflect real consumption)
- Pod-to-node mappings (to attribute node-level costs back to workloads)
- Uptime and lifecycle data (especially for short-lived or ephemeral containers)
This data is foundational for rightsizing, allocation, and anomaly detection.
Multicloud Billing Data
While Kubernetes is cloud-agnostic, your bill is not. You still get charged at the infrastructure level (nodes, storage, data transfer), and that data lives in cloud-native billing tools like the AWS Cost and Usage Report (CUR), Azure Cost Management exports, or GCP Billing export to BigQuery.
These reports include the raw spend data, amortized commitment tracking, and account-level metadata. But they stop at the instance or volume level (not the container).
SaaS Metering Data
Kubernetes workloads increasingly depend on third-party services for observability, auth, feature flags, and more. These services often charge based on usage volume, users, or event counts.
Key integrations might include:
- Datadog / New Relic / Grafana Cloud – Logs, metrics, traces
- Auth0 / Okta – Identity and access charges
- Segment / Amplitude – Event-based pricing tied to user behavior
These costs often aren’t captured in cloud-native CURs but still contribute to the total cost of running a service. FinOps needs this for a complete COGS picture.
Tip: Most cloud cost platforms either miss key data sources, or charge based on usage. nOps includes all integrations out of the box and delivers complete cost visibility with simple, flat-fee pricing.
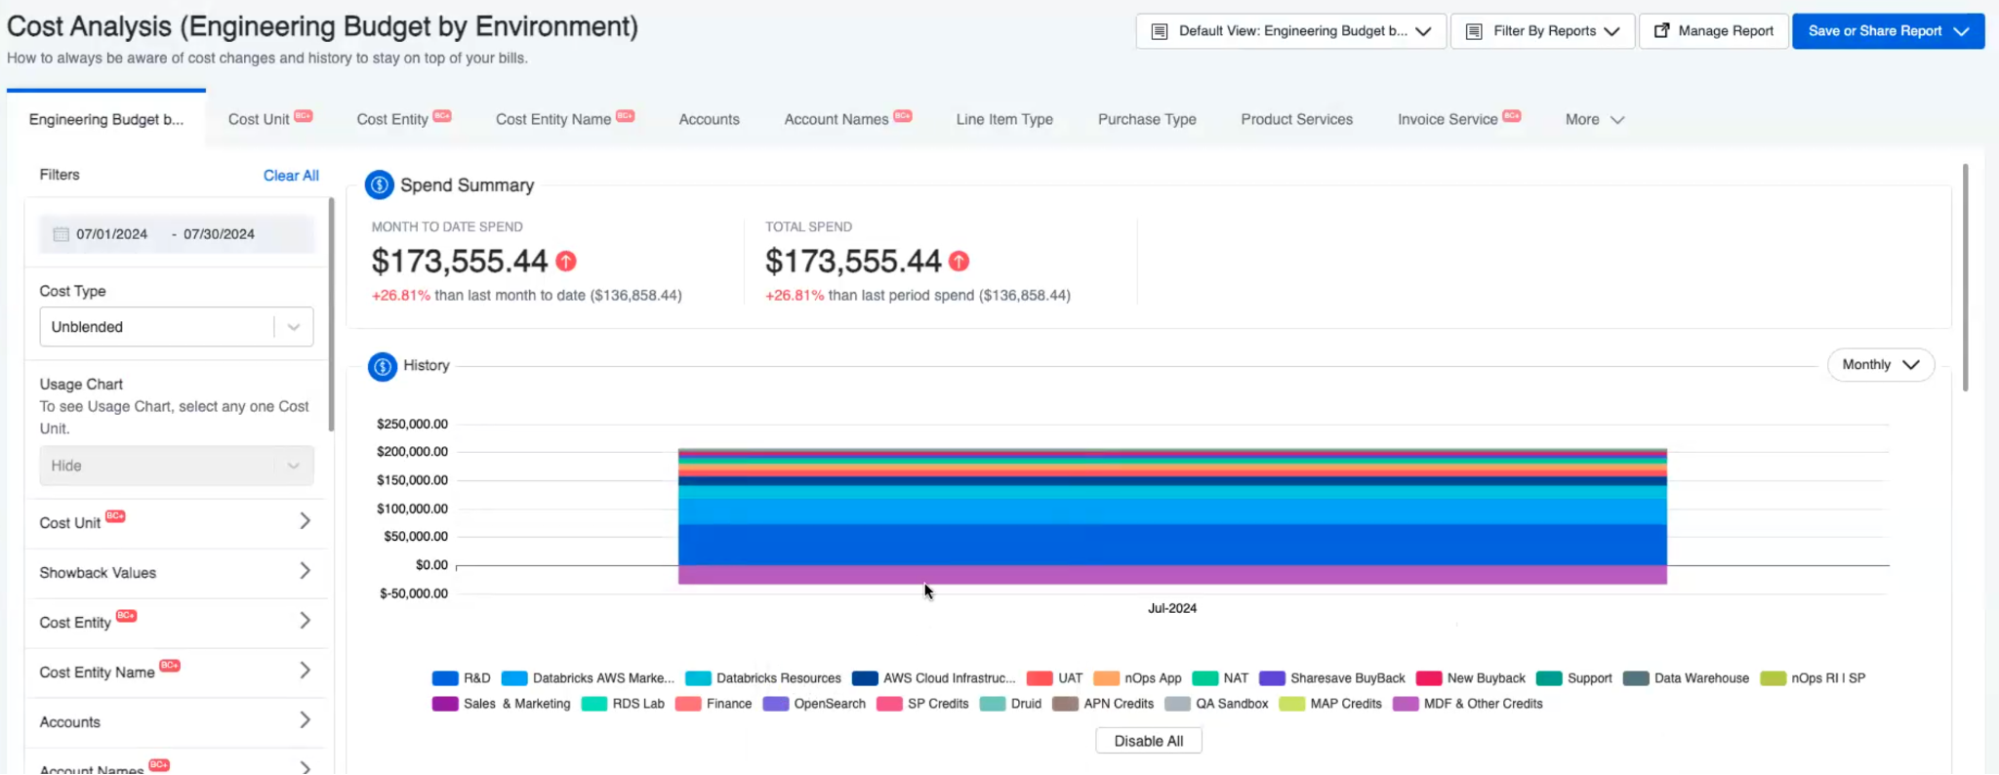
Part 2: Dashboards and Reports
| Stakeholder | What They Need to See | Key Use Cases | Format & Delivery |
| Engineers | – Live resource usage by pod and container – Rightsizing recommendations and thresholds – Idle or overprovisioned workloads – Cost impact of deployments and autoscaling | – Understand what’s running and what’s wasting resources – Optimize resource requests – React to autoscaling and overuse | – Real-time, granular views – Embedded in engineering tools (e.g., Grafana, Slack, Backstage) – Not static reports |
| FinOps | – Cost by team, service, label, or namespace – Spend trends (daily/weekly/monthly) – Shared cost attribution – Tagging compliance and optimization opportunities | – Power showback and chargeback- Identify opportunities to reduce waste – Drive accountability across teams | – Interactive dashboards – Exportable views – Filtering and drill-down by service/team/tag |
| Executives | – Spend and margin by business unit or product line – Budget vs actuals – Trends tied to revenue and product growth – High-level COGS visibility | – Understand financial performance by BU – Inform strategic decisions – Align cloud spend with business outcomes | – Summary dashboards – Slide-ready reports – Automated delivery to exec stakeholders |
| Finance | – Actual spend from AWS CUR and other billing exports – Amortized cost of commitments (RIs, SPs) – Applied credits and discounts – Forecasted spend vs budgets- Reconciliation-ready data | – Monthly close processes – Forecasting and planning – Match cloud costs to finance systems (e.g., NetSuite) | – Accurate, auditable reports – Delivered via CSV or BI tool – Matches bill line-for-line |
Part 3: Budgets & Forecasting
Once teams have access to accurate cost data, the next step is setting expectations: what they should spend, how efficiently they should run, and what’s coming next.
Budgets & Cost Targets
Budgets define how much a team, service, or environment should spend. In Kubernetes environments, where costs are often shared and workloads are dynamic, budgets are most useful when combined with cost targets—specific thresholds for a team, environment, or feature.
Teams can track budgets by:
- Kubernetes or engineering dimension (namespace, workloads, deployments, services, platform, etc.)
- Team or business unit (e.g., platform, growth engineering)
- Environment (e.g., dev, prod, staging)
- Service or workload (e.g., frontend, batch job, LLM inference)
Forecasting
Forecasting Kubernetes spend is harder than forecasting traditional infrastructure. Teams need to anticipate cluster growth from autoscaling, usage trends across services, upcoming deployments or seasonal spikes, and how changes in Reserved Instance or Savings Plan coverage will impact future spend.
Good forecasts are:
- Time-based (e.g., expected spend next month)
- Behavior-based (e.g., spend if X team scales Y microservice)
- Commitment-aware (e.g., amortized vs on-demand costs)
With nOps, you can forecast spend at the level that matters—by namespace, workload, deployment, service, or environment—so forecasts reflect how your infrastructure is actually organized.
Part 4: Cost Allocation
Cost allocation is assigning cloud spend to the teams, services, or features that actually used it. In Kubernetes, this is difficult, because workloads are dynamic, multiple containers share infrastructure, and costs like control planes or monitoring agents don’t map cleanly to individual pods.
To do it right, you need to combine cloud billing data (like the AWS CUR) with in-cluster usage metrics and labels that reflect team and service ownership. We cover this at length in our complete guide to Kubernetes cost allocation — or you can also use nOps to automate the process with accurate, credit-adjusted allocation down to the pod.
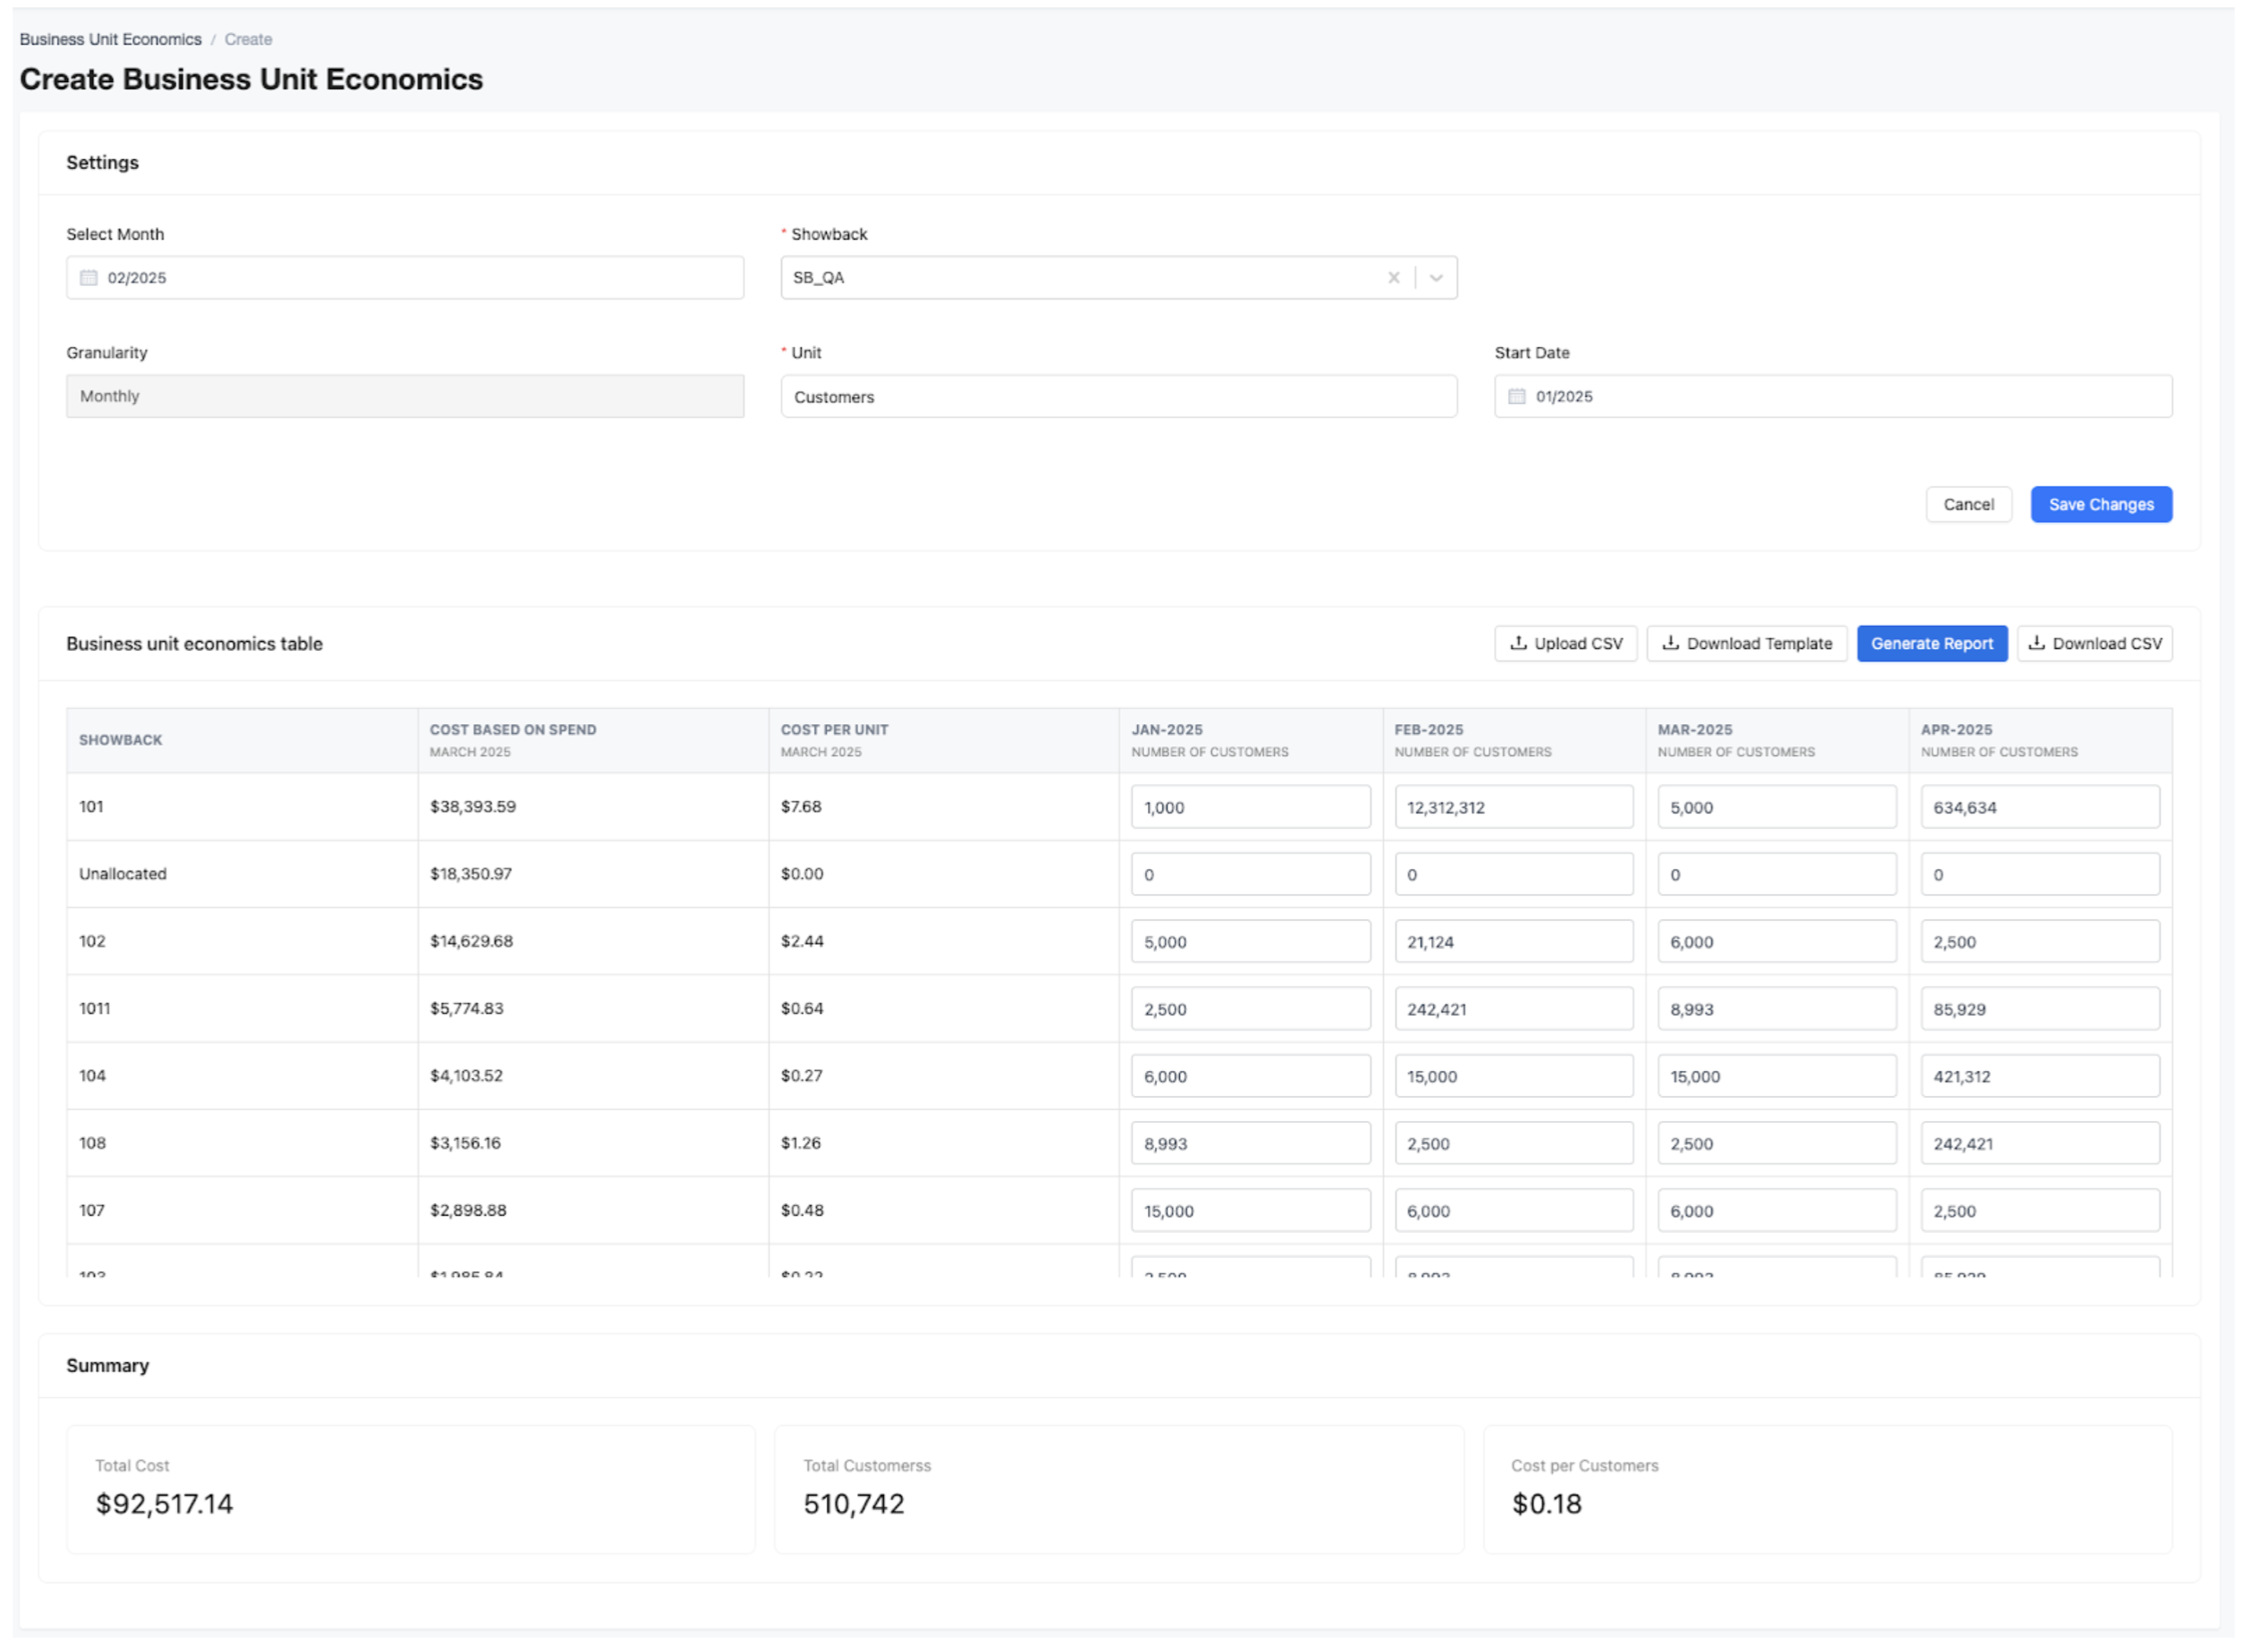
COGS and Unit Economics
| Metric | What It Tells You | Why It’s Useful |
| Cost per customer | Total Kubernetes cost attributed to a single tenant or user | Measure margin, track customer profitability |
| Cost per feature | Cost to run a specific product feature or service | Evaluate ROI, prioritize engineering resources |
| Cost per request / API call | Infrastructure cost per unit of usage | Feed into pricing models or freemium thresholds |
| COGS per business unit | Breakdown of operational cost by internal org or team | Inform chargeback, assess BU-level efficiency |
Part 5: Anomaly Detection
| Anomaly Type | Example | Why It Matters |
| Sudden cost spike | A single pod’s cost triples overnight due to misconfig | Prevents wasted spend from runaway workloads |
| Idle resource increase | Pods with zero CPU usage stay running for days | Surfaces inefficiencies that aren’t visible daily |
| Commitment underutilization | Reserved nodes drop below expected usage | Alerts teams to wasted prepaid commitments |
| Unexpected scaling | Horizontal Pod Autoscaler creates excess replicas | Highlights issues with scaling rules or thresholds |
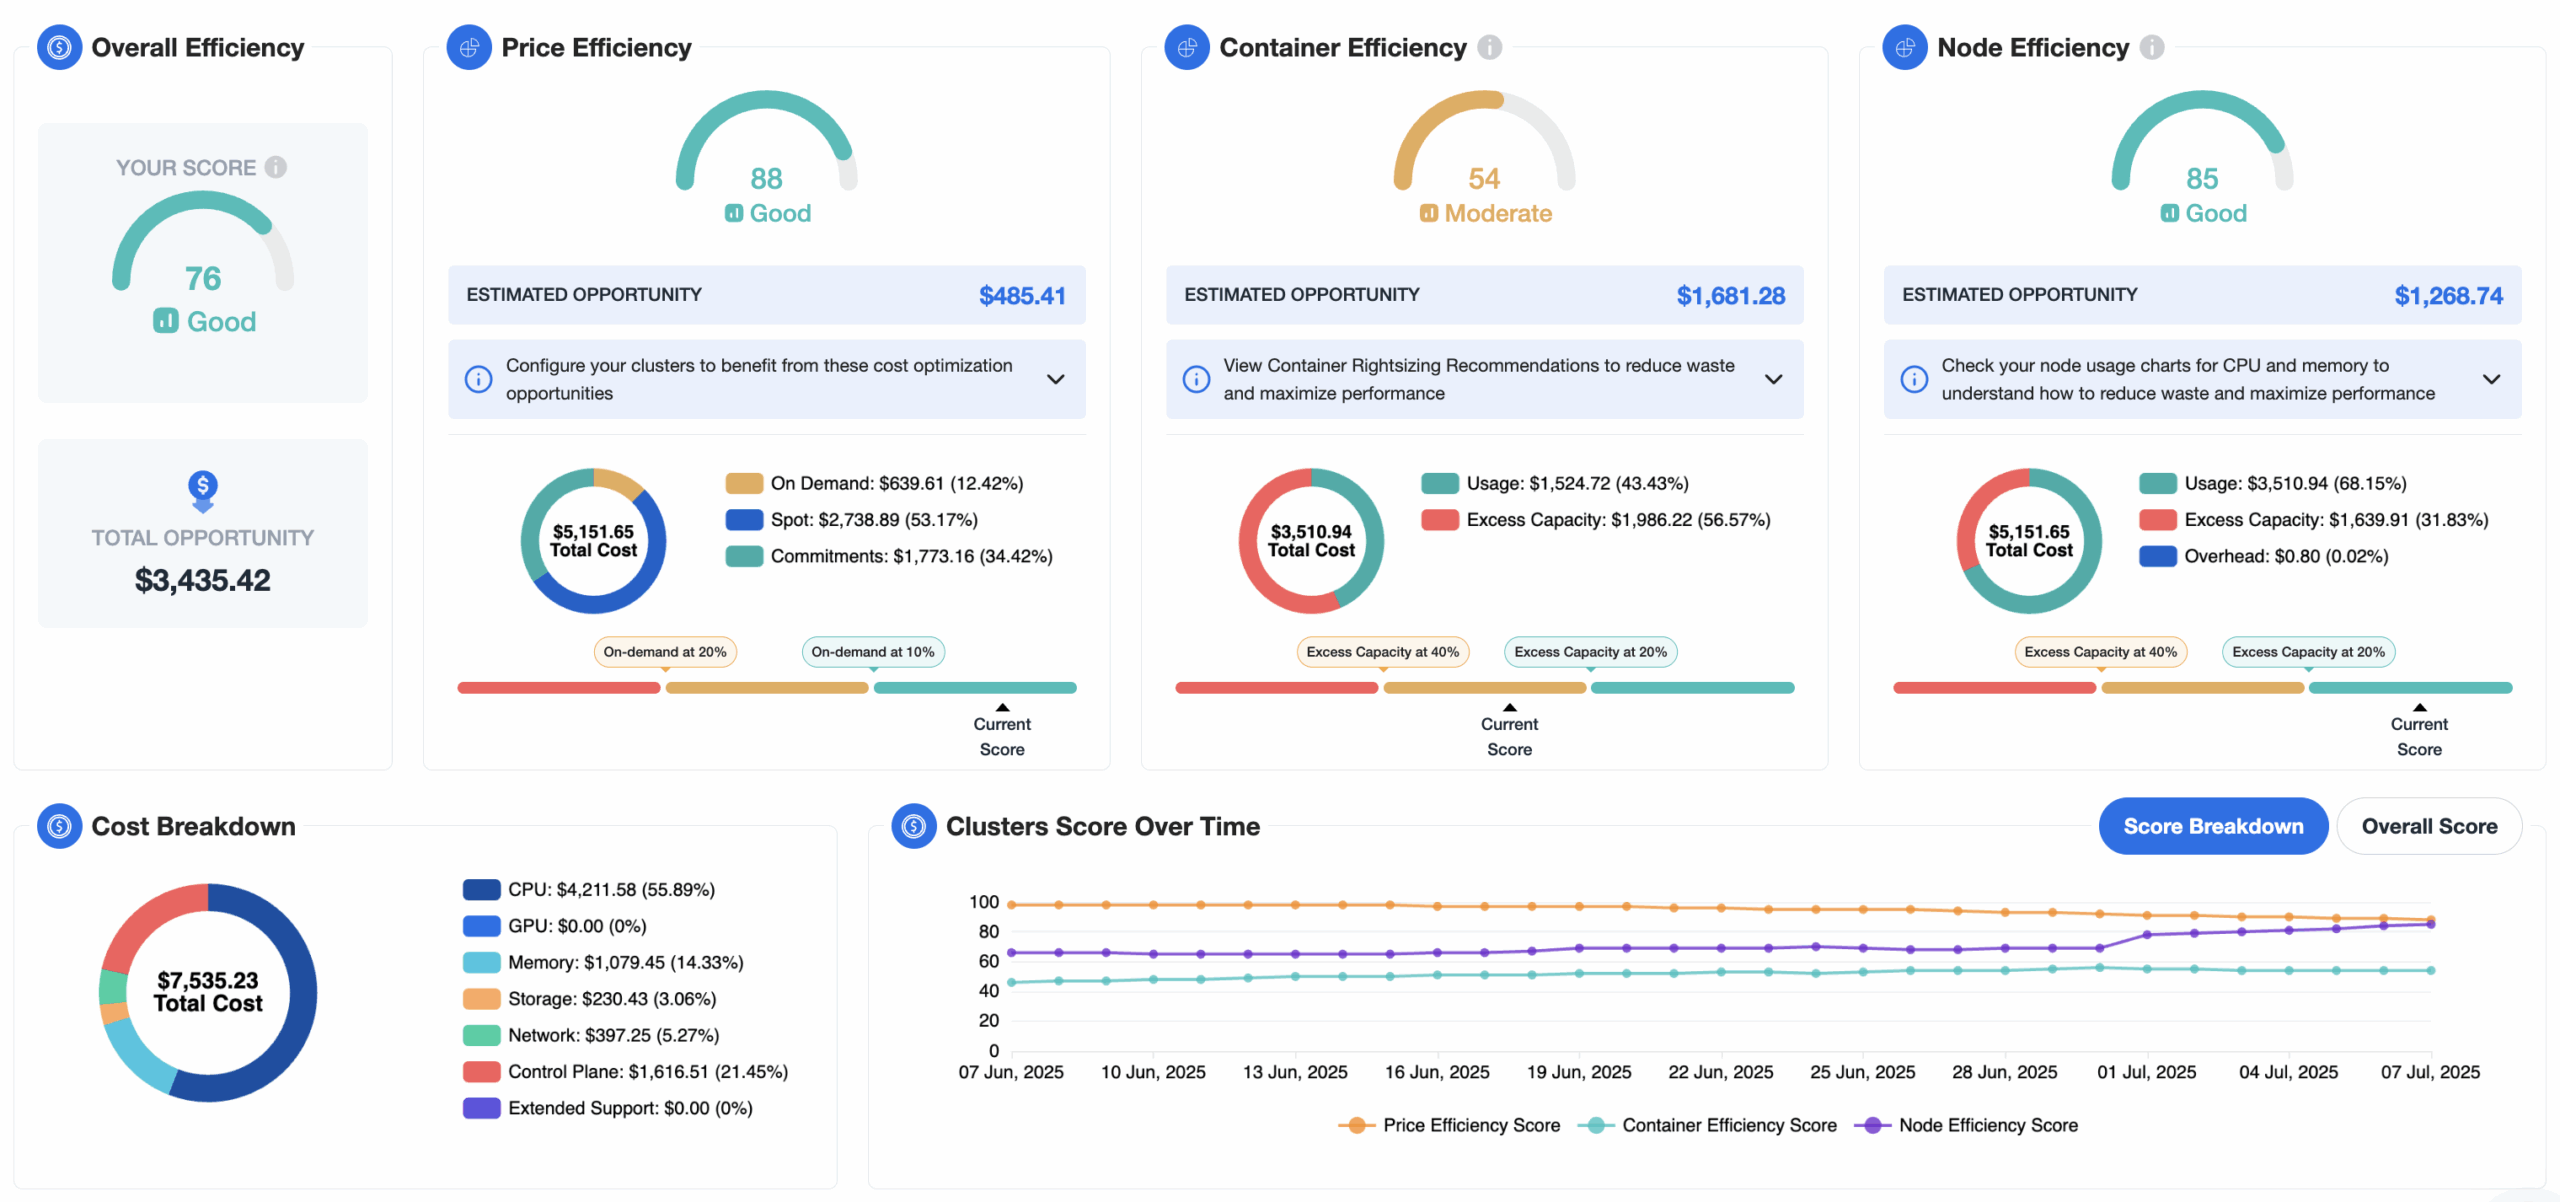
Cost Reduction Recommendations
Cloud cost optimization is often scattered across different tools, teams, and dashboards—making it hard to get a clear, actionable picture of where you’re overspending. In Kubernetes environments, the complexity multiplies: workloads scale dynamically, resource limits are hard to tune, and waste often hides in shared or idle infrastructure.
A unified view of cost-saving opportunities helps engineering, FinOps, and platform teams focus on what matters most. Rather than searching through usage reports or running ad-hoc queries, teams need structured, prioritized recommendations that highlight inefficiencies and link directly to the underlying resources.
Examples of common recommendations include:
- Right-size overprovisioned containers
- Remove idle or unused workloads
- Consolidate low-utilization nodes
- Migrate eligible workloads to Spot or Graviton
- Reduce log or metric retention in non-prod
- Eliminate redundant observability agents
- Clean up inactive namespaces and services
Part 2: Tools for Kubernetes Cost Visibility
Here’s a breakdown of the most commonly used Kubernetes cost visibility tools and where they excel or fall short:
Prometheus, CloudWatch, and metrics-server
These tools are the go-to source for Kubernetes usage metrics: CPU and memory utilization, pod lifecycles, and node performance. They’re essential for in-cluster visibility and powering rightsizing efforts. However, they don’t tie into billing data. There’s no connection to your AWS Cost and Usage Report (CUR), and no support for allocating actual spend to teams, services, or environments. They’re infrastructure tools rather than complete cost visibility solutions.
AWS-native tools (CUR, Split Cost Allocation)
AWS provides native billing tools like the Cost and Usage Report (CUR) and Split Cost Allocation Data, which are the most detailed sources of truth for spend tracking. CUR shows per-resource spend, applied credits, and amortized commitment costs; Split Cost Allocation lets you divide shared charges like EKS control planes or data transfer.
However, these tools are raw and require significant data engineering effort to make usable. They are essential data sources, but not standalone visibility solutions.
Kubecost
Kubecost is purpose-built for Kubernetes cost visibility and works directly with Prometheus to estimate and allocate cost across pods, namespaces, and workloads. It’s a popular choice for platform teams, especially in early FinOps adoption stages. But there are trade-offs:
- Cost: Kubecost’s pricing model is based on CPU cores, which can become extremely expensive at scale.
- No automation: Kubecost surfaces cost inefficiencies, but it doesn’t automate fixes. Teams still need to manually implement changes, increasing the operational burden.
- Limited to Kubernetes: Kubecost doesn’t track costs outside of Kubernetes, like EC2 instances, data transfer, or SaaS services used by workloads. That means engineers and finance teams must piece together multiple tools to understand total cloud cost — increasing complexity and leaving room for errors.
CloudHealth and Cloudability
These tools are strong contenders for traditional cloud cost reporting. They integrate with billing exports, provide governance and forecasting features, and offer high-level multi-cloud visibility. But like Kubecost, these platforms charge based on spend or data processed. As your cloud footprint scales, so does your bill — which can become a blocker for fast-growing teams trying to implement cost controls. And like Kubecost, they include limited automation for actually implementing recommendations.
nOps
nOps is a complete solution that helps you with everything we discussed in this article. The complete EKS Visibility feature set includes:
- Kubernetes Cost allocation: Allocate 100% of your AWS bill down to the container level with automated tagging, showbacks, chargebacks
- Total EKS Visibility: See cost, usage, and efficiency data across nodes and containers—plus pricing insights—all in one powerful Kubernetes UI
- Full Stack Reporting: Dashboards, reports, budgets, forecasting, and anomaly detection for visibility into 100% of your Multicloud, K8s, SaaS & AI spend
- EKS Optimization: continuously manage, scale, and optimize at the node, pod and pricing level
Hop on a call to find out how to get 100% accurate Kubernetes cost allocation set up in minutes.
nOps was recently ranked #1 with five stars in G2’s cloud cost management category, and we optimize $2 billion in cloud spend for our customers.
