
AI Spend Forecasting: How to Predict & Control AI Costs (2026)
According to the FinOps X 2026 keynote, many organizations had already spent three times their full-year AI budget by June 9. Those budgets were set months earlier, and teams that assumed token prices would keep falling found top-tier prices flat since November 2025 while usage kept climbing.
This guide covers why AI spend is harder to forecast than cloud spend, what to include in a forecast, the methods that work, how to turn a forecast into budgets, alerts and commitments, and how to express it in unit economics such as cost per request and cost per customer.
1. Why AI Spend Is So Hard to Forecast
A cloud forecast works because capacity is bought in known units and used at a fairly steady rate. AI spend breaks both assumptions. The unit being bought is a token, and the number of tokens in each request is set by prompts, context and model behavior rather than by a capacity decision anyone made.
Harness's 2026 survey of 700 engineering leaders found that 56% say anticipating AI spend is based on guesswork rather than data, and 72% had a surprise AI bill in the past year.
Token and usage volatility vs. fixed cloud costs
Cloud costs are forecastable because someone makes a capacity decision first. An instance has an hourly rate and bills whether or not it is busy, a commitment locks in a known monthly amount, and storage grows along a trend. Forecast error comes mostly from scaling events that engineers plan, so the model is capacity times rate, adjusted for known changes.
An LLM API bill has no capacity decision behind it. The price per token is published, but the number of tokens in a request is not fixed. It depends on the length of the prompt, how much retrieved context is attached, how long the answer runs, and on reasoning models how many thinking tokens are generated before the answer starts.
The Messages API is also stateless, so every turn resends the full conversation history, which means a long conversation costs more per message than a short one. The same feature can cost very different amounts per request depending on what the user pasted in and how long the session has run.
Demand is less predictable too. Cloud spend was largely driven by engineering teams, but employees in sales, marketing, legal and other functions now consume AI services directly, so no single team's roadmap explains the usage.
Unit prices move as well. A switch to a different model, or a provider's new release, changes what every token costs without any change in usage, so the forecast has to treat model mix as an input rather than a constant.
Multiplicative agent and inference growth
A chatbot answers one prompt with one model call. An agent runs a loop: it plans, calls a tool, reads the result, calls the model again, and repeats until the task is done. Each of those calls carries the growing conversation with it, so cost per task rises faster than the number of steps. Anthropic's own data puts typical agents at about 4 times the tokens of a chat interaction and multi-agent systems at about 15 times.
This is why requests per day stops being a good predictor of spend. Adding a tool, lengthening a system prompt, raising a step limit or splitting a job across sub-agents changes the tokens used per task, and those changes compound with usage growth. If usage doubles while tokens per task triple, the bill rises six times. A forecast built on a single multiplier misses in both directions, so volume and intensity have to be modeled separately, which is covered in the forecasting methods below.
2. What to Forecast
AI systems combine AI-specific services with ordinary compute, storage, database and networking, and the FinOps Foundation notes that the AI-specific components are forecast on different usage metrics than traditional cloud services, such as tokens, images and API calls. A forecast therefore has two decisions to settle before any modeling: which kinds of spend belong in it, and at what grain to report them.
LLM API spend (tokens) & GPU/compute
Token-billed model APIs are the largest category for most teams, but they are one of several. The table separates the main types of AI spend by what is billed and what moves the forecast.
Spend type | What is billed | What drives the forecast |
|---|---|---|
Token-billed model APIs | Input, output, cached and reasoning tokens, by provider and model | Tasks, tokens per task and model mix |
Seat-based AI tools | A fixed amount per user per month | Headcount, plan tier and adoption |
Provisioned capacity | Reserved throughput or capacity for a term, used or not | Commitment size, term and utilization |
Self-hosted models | GPU instance hours, plus storage and networking | Provisioned hours, rate and utilization |
Supporting services | Vector databases, embeddings, storage and orchestration compute | Data volume and query rate |
Packaged tools need a line of their own. For internal tools such as Cursor, Codex and Claude Code, pricing is per seat but the underlying cost is per token, and the two do not move together, so a seat count alone misses both idle seats and heavy usage.
Spend is also spread across channels: in the State of Tokenomics survey, half of the 472 companies were active across at least four of six channels at once, from frontier APIs to AI embedded in tools they already pay for, each billed and measured differently. The forecast has to roll up across all of them before it can be compared with a budget.
Self-hosted models behave more like a traditional cloud forecast. A GPU instance bills for every provisioned hour whether or not it is serving requests, so the forecast is built from provisioned hours and rate, and utilization is tracked separately because it sets the cost per token served. The FinOps Foundation's AI forecasting paper lists cost per GPU hour and GPU utilization among its core indicators.
Per-team, per-feature & per-model
A single total for AI spend hides who can change it. Each cut does a different job:
- Team: shows who owns the decisions.
- Feature: ties spend to a product and its revenue.
- Model: exposes the most direct cost lever, because price per token differs by model and a planned model migration changes the forecast without any change in usage.
These cuts only work if usage can be attributed when it happens. Separate API keys, projects or workspaces for each team and feature are the simplest way to get there. Anthropic scopes each API key to a workspace with its own spend and rate limits, and OpenAI breaks usage activity down by project. Where requests share a key, allocation rules applied to billing data can fill the gap.
Ownership matters as well: in the State of Tokenomics survey, companies with a clearly defined owner for AI economics were 3.7 times more likely to show their CFO a measurable outcome from AI spend, and a team-level forecast needs someone to answer for it.
Start at the finest grain that can be attributed today, forecast there, and sum upward. A bottom-up forecast also shows which team's assumption missed when the total does.
3. Forecasting Methods
The FinOps Foundation's AI forecasting paper recommends a weekly or monthly rolling forecast so that runaway or surprise spend is caught quickly. The two methods below run on that cadence and answer different questions: a usage model says what a workload should cost, and a trend forecast says where the bill is heading if recent behavior continues.
Usage-driven (tokens x price) modeling
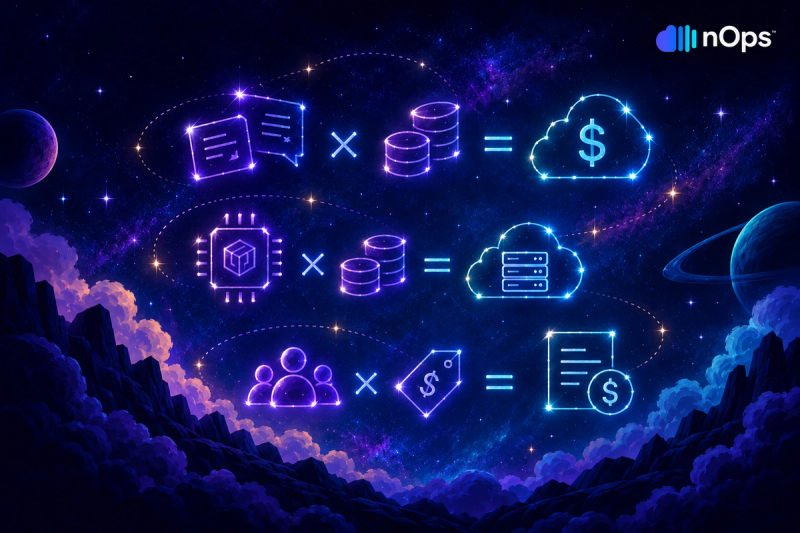
A usage-driven model applies the quantity-times-rate approach that the FinOps Foundation uses for each AI cost domain. For an API workload, monthly cost is the number of tasks, times the tokens per task, times the price per token, summed across models and token types. Input, output and cached tokens carry different rates, and on reasoning models thinking tokens are billed as output, so each gets its own line.
Each input has a different owner and a different level of uncertainty:
- Task volume comes from the product and sales plan.
- Tokens per task comes from production traces or a pilot. It needs a range rather than a single figure because it is the most volatile input, and the same paper cautions that a proof of concept may not represent production cost or scale linearly with adoption.
- Price per token comes from the rate card and the planned model mix.
Running low, base and high cases on tokens per task produces a band to plan against.
The model earns its keep in the variance review. When actuals arrive, split the miss into volume, tokens per task, and price or model mix. Each has a different fix, so a total variance figure on its own says little.
Trend + commitment-adjusted forecasts
A trend forecast projects recent spend forward without assumptions about the workload, which makes it a useful cross-check on the usage model. It works for steady, mature workloads with enough history. It fails across a change in regime, such as a new feature, a model migration or an agent rollout, and most AI workloads have too little history to trend cleanly. Keep its horizon short and compare it with the usage model each cycle. A persistent gap means one of them rests on a wrong assumption.
Commitments change the shape of the forecast. Provisioned throughput, reserved GPU capacity and contracted vendor capacity are paid for over a term whether or not they are used, and the FinOps paper notes that provisioned API capacity is charged upfront for a month or longer.
Split the forecast into a committed floor, which is known, and a variable layer above it, which comes from the usage model. Forecast the floor at its discounted rate and track commitment utilization alongside spend, because unused commitment is a cost a usage-only forecast will not show.
4. Turn Forecasts Into Action
In the State of Tokenomics survey, governance over AI spending is still early almost everywhere, and the default control is a spending cap or token limit. A forecast improves on a flat cap by showing, before the month ends, which teams are on course to breach it.
Budgets, alerts & guardrails
Set each budget from the forecast at the grain it was built, so a team's budget is its own forecast plus an agreed margin.
Alerts then need two signals:
- Projected month-end spend against budget catches slow drift.
- A comparison of current spend against the forecast's expected rate catches fast changes, because a spike that starts and ends within a few days can pass under a monthly threshold.
Daily detection is too slow for AI spend: a runaway agent loop can burn $5,000 in three hours, so alerts should run hourly and name the team, model and feature behind the spike.
Guardrails cap the factors behind the forecast. Both major providers support limits per workspace or project: Anthropic workspaces take monthly spend limits with threshold alerts, and rate limits, and OpenAI projects take monthly limits that can be soft or hard.
A hard limit makes API calls fail once the limit is reached, which suits experiments, development and fixed-budget customer projects. Production services usually warrant an alert and a review instead, because a hard limit stops the product along with the spend.
Inside the application, a cap on output length and a step limit on agent loops put a ceiling on tokens per task, the input most likely to move, and a model allowlist keeps the model mix close to what the forecast assumed.
Commitment planning from forecasts
A forecast shows which usage is dependable enough to commit to. That is the floor: demand that has held across recent periods and belongs to a production workload. Commit to the floor and leave the variable layer on demand.
Provisioned throughput lowers the price per token in exchange for a term, but it is billed whether or not it is used, and the FinOps paper warns that cost per token processed can end up higher than on-demand rates when utilization is low.
The break-even is simple. A commitment pays off only when utilization stays above the ratio of the committed rate to the on-demand rate, so a commitment priced at 70% of the on-demand rate has to be used more than 70% of the time to save anything.
Term length matters as much as size. The same paper cautions against committing too much for too long while prices and models are changing quickly, so shorter terms or smaller floors suit workloads that are likely to move to a newer model.
The same logic applies to GPU capacity under Savings Plans or reservations: commit to the hours the forecast shows running continuously. Refresh the floor each forecast cycle, since a commitment sized from last quarter's forecast can be oversized after a model migration.
5. Unit Economics & Business Metrics
In the State of Tokenomics survey, 52% of companies had already changed their pricing model because of AI costs or were considering it, largely because unpredictable AI costs were pressuring margins, so a forecasting miss reaches margins or customer invoices instead of staying inside the cost center.
A dollar total cannot show whether growing spend is healthy. Unit metrics can, and they connect the forecast to the business plan.
Cost per request / per customer
Cost per request is the AI spend attributed to a feature divided by the requests it completed. For agents, one request can trigger many model calls, so cost per completed task is the more useful unit.
Cost per customer divides the spend attributed to a customer or account by the number of customers, or is reported by account to show the spread. The FinOps Foundation's forecasting paper recommends tracking a cost per unit of work as a core measure.
Units turn the forecast into two inputs with different owners. Product and sales own volume, from the plan for requests, tasks or customers. Engineering owns unit cost, through model, prompt and caching choices. Forecast spend is the product of the two, which gives finance a driver-based forecast that responds to the plan and gives each team a number it controls.
Unit cost also shows where pricing and cost diverge. AI cost per customer can vary significantly, so an account with heavy usage can cost many times the average to serve while paying the same flat fee. Comparing cost per customer with revenue per customer by segment shows which accounts are unprofitable before the invoice does.
Per-customer costs need customer identifiers on requests or in cost allocation tags at the time of the call, which is the same attribution work described in section 2.
How nOps Forecasts & Controls AI Spend
nOps Inform covers each step in this guide in one platform: attributing AI spend, forecasting it, setting budgets and catching drift (along with your other multicloud, SaaS and Kubernetes costs).
- Per-team and per-feature attribution. nOps Inform maps AI spend hour by hour to the model, account, team, customer and feature behind it, with token-type breakdowns for input, output, cache-read and cache-write tokens. Virtual tag rules allocate spend without changes to AWS tagging or application code.
- Usage-based forecasting and budgets. Time-series machine learning forecasts future spend from historical usage trends, and budgets can be set by team, customer, feature or product as fixed budgets or dynamic cost targets.
- Real-time drift alerts. Hourly anomaly detection compares each hour with the same hour the prior week and flags spikes, along with structural anomalies such as a new model appearing in an account or a workload running at an unusual time. Each alert is tied to the model, account and department behind it.
- Commitments and spend limits. nOps Commitment Management automates rate optimization across AWS, Azure and GCP. AI recommendations surface provisioned throughput, model substitution and cache tuning candidates alongside spend, and AI Wallets set spend limits at the group or seat level with predictive alerts for seats on track to exceed them.
Book a demo to see your own AI spend attributed and forecast.
nOps manages $5 billion in AI and cloud spend and was recently ranked #1 in G2’s Cloud Cost Management category.
FAQs
How do you forecast AI costs?
Model each cost driver as quantity times rate: tasks times tokens per task times price per token for API workloads, and provisioned hours times rate for GPUs. Use ranges for tokens per task, then replace assumptions with actuals on a weekly or monthly cycle, as the FinOps Foundation recommends for AI.
Why is AI spend hard to predict?
Because tokens, the unit of billing, vary with prompts, context, output length and agent loops instead of with provisioned capacity. Agents typically use about four times the tokens of a chat interaction and multi-agent systems about fifteen times, and AI use is spreading beyond engineering teams, which makes demand harder to plan.
How do you budget for LLM usage?
Set budgets from the forecast at the team or feature level, with alerts at thresholds ahead of the limit and spend or rate limits on the keys, projects or workspaces that carry the traffic. Use hard limits for experiments and fixed-budget projects, and alerts with review for production services, since a hard limit stops the service as well as the spend.
Can AI spend be forecast per team?
Yes, when usage is attributed to teams before the forecast is built. That takes separate API keys, projects or workspaces per team, or allocation rules applied to billing data, and a forecast assembled bottom up from each team's volume and tokens per task.