Skip to content


Monitoring plays a central role in modern DevOps workflows. It gives teams the data they need to understand system health, catch problems early, and keep deployments running smoothly.
This article covers the most important aspects of DevOps monitoring in 2025—from the types of tools available to the key metrics to track and how to evaluate what’s right for your environment. We’ll also break down the top 15 DevOps monitoring tools, with a clear look at their features, pros and cons, and pricing.
What is DevOps Monitoring?
DevOps monitoring is a practice that helps organizations track the performance of applications, infrastructure, and services to detect, diagnose, and fix issues quickly. DevOps monitoring tools collect data from various sources and provide a dashboard that displays performance, availability, and usage metrics. This data can be used to identify trends and issues that can be addressed before they become major problems.
Importance of DevOps Monitoring
- Surfaces real-time signals from infrastructure, services, and deployments
- Shortens MTTR by giving you the data to debug fast
- Helps identify performance regressions before they hit production
- Enables alerting and automation based on defined thresholds or anomaly detection
- Tracks resource usage for capacity planning and rightsizing
- Provides historical data for root cause analysis and trend correlation
Types of Monitoring Tools in DevOps
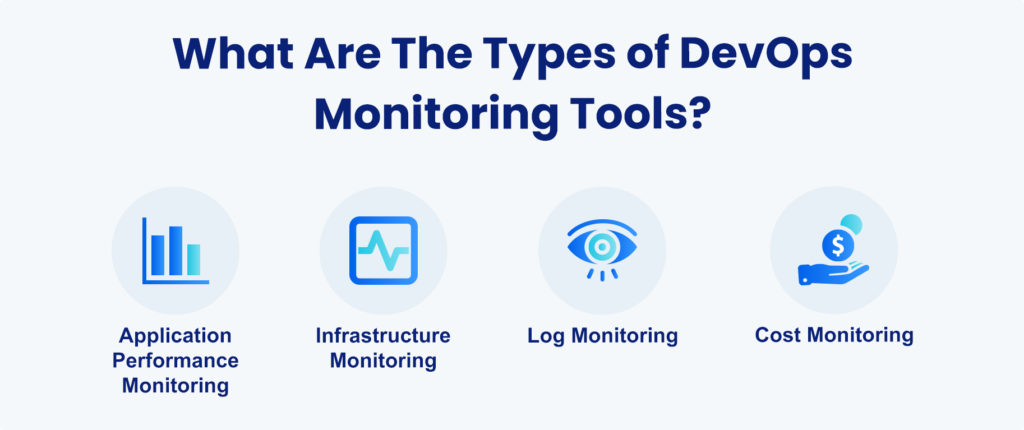
Many different DevOps monitoring tools are available, each with features and capabilities. Here are some of the most popular types of DevOps monitoring tools:
| Monitoring Type | What It Tracks | Common Use Cases | Examples |
|---|---|---|---|
| Application Performance Monitoring (APM) | Latency, error rates, request traces, transaction bottlenecks | Identify slow services, trace backend issues, improve response time | New Relic, AppDynamics, Dynatrace |
| Infrastructure Monitoring | CPU, memory, disk I/O, network traffic, host and container health | Detect resource contention, prevent outages, monitor infrastructure health | Prometheus, Datadog, Zabbix |
| Log Monitoring | Structured and unstructured logs from systems, apps, and services | Troubleshoot incidents, detect anomalies, trace root causes | ELK Stack (Elasticsearch, Logstash, Kibana), Fluentd, Graylog |
| Synthetic Monitoring | Simulated user interactions to test availability and response time | Proactively test endpoints and APIs, validate SLAs | Pingdom, Uptrends, Sematext Synthetics |
| Real User Monitoring (RUM) | Live user behavior—page loads, frontend errors, session details | Improve frontend performance, monitor UX across devices | Datadog RUM, Google Analytics, Sentry |
| CI/CD Pipeline Monitoring | Pipeline status, build times, test failures, deployment success/failures | Monitor pipeline stability, track failed deployments or flaky tests | Jenkins, GitLab CI, CircleCI monitoring plugins |
| Cost Monitoring | Cloud service spend, resource utilization efficiency, cost anomalies | Control cloud spend, catch unexpected usage spikes, optimize resources | nOps, CloudHealth, AWS Cost Explorer |
| Security Monitoring | Access logs, audit trails, intrusion attempts, compliance drift | Identify misconfigurations, audit changes, detect suspicious | Splunk, Sumo Logic, AWS GuardDuty |
How to Choose the Best DevOps Monitoring Tool?
The right monitoring tool depends on your stack, scale, and what your team needs to see—without adding unnecessary overhead. Here are the key things to evaluate:
1. Coverage of Key Metrics
Make sure the tool tracks the metrics that matter for both performance and reliability:
- Uptime: Confirms service availability and helps meet SLAs.
- Response Time: Surfaces latency in APIs, services, and user transactions.
- Error Rate: Helps catch failures early—especially in distributed systems.
- Throughput: Measures request volume or processing load to catch scaling issues.
- Resource Utilization: Tracks CPU, memory, disk, and network usage to support rightsizing and performance tuning.
2. System Compatibility
Does the tool support your infrastructure and frameworks out of the box—Kubernetes, EC2, serverless, containers, hybrid cloud? A good tool should fit into your environment without requiring extensive customization.
3. Deployment and Overhead
Agent-based or agentless? Can it be installed via Terraform, Helm, or pipelines? Look for tools that are easy to deploy and won’t consume excessive resources—especially in production environments.
4. Alerting and Automation
Real-time alerting is table stakes, but the best tools support configurable thresholds, anomaly detection, and integrations with on-call platforms like PagerDuty, etc. Bonus points if it can trigger actions—like auto-scaling or rollbacks.
5. Data Retention and Querying
Can you access historical data for RCA and trend analysis? Is the query language flexible enough to correlate across metrics, logs, and traces?
6. Cost Model
Understand how pricing scales. Some tools charge per host or per container, others by data ingestion volume or user seats. Watch out for pricing cliffs as usage grows.
7. Open Source vs. Commercial Tradeoffs
Open-source tools (e.g., Prometheus, Grafana) offer control and flexibility, but require internal maintenance. Managed tools (e.g., Datadog, New Relic) reduce ops overhead, but may limit customization and get expensive fast.
Top 15 DevOps Monitoring Tools in 2025
Taking into account these factors, here are the top 15 DevOps Monitoring tools to consider:
1. nOps
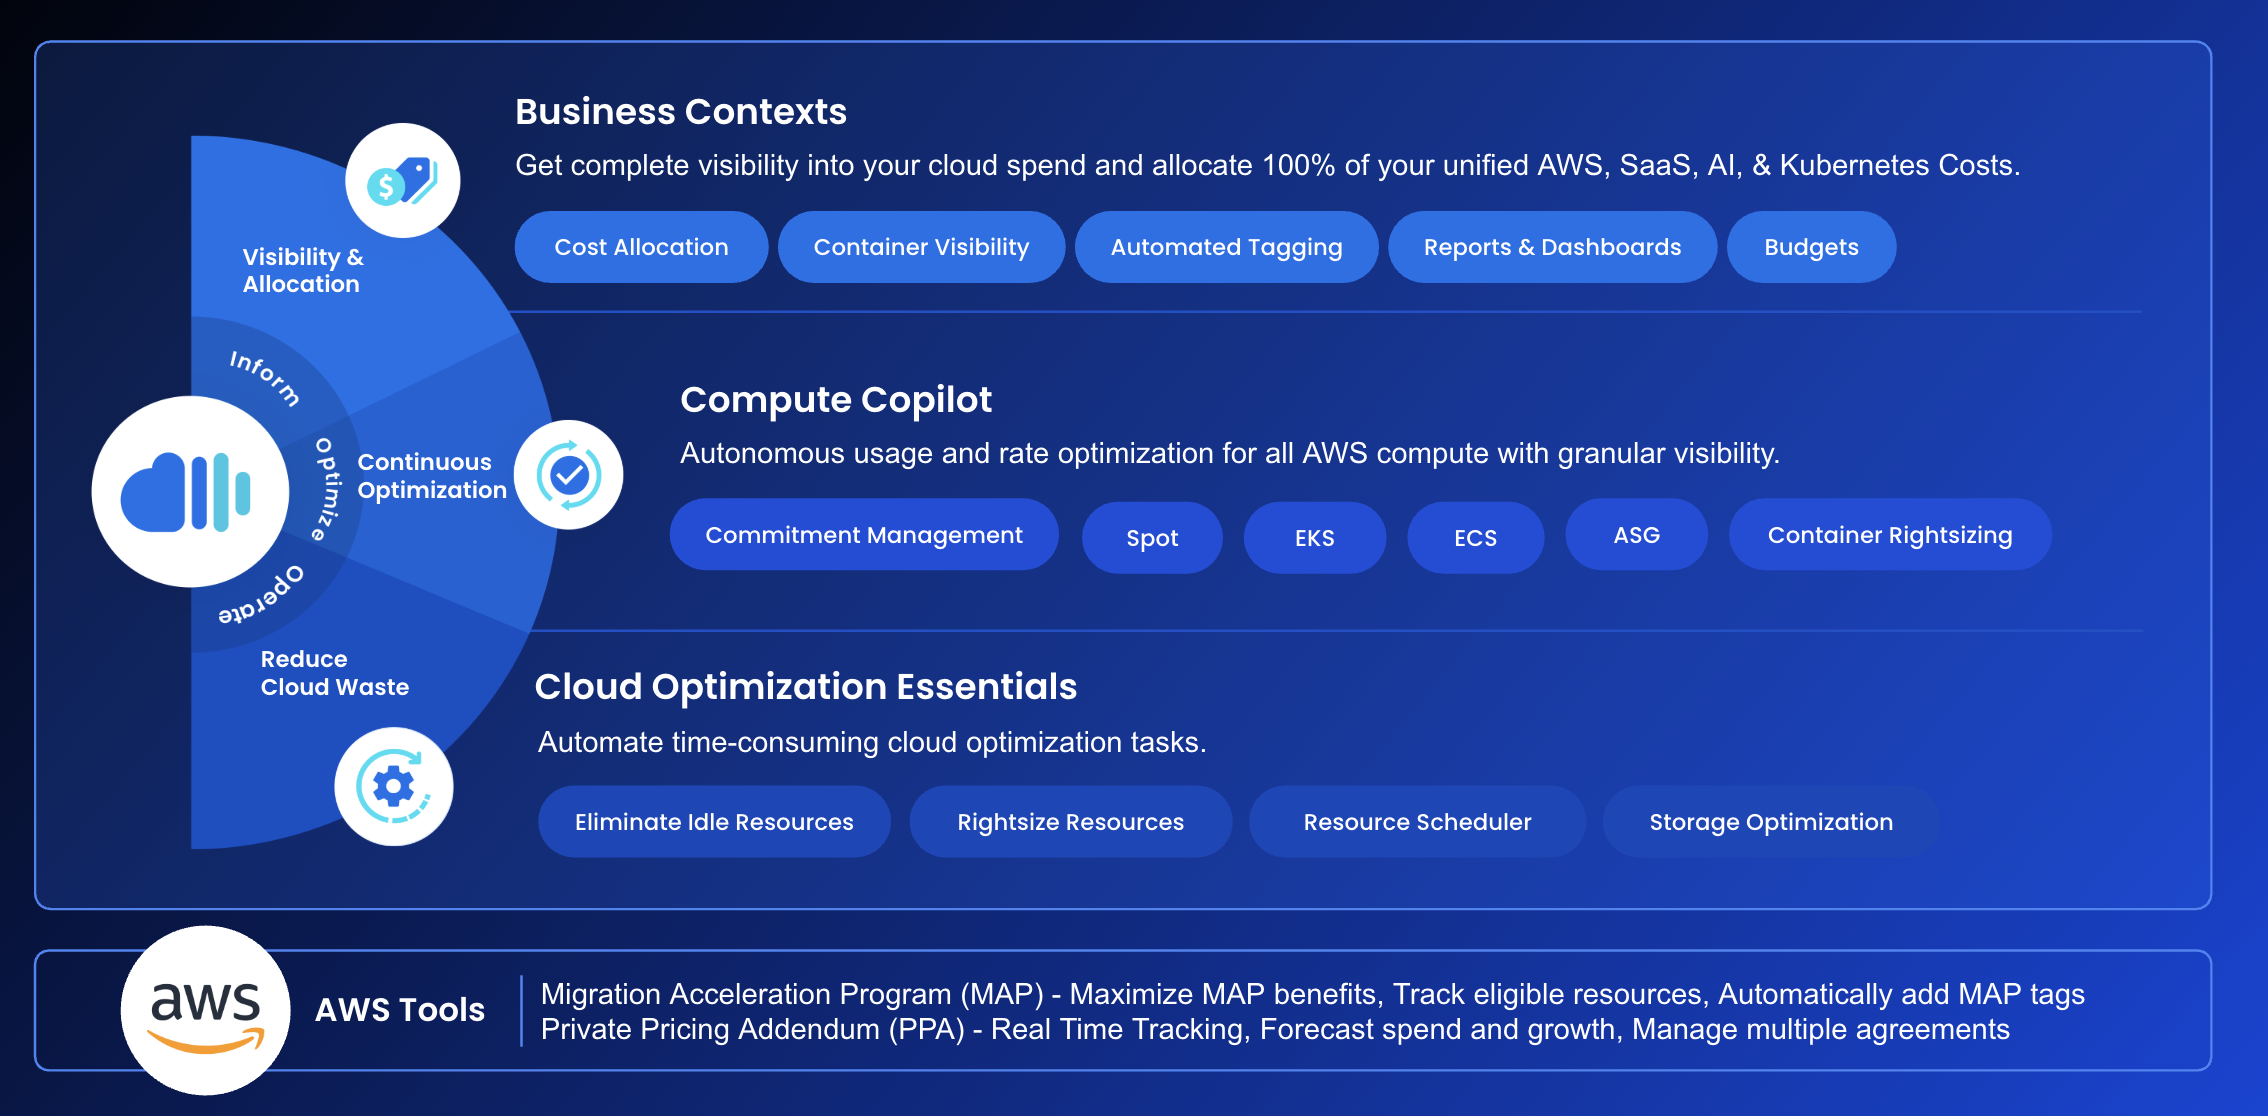
To make it faster and easier for you to understand and optimize your cloud costs, nOps created an all-in-one automated cloud optimization platform. It includes:
Cost Visibility: understand 100% of your AWS bill with cost allocation, reports, budgets, forecasting, and dashboards built for engineers and finance.

Compute Optimizer: makes it easy to automatically manage workloads and save with container rightsizing, Spot discounts, and more.
Commitment management: automatic life-cycle management of your AWS commitments with risk-free guarantee
Waste Reduction: One-Click automatic rightsizing, storage optimization, scheduling, and other waste reduction
Pros:
- End-to-end platform for visibility and optimization — for greater efficiency, ease of use, and value
- Rated 5 stars on G2 and named #1 best cloud cost management tool
Cons:
- Focuses on AWS optimization
Book a demo to see how much you can save on your AWS bill.
2. Datadog

Datadog is a cloud-native monitoring and analytics platform used widely across DevOps and SRE teams. It offers end-to-end observability for infrastructure, applications, logs, and security data in a single interface. With over 600 integrations, Datadog works well in complex, multi-cloud environments and supports everything from APM to CI/CD pipeline visibility.
Pros
- Seamlessly integrates metrics, logs, and traces in one platform
- Excellent dashboarding and alerting with minimal setup
Cons
- Pricing can become expensive at scale, especially with multiple data types
- Some advanced features require steep learning or custom tuning
3. Splunk
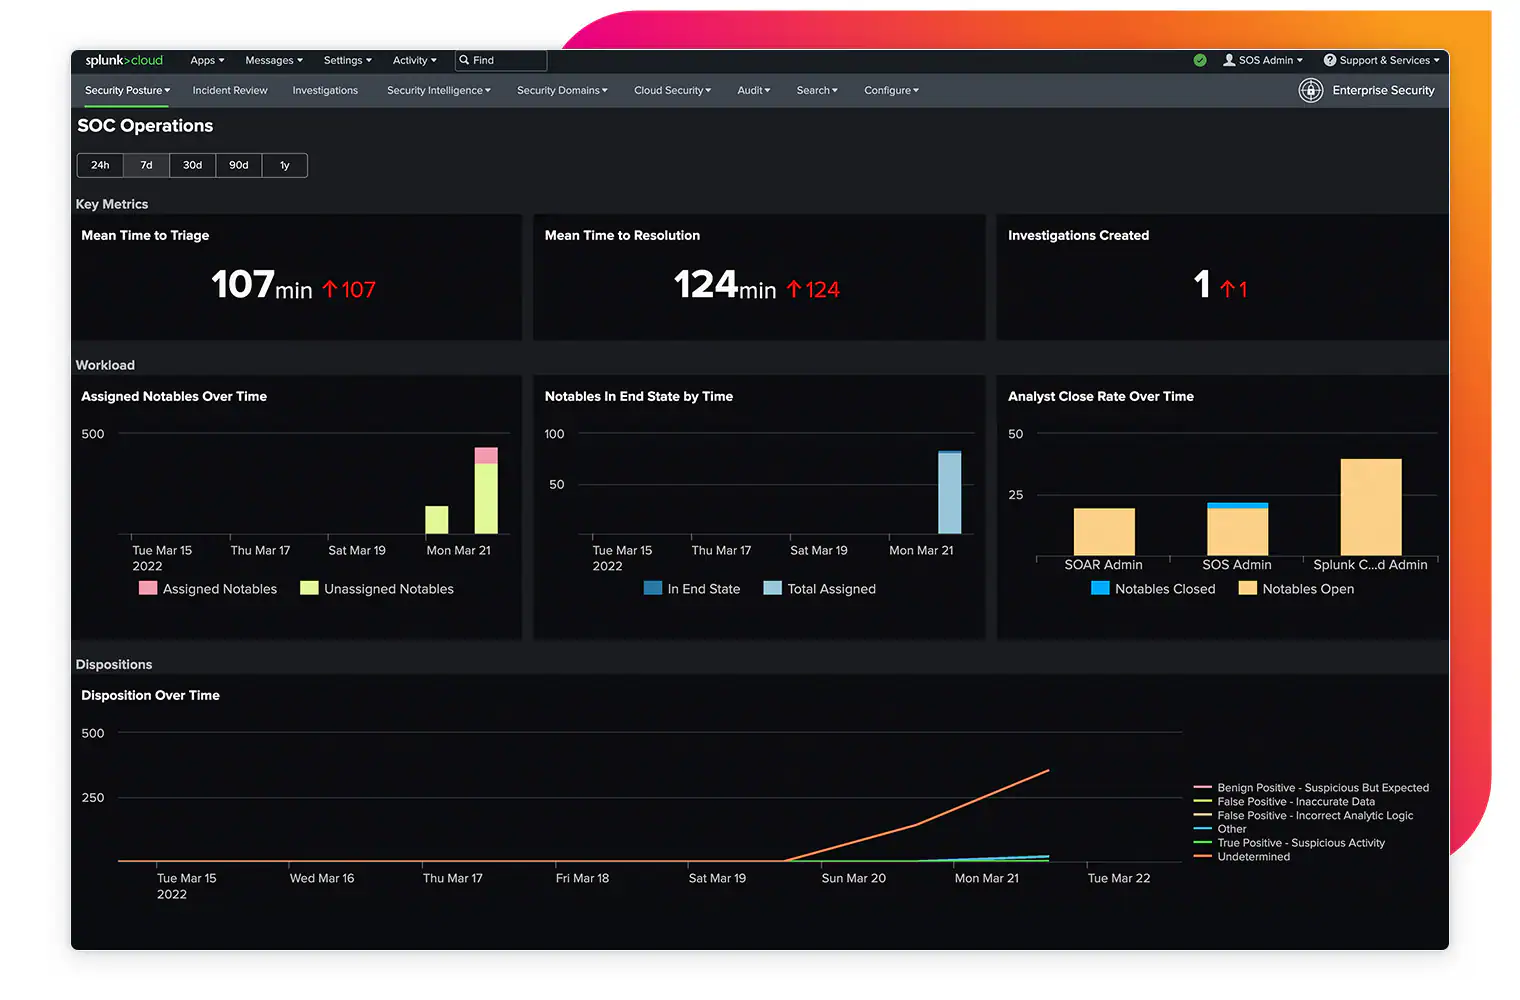
Splunk is a powerful platform for searching, analyzing, and visualizing machine-generated data. It’s widely used in DevOps, IT operations, and security for log aggregation, monitoring, and real-time alerting. With support for custom queries and large-scale ingestion, Splunk excels in environments with complex logging needs.
Pros
- Scalable log analysis with strong search and filtering capabilities
- Flexible data ingestion from virtually any source
Cons
- Licensing is based on data ingestion volume, which can get expensive quickly
- Steeper learning curve for custom queries and dashboard creation
4. AppDynamics
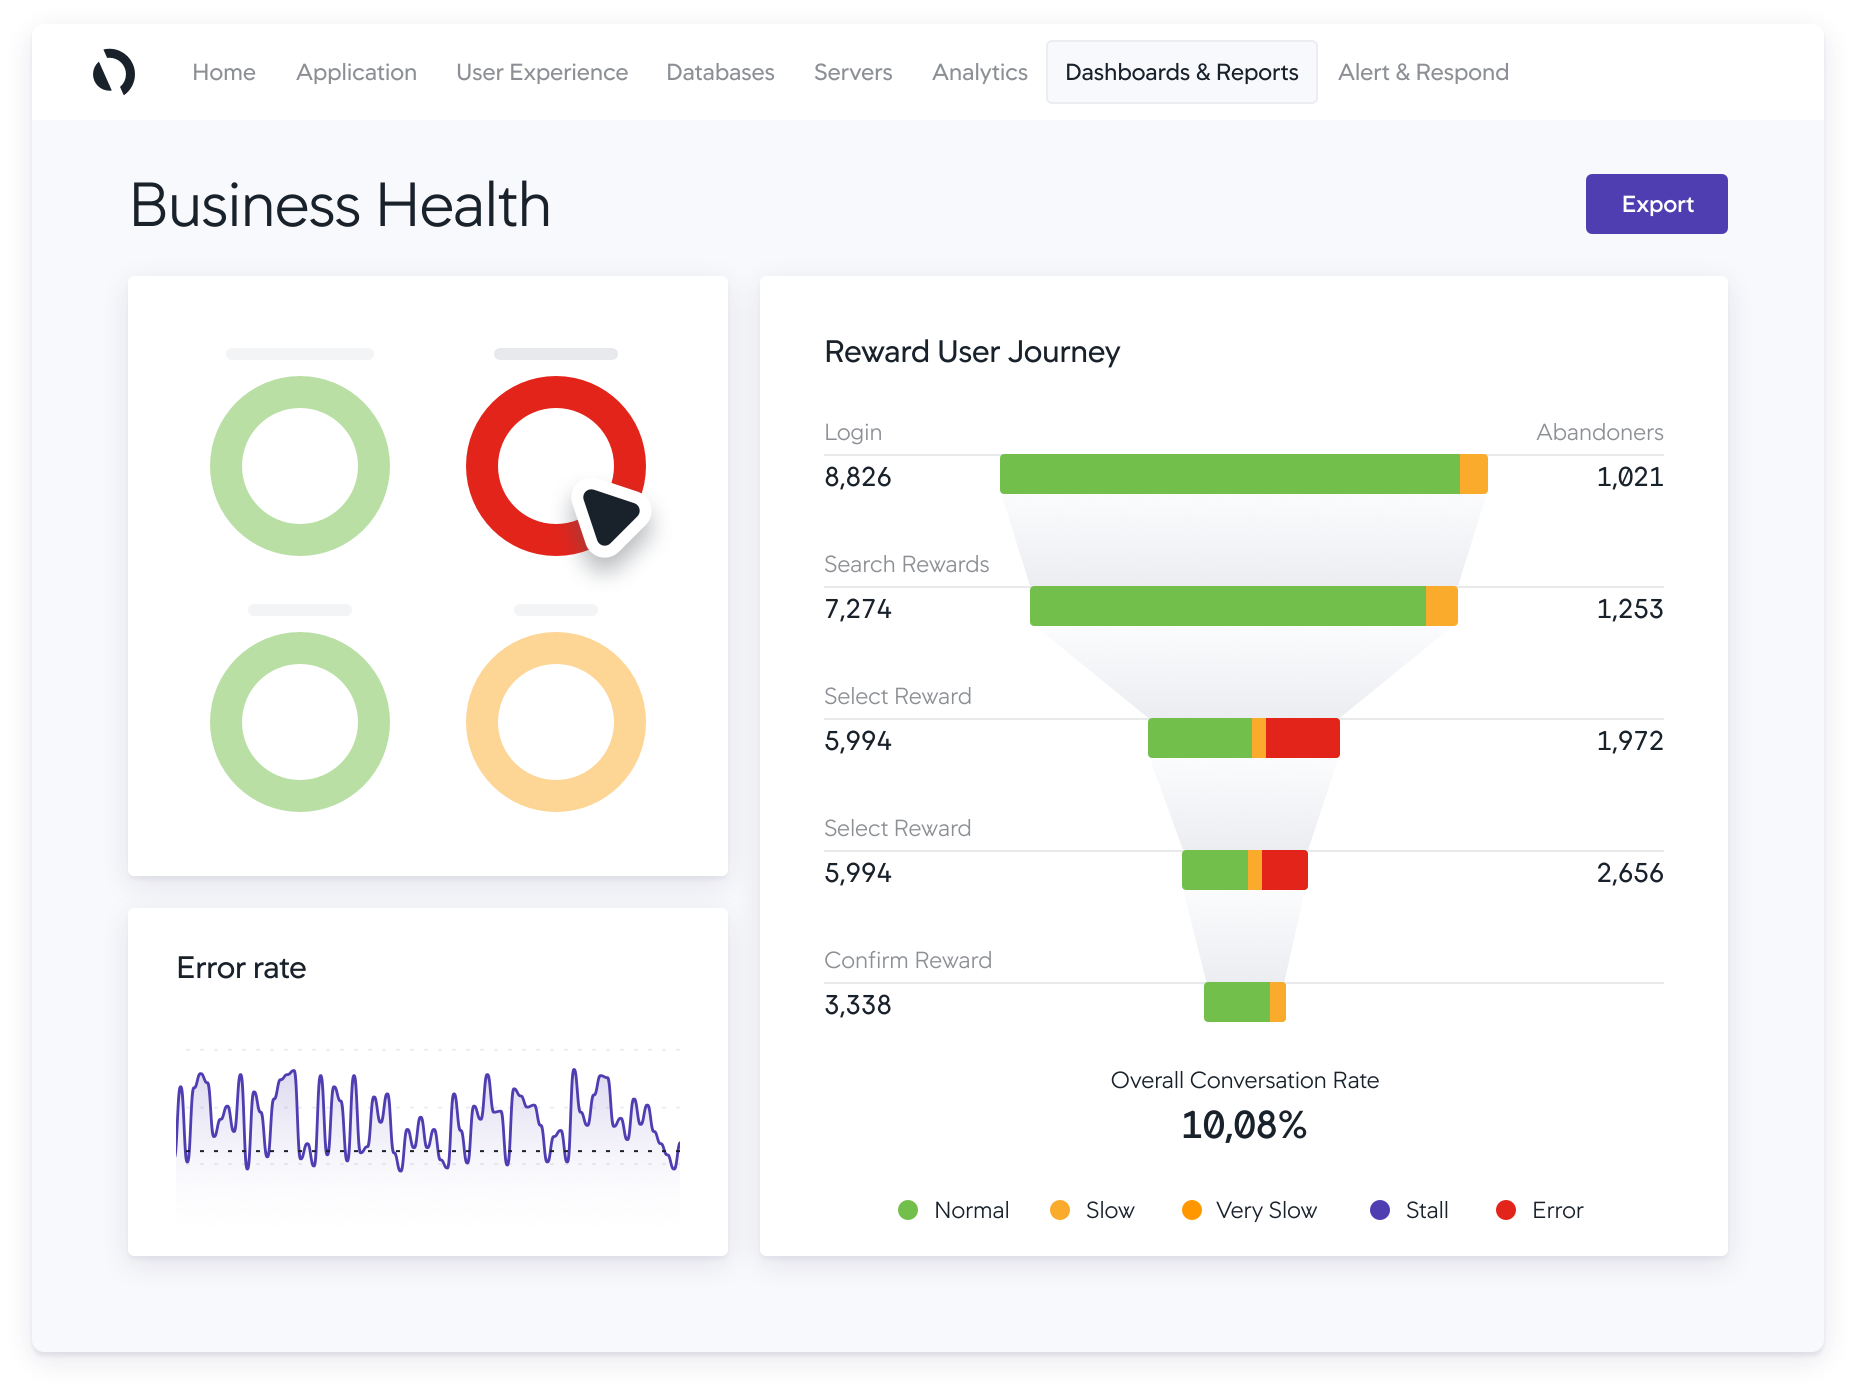
AppDynamics, now part of Cisco, is a robust APM platform built for enterprise environments. It offers real-time performance monitoring, end-to-end transaction tracing, and dynamic baselining to detect anomalies. It’s particularly strong at tying technical metrics to business performance indicators.
Pros
- Maps application dependencies automatically with a clear service topology
- Business-centric dashboards connect technical issues to revenue impact
Cons
- Limited flexibility for modern containerized environments like Kubernetes
- Agents can introduce noticeable performance overhead in high-throughput systems
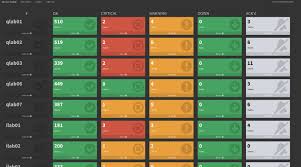
5. Nagios
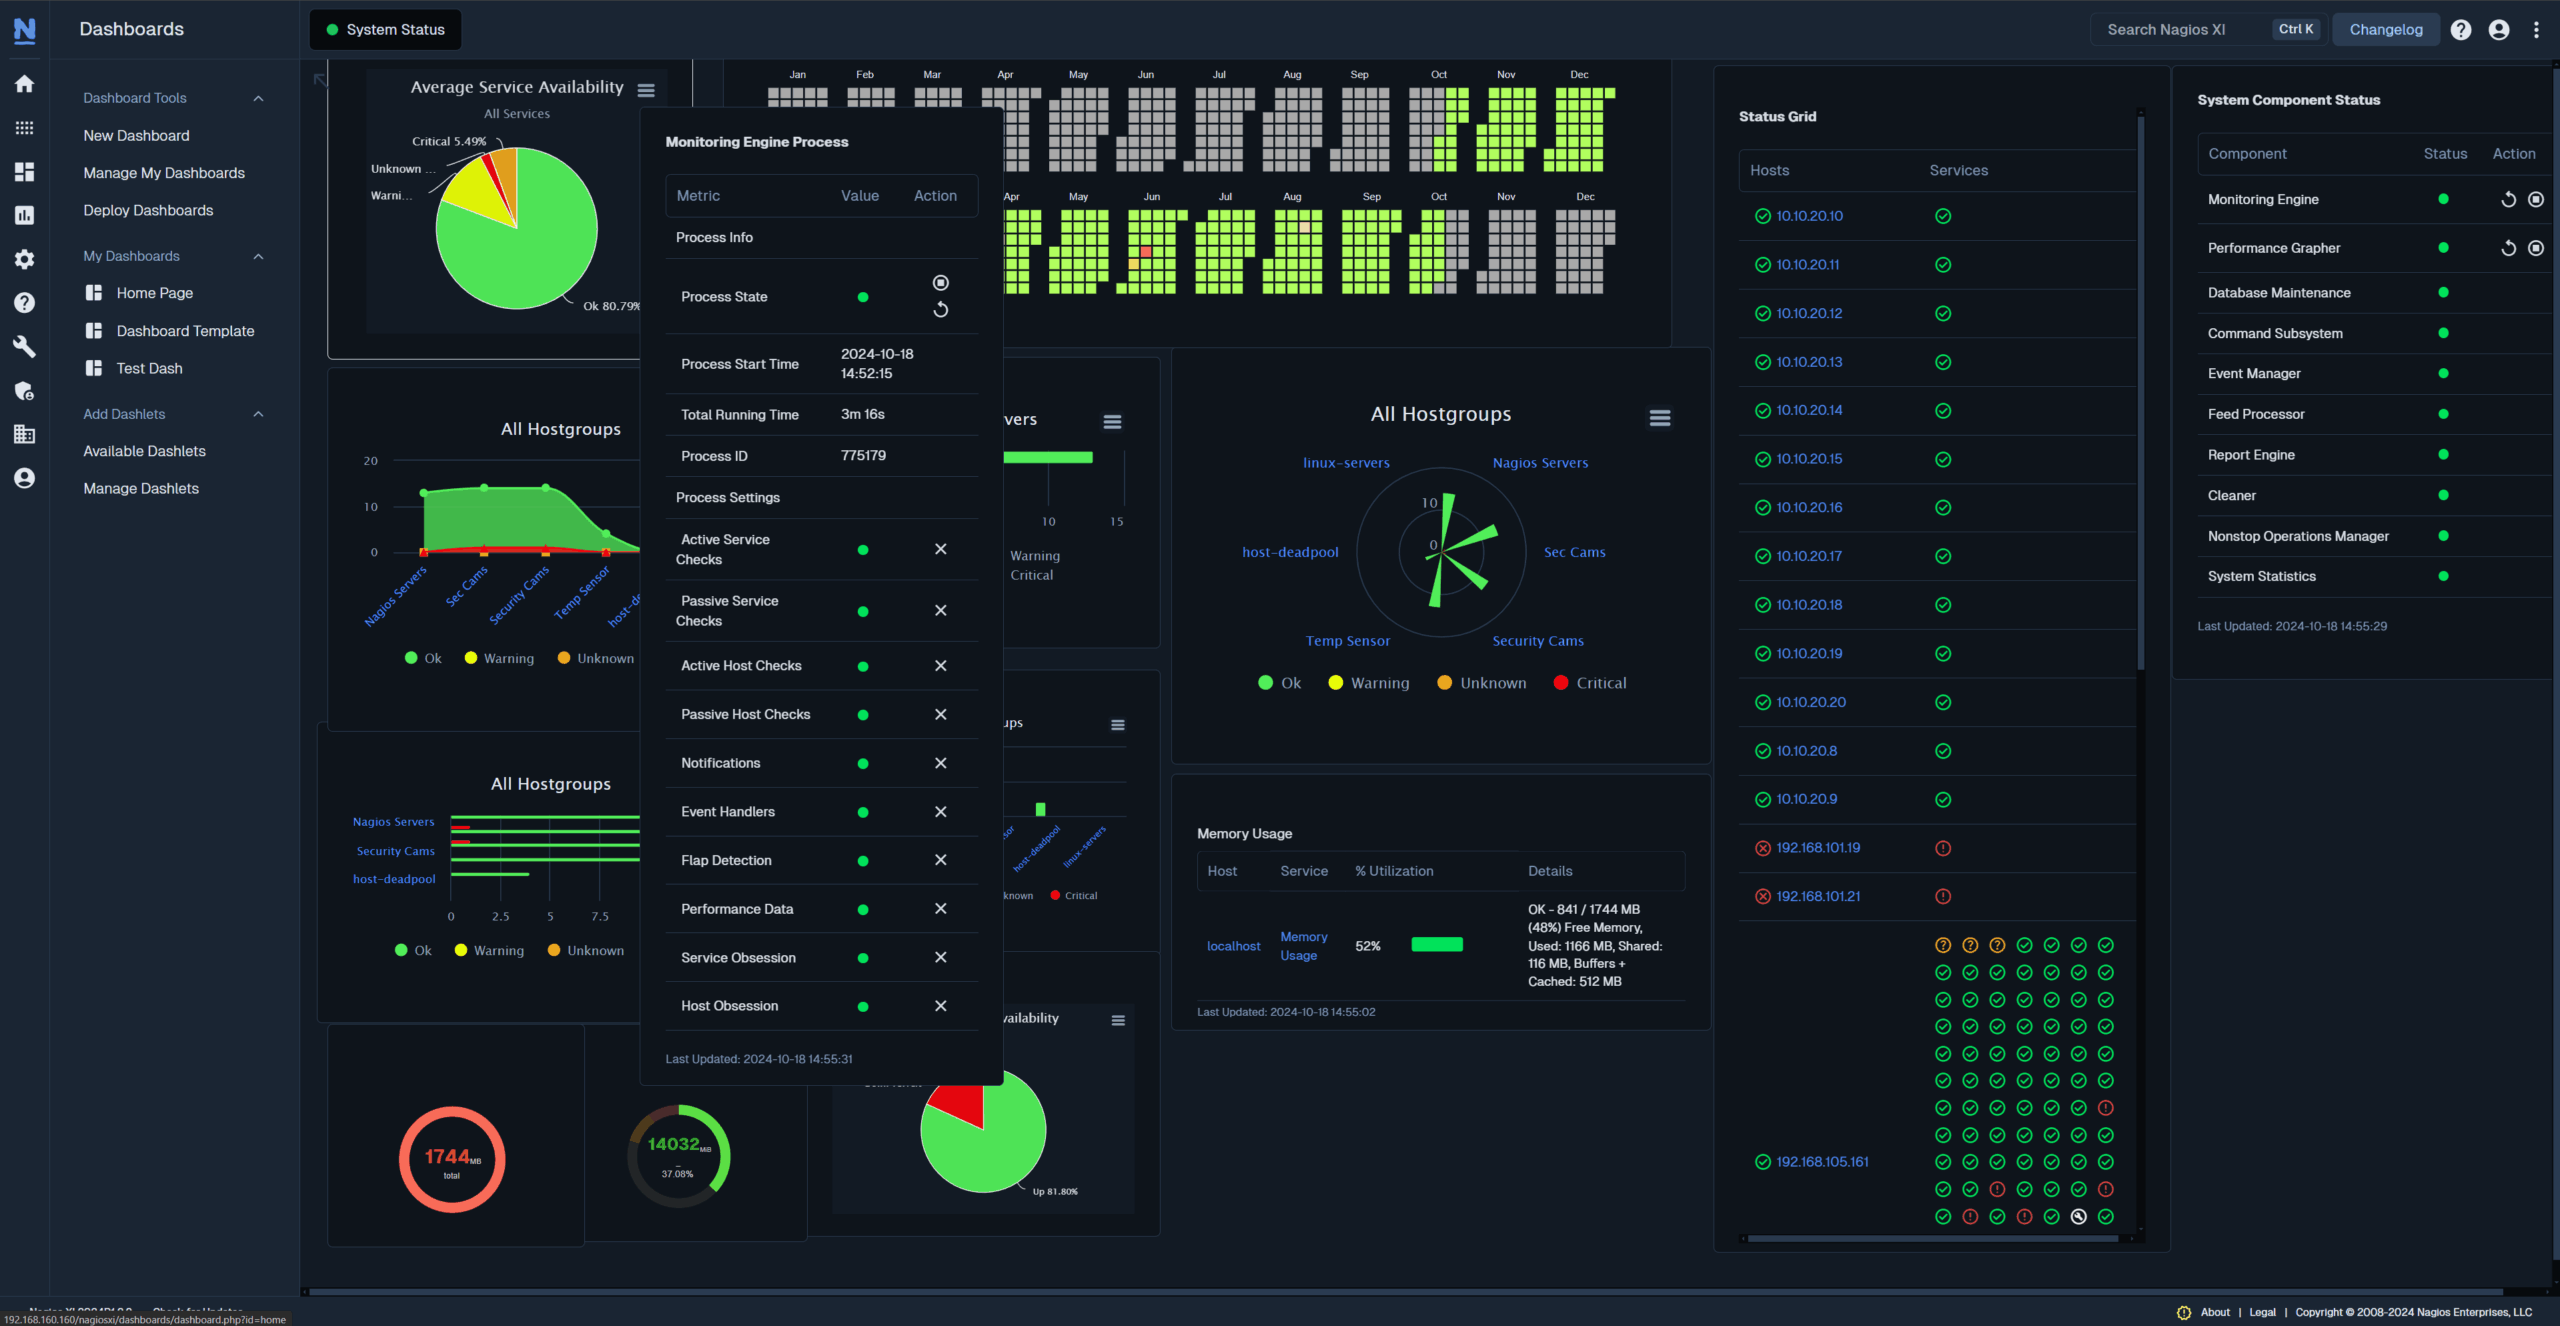
Nagios is one of the oldest and most established open-source monitoring tools, known for its reliability in monitoring servers, networks, and infrastructure components. It uses a plugin-based architecture and supports extensive customization, making it popular in traditional on-prem and hybrid environments.
Pros
- Highly customizable with a wide range of community-developed plugins
- Stable and proven in legacy and enterprise systems
Cons
- Lacks native support for modern cloud-native environments and containers
- UI and user experience feel dated compared to newer tools
6. Prometheus

Prometheus is an open-source monitoring and alerting toolkit originally developed at SoundCloud and now part of the CNCF. It excels at time-series data collection and is widely used in Kubernetes environments due to its pull-based metrics model, native service discovery, and powerful query language (PromQL).
Pros
- Ideal for containerized and cloud-native workloads like Kubernetes
- Strong community support and seamless integration with Grafana
Cons
- No native long-term storage or built-in high availability without extra setup
- Lacks built-in support for logs or traces—metrics only
7. New Relic
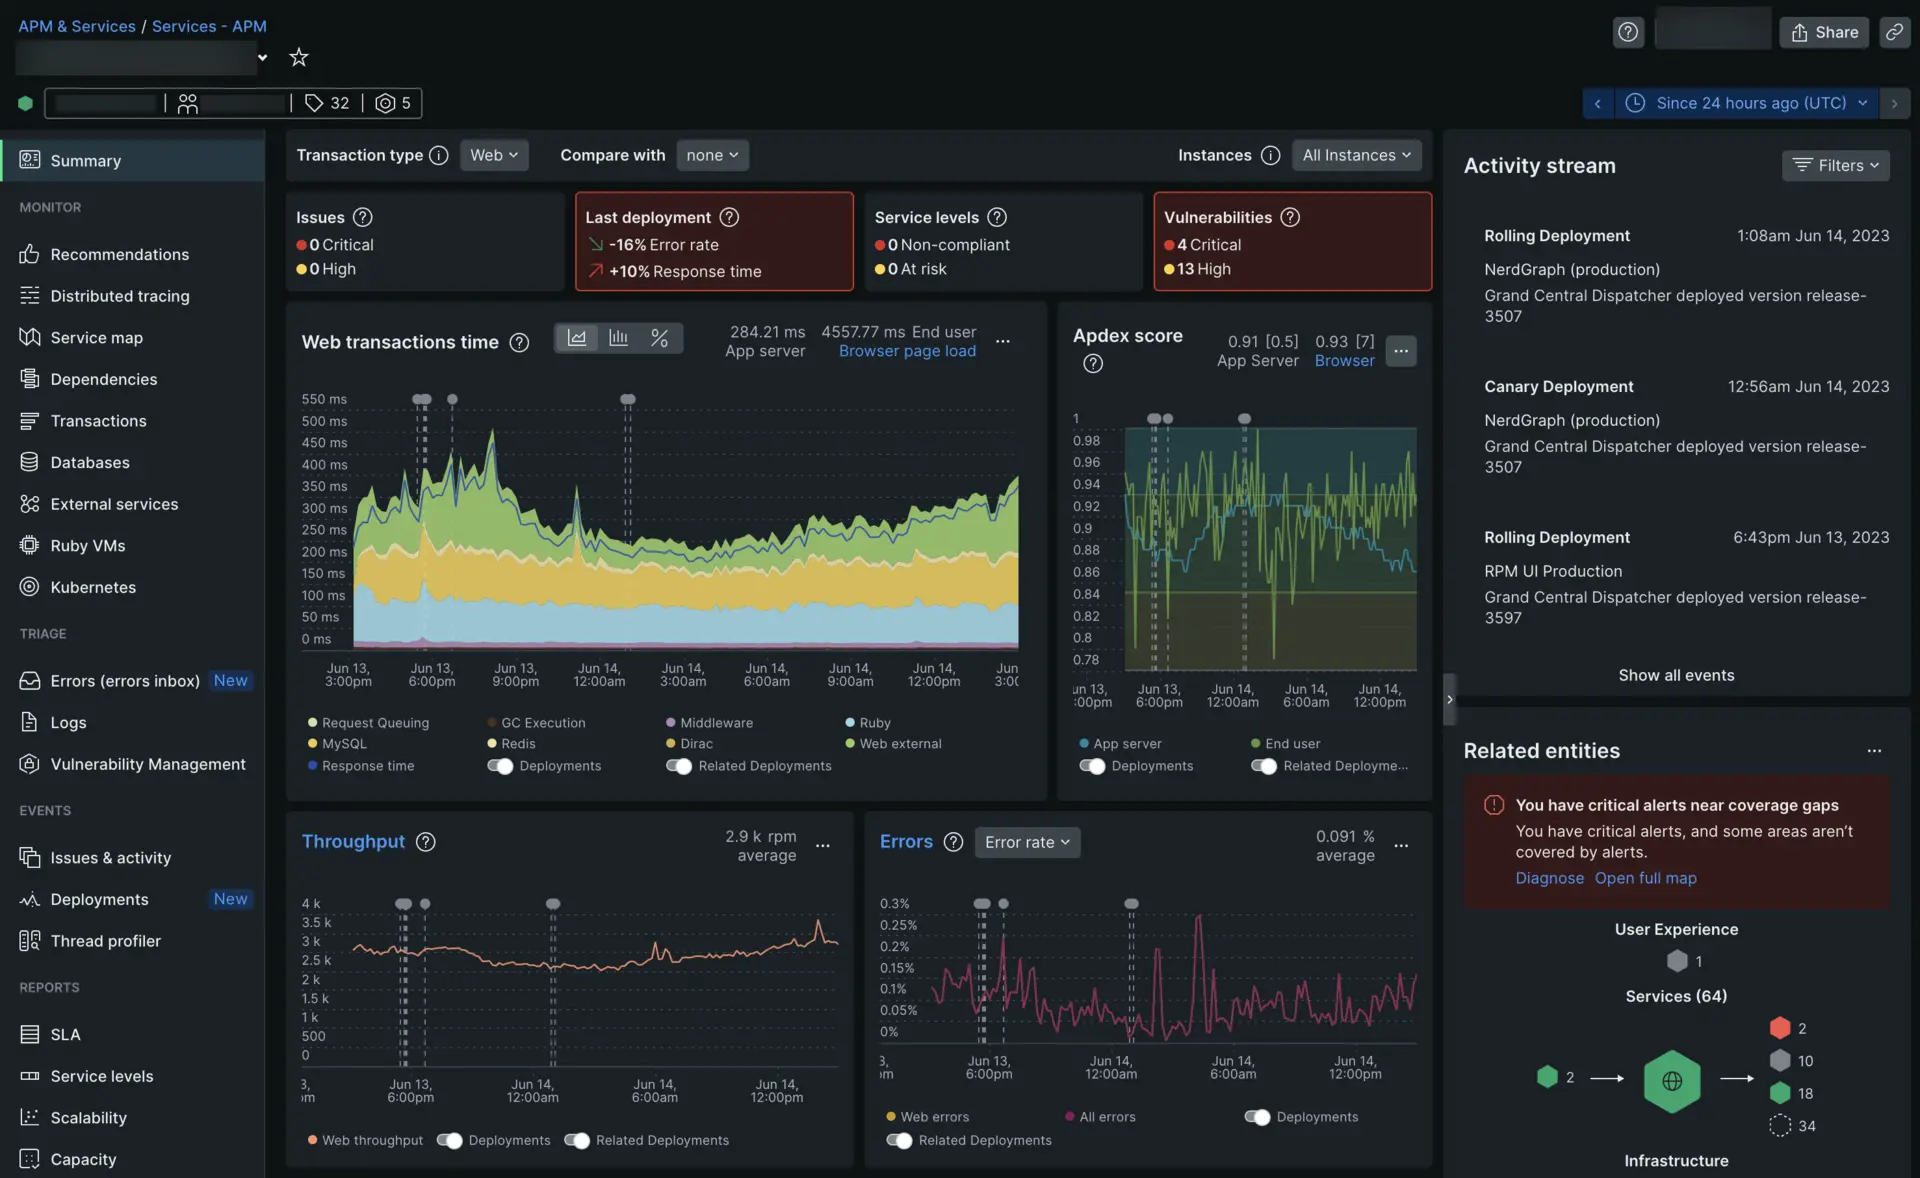
New Relic is a full-stack observability platform that unifies metrics, logs, traces, and dashboards in a single UI. Designed for cloud-native and hybrid environments, it supports APM, infrastructure monitoring, synthetics, browser insights, and custom telemetry through its Telemetry Data Platform.
Pros
- Unified observability across metrics, logs, traces, and events in one tool
- Excellent auto-instrumentation for many languages and frameworks
Cons
- Data querying relies on NRQL, which has a learning curve
- The interface can feel overwhelming due to the breadth of available features
8. Zabbix
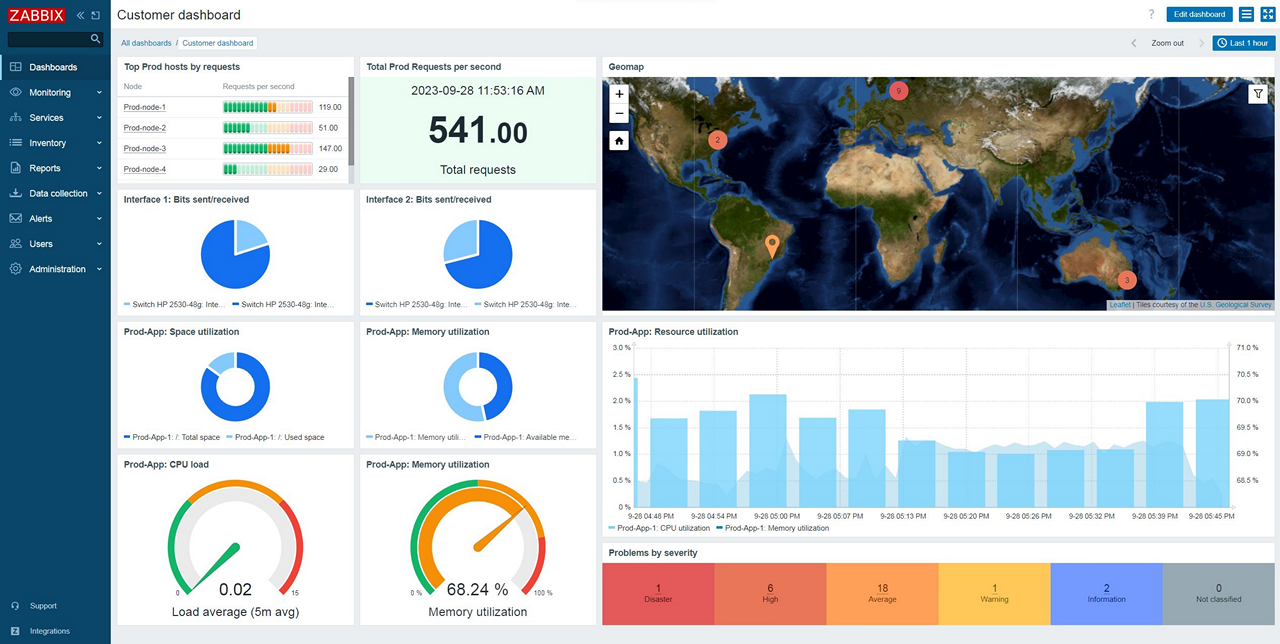
Zabbix is an open-source monitoring platform that provides deep visibility into servers, networks, and cloud infrastructure. It supports both agent-based and agentless monitoring, auto-discovery, and custom alerting, making it ideal for hybrid and enterprise IT environments.
Pros
- Flexible architecture supports SNMP, scripts, and external checks
- Built-in alerting and dashboarding without requiring third-party tools
Cons
- Requires manual tuning to avoid noisy alerts and false positives
- Scaling to large environments demands significant tuning and resource planning
9. Dynatrace
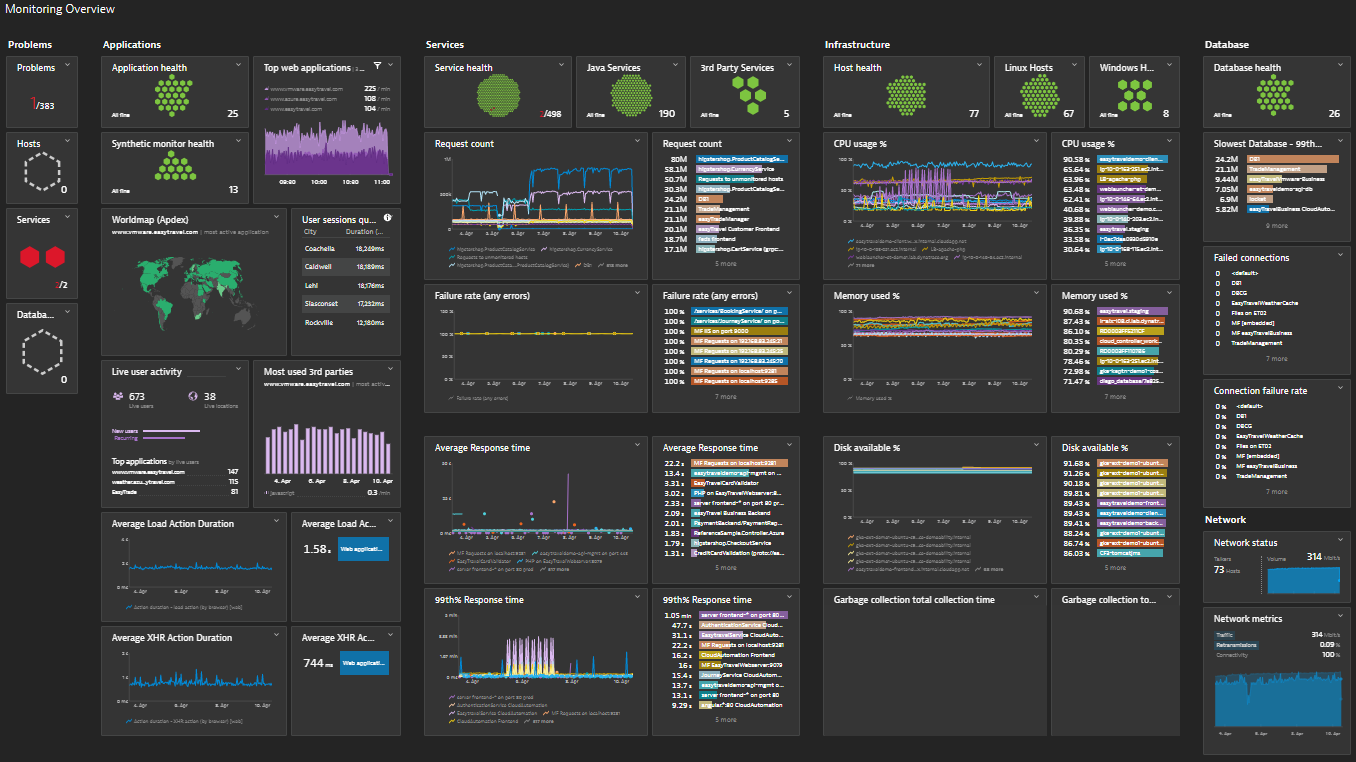
Dynatrace is an AI-powered observability platform that offers full-stack monitoring, application security, and infrastructure analytics. It uses a proprietary OneAgent to automatically instrument applications, infrastructure, and cloud environments, making it well-suited for large enterprises with dynamic workloads.
Pros
- Strong AI-driven root cause analysis and anomaly detection
- Automatic discovery and instrumentation across full tech stack
Cons
- Closed ecosystem with limited flexibility for third-party tooling
- Can be overkill for smaller teams or simple monitoring needs
10. Sensu
Sensu is an observability pipeline built for monitoring dynamic infrastructure at scale. It allows teams to collect, filter, and route monitoring events from a wide variety of sources and integrates well with both legacy and modern systems. Sensu is especially known for its event-based architecture and automation-friendly design.
Pros
- Highly customizable and works well with hybrid legacy-cloud environments
- Event-driven architecture supports dynamic, automated workflows
Cons
- Requires more configuration effort compared to plug-and-play solutions
- Smaller community and ecosystem compared to Prometheus or Nagios
11. Grafana
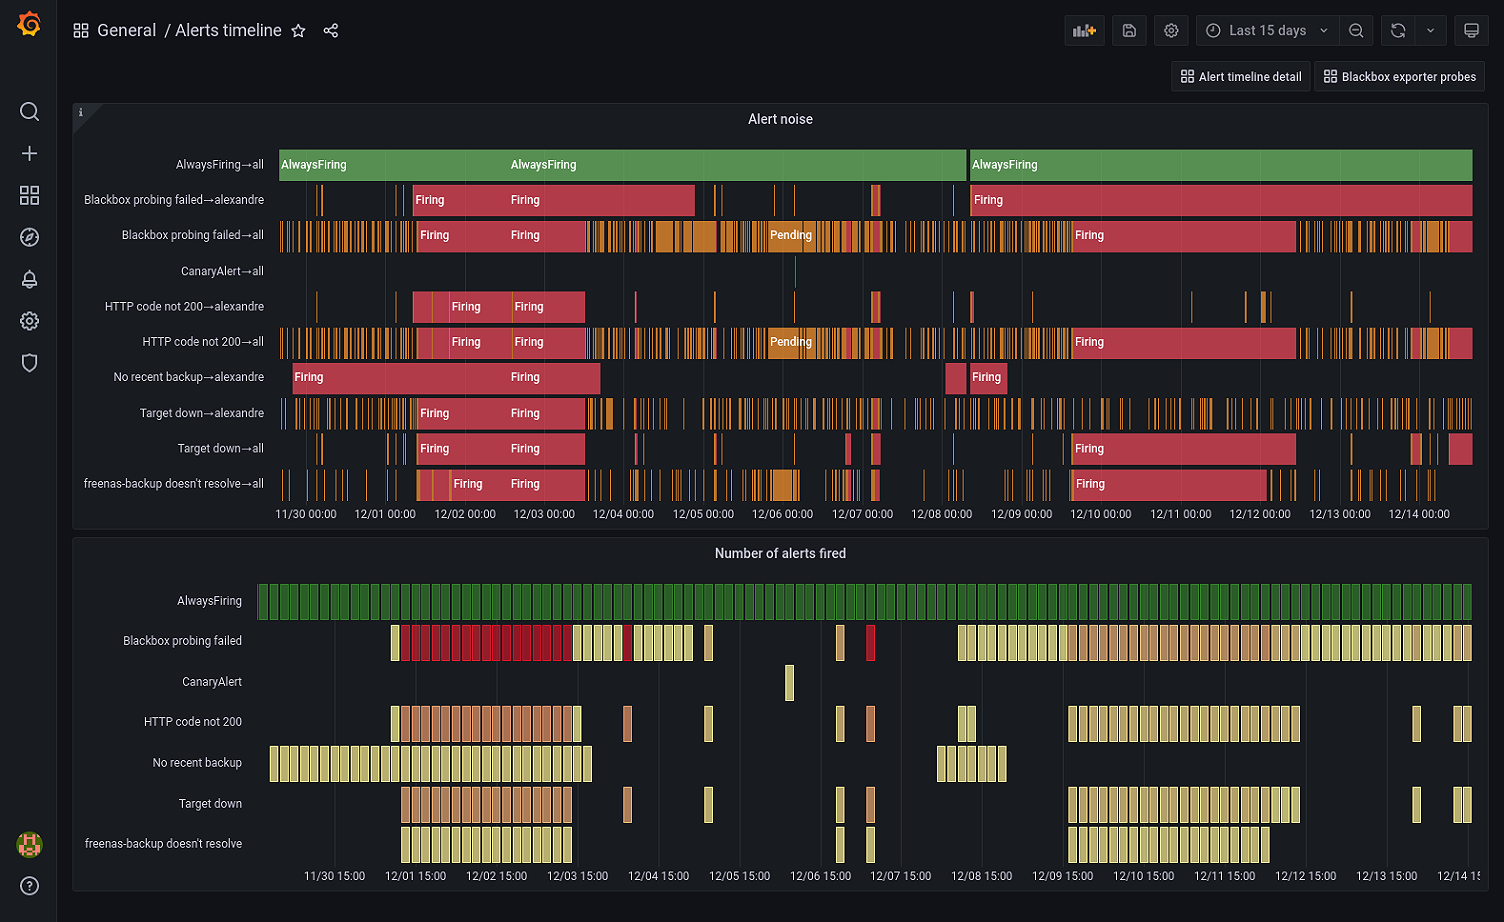
Grafana is an open-source visualization and analytics platform widely used for monitoring time-series data. It integrates with a variety of data sources like Prometheus, InfluxDB, Elasticsearch, and more. Grafana is known for its customizable dashboards and is often used as the frontend for observability stacks.
Pros
- Supports multiple data sources with rich, interactive dashboards
- Strong plugin ecosystem for panels, alerts, and integrations
Cons
- Visualization-only—requires external tools for data collection and storage
- Alerting setup can be complex, especially when combining multiple sources
12. Kibana
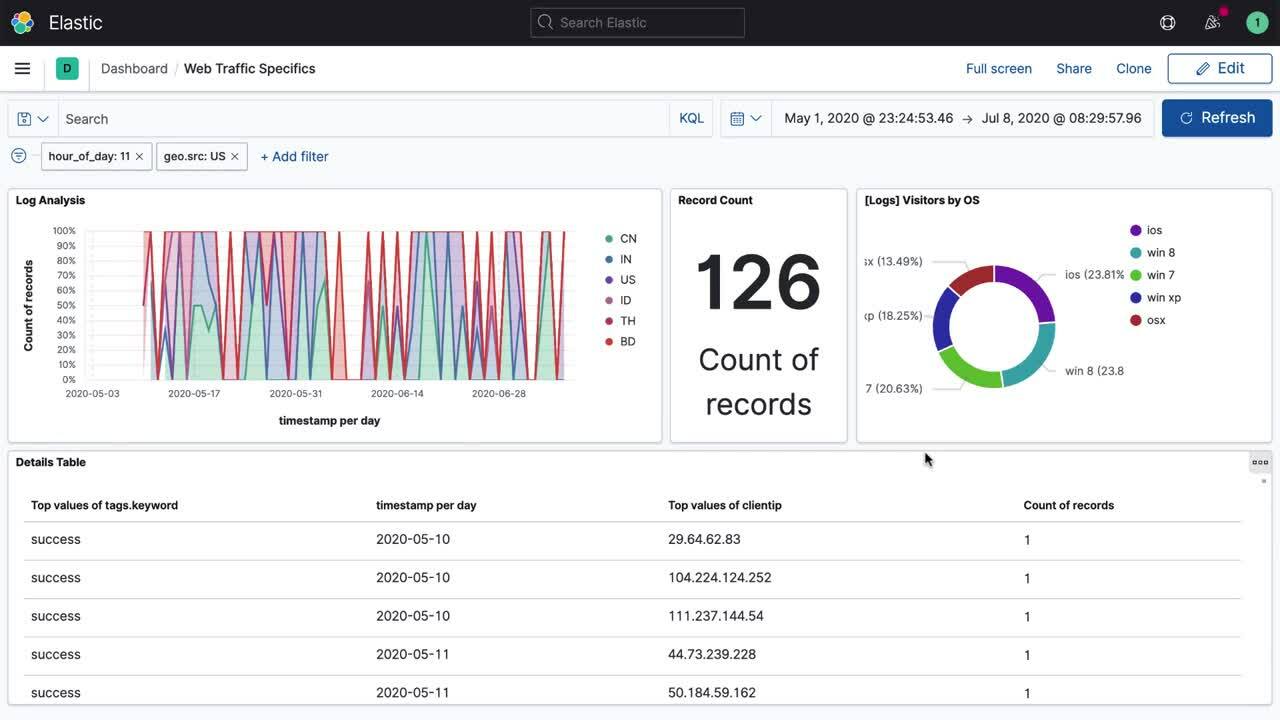
Kibana is the visualization layer of the Elastic Stack (formerly ELK Stack), used primarily to explore and visualize logs and other data stored in Elasticsearch. It’s a go-to tool for DevOps teams that need to dig into structured and unstructured log data through custom dashboards and search queries.
Pros
- Powerful log exploration with real-time filtering and full-text search
- Tight integration with Elasticsearch enables fast, scalable querying
Cons
- Requires Elasticsearch setup and tuning, which can be operationally heavy
- Not ideal for metric-based monitoring without additional tooling
13. Logstash
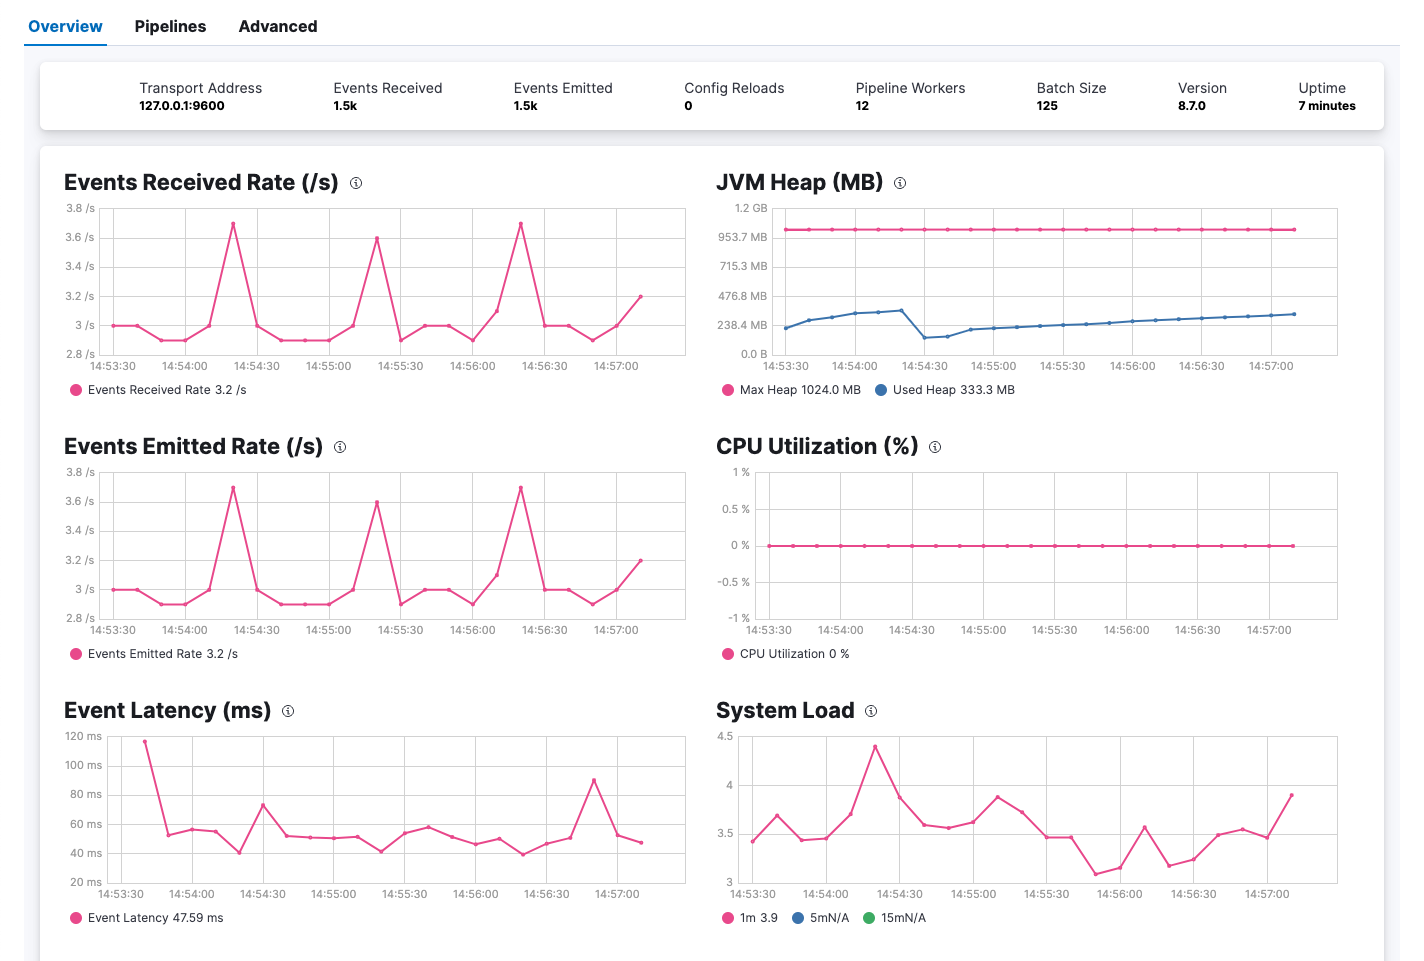
Logstash is a data processing pipeline that ingests, transforms, and ships logs and other event data. Part of the Elastic Stack, it supports a wide range of input sources, filters, and output destinations—making it highly flexible for log aggregation and enrichment in DevOps workflows.
Pros
- Supports complex data transformation with a robust plugin system
- Can handle high-volume log ingestion and parsing from multiple sources
Cons
- Configuration can be verbose and difficult to debug
- High memory usage under load, especially with complex filter chains
14. InfluxDB
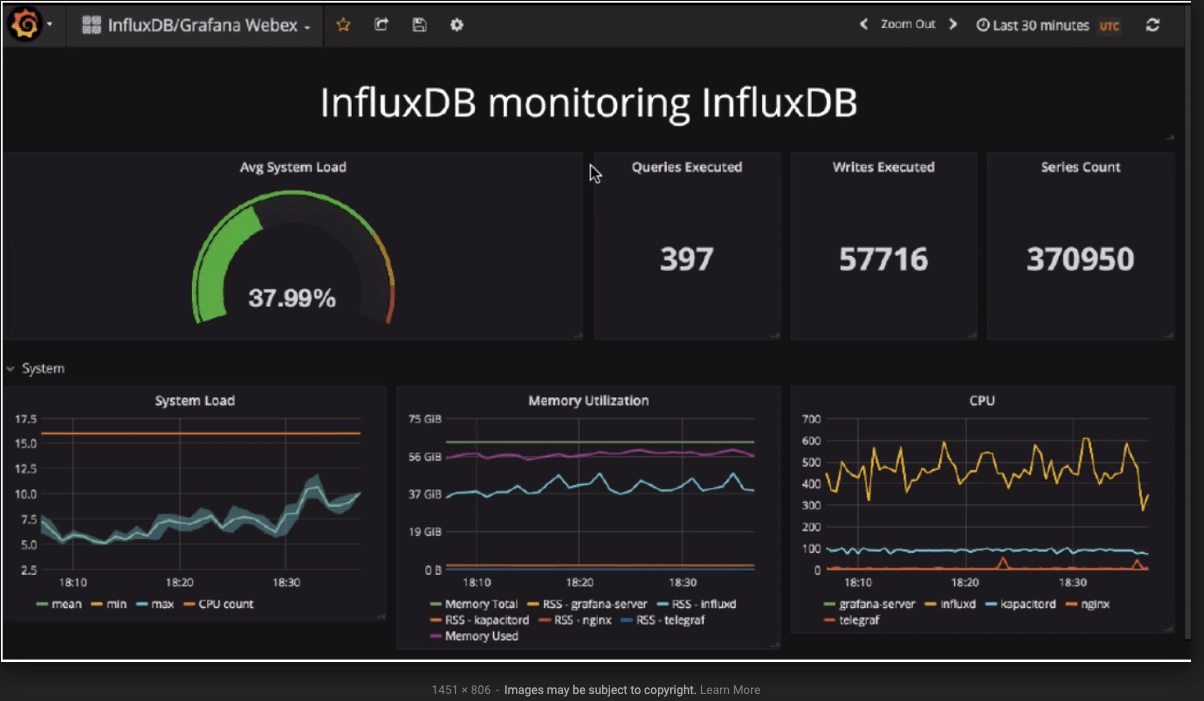
InfluxDB is a high-performance time-series database optimized for storing and querying metrics and events. It’s commonly used in DevOps for tracking system performance, IoT telemetry, and real-time analytics. With its SQL-like query language (Flux or InfluxQL), it integrates well with tools like Grafana for visualization.
Pros
- Purpose-built for time-series data with efficient storage and fast querying
- Native support for downsampling, retention policies, and data compaction
Cons
- Limited support for logs and traces—metrics only
- Requires tuning and monitoring at scale to avoid performance bottlenecks
15. Fluentd
Fluentd is an open-source data collector that unifies the logging layer in your stack. It’s commonly used in cloud-native and Kubernetes environments to collect, transform, and route log data to destinations like Elasticsearch, Kafka, or cloud storage. Its lightweight design and plugin ecosystem make it highly flexible.
Pros
- Lightweight and ideal for log routing in containerized environments
- Over 500 plugins for input, output, and data processing
Cons
- Focuses solely on log collection—no visualization or analytics built in
- Misconfigured buffering or retries can lead to data loss in high-throughput scenarios
nOps : Best DevOps Monitoring Tool
nOps goes beyond traditional monitoring—it’s an AI-powered cloud optimization platform built to help engineers and DevOps teams reduce AWS costs with minimal manual effort. From real-time cost visibility and automatic rightsizing to intelligent commitment management, nOps unifies monitoring with actionable automation.
Unlike point tools that focus on logs or metrics alone, nOps gives you a full picture of your infrastructure—and the ability to act on it.
nOps is trusted to manage over $2 billion in AWS spend and was ranked #1 in G2’s cloud cost management category.
Join our customers using nOps to understand your cloud costs and leverage automation with complete confidence by booking a demo today!